Anomaly
Detection Methods for Detecting Cyber
Attacks
in Industrial Control Systems
by
Jessamyn
Liu
B.S.,
U.S. History, U.S. Military Academy (2006)
M.Phil.,
Political Thought and Intellectual History,
University
of Cambridge (2007)
Submitted
to the Sloan School of Management
in
partial fulfillment of the requirements for the degree of
Master
of Science in Operations Research
at
the
MASSACHUSETTS
INSTITUTE OF TECHNOLOGY
September 2020
©
Massachusetts Institute of Technology 2020. All rights reserved.
Author . . . .
Sloan School of Management
August 10, 2020
Certified by . . . .
Retsef Levi
J. Spencer Standish (1945) Professor of Operations Management
Thesis Supervisor
Accepted by. . . .
Georgia Perakis
William F. Pounds Professor of Management Science
Co-director, Operations Research Center
Anomaly Detection Methods for Detecting Cyber Attacks in
Industrial Control Systems
by
Jessamyn Liu
Submitted to the Sloan School of Management on August 10, 2020, in partial fulfillment of the
requirements for the degree of Master of Science in Operations Research
Abstract
Industrial control systems (ICS) are pervasive in modern society and increasingly under threat of cyber attack. Due to the critical nature of these systems, which govern everything from power and wastewater plants to refineries and manufac-turing, a successful ICS cyber attack can result in serious physical consequences. This thesis evaluates multiple anomaly detection methods to quickly and accu-rately detect ICS cyber attacks. Two fundamental challenges in developing ICS cyber attack detection methods are the lack of historical attack data and the abil-ity of attackers to make their malicious activabil-ity appear normal. The goal of this thesis is to develop methods which generalize well to anomalies that are not in-cluded in the training data and to increase the sensitivity of detection methods without increasing the false alarm rate.
The thesis presents and analyzes a baseline detection method, the multivariate Shewhart control chart, and four extensions to the Shewhart chart which use ma-chine learning or optimization methods to improve detection performance. Two of these methods, stationary subspace analysis and maximized ratio divergence anal-ysis, are based on dimensionality reduction techniques, and an additional model-based method is implemented using residuals from LASSO regression models. The thesis also develops an ensemble method which uses an optimization formulation to combine the output of multiple models in a way that minimizes detection delay. When evaluated on 380 samples from the Kasperskey Tennessee Eastman process dataset, a simulated chemical process that includes disruptions from cyber attacks, the ensemble method reduced detection delay on attack data by 12% (55 minutes) on average when compared to the baseline method and was 9% (42 minutes) faster on average than the method which performed best on training data.
Thesis Supervisor: Retsef Levi
Acknowledgments
This thesis would not have been possible without the help of many people. I would like to thank my adviser, Retsef Levi, for providing the original motivation for this thesis, for his willingness to attack the problem again and again every week, and for continually challenging me to be more rigorous and mathematically minded. I would also like to thank MIT Lincoln Laboratory’s Lincoln Scholars Program for funding my degree and the directors of the Operations Research Center for giving a chance to a student with a very non-traditional background; it’s been a privilege to be part of the exceptionally talented and warm community at the ORC. I am deeply grateful to my family, church family, and friends at MIT for their support and encouragement over the past two years. Most of all, I thank God for His sovereignty in my life, for bringing me to Boston, and for providing the opportunity to attend MIT; I trust in His good purpose to humble me and train me in ways far beyond academics.
Contents
1 Introduction 17
1.1 Motivation . . . 17
1.2 Summary of Technical Approach . . . 20
1.3 Thesis Structure . . . 22
2 Background 25 2.1 ICS Architecture . . . 25
2.1.1 Vulnerabilities in the ICS Architecture . . . 28
2.2 Anomaly Detection in Industrial Processes . . . 29
2.3 Literature Review: Machine Learning for SPC and ICS Cyber . . . . 30
2.4 Characteristics of ICS Cyber Anomaly Detection . . . 34
3 Dataset 37 3.1 Tennessee Eastman Process (TEP) . . . 37
3.2 Kaspersky Tennessee Eastman Process (KTEP) . . . 39
3.2.1 Operating Modes . . . 40
3.2.2 Sample Types . . . 41
3.3 Data Preparation . . . 45
3.4 Notation . . . 46
4 Methodology 49 4.1 Statistical Process Control . . . 49
4.1.2 Multivariate Shewhart Control Chart . . . 51
4.2 Shewhart Chart Implementation . . . 53
4.2.1 Training and Test Sets . . . 54
4.3 Performance Metrics . . . 56
4.3.1 Modified AUC Metric . . . 57
4.3.2 Baseline Results . . . 59
5 Methods to Increase Stationarity and Separability 61 5.1 Stationarity and Separability . . . 62
5.2 Overview of Methods . . . 64
5.3 Stationary Subspace Analysis (SSA) . . . 66
5.4 Maximized Ratio Divergence Analysis (MDRA) . . . 69
5.5 LASSO Residuals . . . 70
5.6 Modified Detection Workflow . . . 72
5.7 Results . . . 73
5.7.1 Overall . . . 73
5.7.2 Stationarity . . . 74
5.7.3 Separability . . . 76
6 Ensemble Methods to Minimize Detection Delay 79 6.1 Background . . . 79
6.2 Implementing Ensemble Methods . . . 80
6.3 Stacking Method with Optimization Formulation . . . 82
6.4 Results . . . 86
7 Conclusion 91
A Kaspersky Tennessee Eastman Process Dataset 95 B Kaspersky Tennessee Eastman Process Truncated Dataset 103
D Additional SSA Results 107
E Additional MDRA Results 109
List of Figures
2-1 Purdue Enterprise Reference Architecture . . . 26 3-1 Schema of the Tennessee Eastman Process [1] . . . 39 3-2 Plots of the stripper level (feature 16) illustrate how operating modes
4, 5, and 6 (bottom row) are less stationary than modes 0, 1, 2, 3 (top row) . . . 41 3-3 Plots of the reactor feed (feature 26) illustrate how the four transient
types (shown in blue) deviate from a single state sample (shown in orange); the transient samples types from L to R are C purge, product mix, product rate, reactor pressure . . . 43 3-4 Plots of the reactor feed (feature 26) illustrate how the four attack
types (shown in blue) deviate from a single state sample (shown in orange); the attack types from L to R are type 21, 22, 23, 24 . . . 44 4-1 Shewhart control chart detection workflow . . . 53 4-2 Example Shewhart control chart with performance measures . . . . 58 4-3 ROC curve (left) and detection delay plotted as a function of false
alarm rate (right, example modified AUC metric) . . . 59 5-1 Example plots in which increasing stationarity and separability
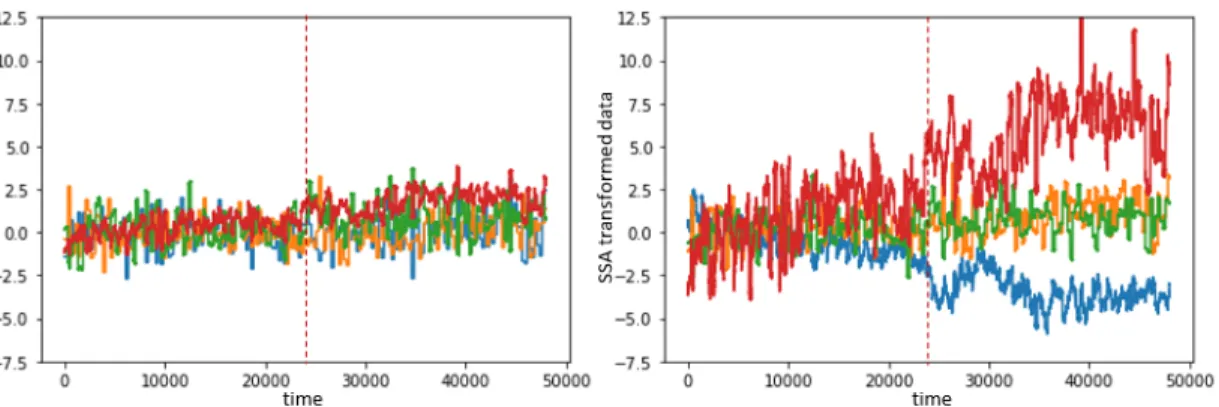
re-duces detection delay . . . 63 5-2 Four KTEP features before SSA (left) and after SSA (right), change
5-3 Three raw KTEP features (left) and three KTEP features after MDRA, reduction order 3, has been applied (right); red is class 0 (pre-change), grey is class 1 (post-change) . . . 69 5-4 Modified detection workflow; additional methods (left) applied to
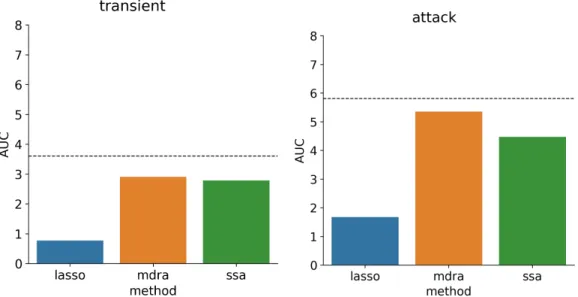
data prior to the control chart workflow (right) . . . 72 5-5 Average AUC by model type, transient samples (left) and attack
samples (right), lower is better; dashed line indicates performance of baseline method . . . 74 5-6 Average detection delay for false alarm rate 0, by model type,
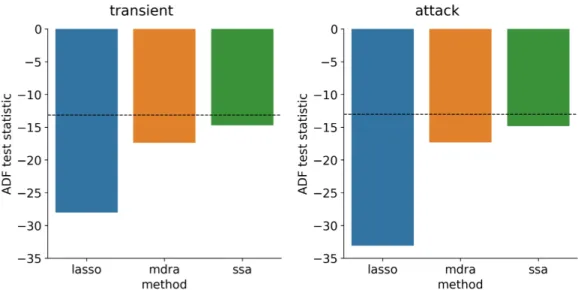
tran-sient samples (left) and attack samples (right), lower is better; dashed line indicates performance of baseline method . . . 74 5-7 Average ADF by model type, transient samples (left) and attack
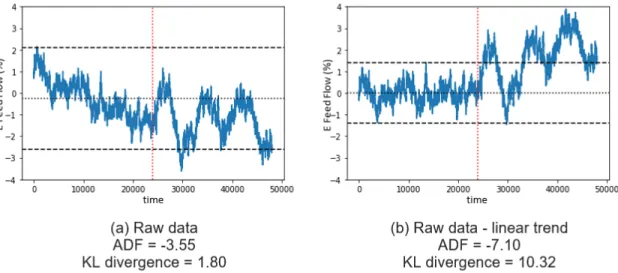
samples (right); lower values indicates higher confidence that the data is stationary, dashed line indicates performance of baseline method . . . 76 5-8 Comparison of raw data to LASSO residuals shows that LASSO
mod-els are able to remove linear trend, result in more stationary signal . 76 5-9 Average KL divergence by model type, transient samples (left) and
attack samples (right); higher values indicates higher separability, dashed line indicates performance of baseline method . . . 77 5-10 Comparison of raw data to LASSO residuals shows that LASSO
resid-uals move pre-change and post-change means closer together, mak-ing the change point more difficult to detect . . . 78 6-1 Ensemble fault detection workflow . . . 81 6-2 Average AUC by model type, transient samples (left) and attack
samples (right); dashed line indicates performance of baseline method 90 6-3 Average detection delay for false alarm rate 0 by model type,
tran-sient samples (left) and attack samples (right); dashed line indicates performance of baseline method . . . 90
A-1 Separator temperature, by mode and attack type, change point in dashed red, normal in dashed orange . . . 100 A-2 Separator temperature, by mode and transient type, change point in
dashed red, normal in dashed orange . . . 101 C-1 Example product cost time series (10,000 time steps) and ACF plot . 105 E-1 Univariate pre-change and post-change distributions for mode 5 (top)
List of Tables
3.1 Downs and Vogel operating modes with corresponding KTEP modes 41
4.1 Number of samples in each train set by mode . . . 55
4.2 Number of samples in each test set by mode . . . 55
4.3 Multivariate Shewhart chart results, transient samples . . . 60
4.4 Multivariate Shewhart chart results, attack samples . . . 60
5.1 Overview of methods described in Chapter 5 . . . 66
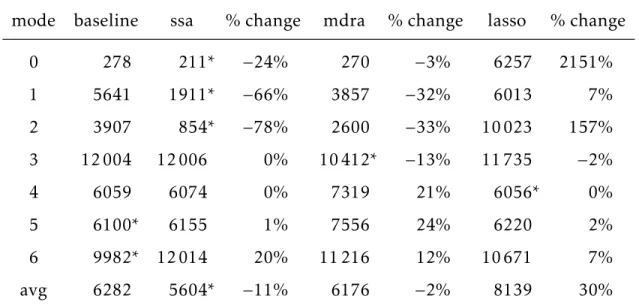
5.2 Detection delay for false alarm rate 0, transient samples; asterisk indicates lowest detection delay for each mode . . . 75
5.3 Detection delay for false alarm rate 0, attack samples; asterisk indi-cates lowest detection delay for each mode . . . 75
6.1 Detection delay for false alarm rate 0, attack samples; comparison of best transient model, optimized ensemble method, and LASSO residuals method; asterisk indicates lowest detection delay for each mode . . . 87
6.2 Summarized results, attack samples (N=380); significance is reported for a 1-tailed t-test . . . 89
A.1 KTEP Measured Variables . . . 97
A.2 KTEP Manipulated Variables . . . 98
A.3 KTEP Other Variables . . . 98
B.1 Full KTEP dataset split into modes and sample types . . . 103 B.2 Truncated KTEP dataset split into modes and sample types . . . 104 D.1 SSA AUC results for both non-stationary sources (n) and stationary
sources (s), epochs 4000, 8000, 12000, attack samples; asterisk indi-cates lowest AUC for each mode . . . 108 D.2 SSA AUC results for both non-stationary sources (n) and stationary
sources (s), epochs 4000, 8000, 12000, transient samples; asterisk indicates lowest AUC for each mode . . . 108 E.1 Selected AUC results, MDRA transient samples; asterisk indicates
lowest AUC for each mode . . . 109 E.2 Selected AUC results, MDRA attack samples; asterisk indicates
low-est AUC for each mode . . . 110 F.1 Detection delay for false alarm rate 0, attack samples (part 1 of 2);
significance is reported for a 1-tailed t-test . . . 114 F.2 Detection delay for false alarm rate 0, attack samples (part 2 of 2);
significance is reported for a 1-tailed t-test . . . 115 F.3 AUC for false alarm rate 0, attack samples (part 1 of 2); significance
is reported for a 1-tailed t-test . . . 116 F.4 AUC for false alarm rate 0, attack samples (part 2 of 2); significance
Chapter 1
Introduction
In this thesis, we evaluate multiple anomaly detection methods used to detect cy-ber attacks in an industrial control system. This chapter will motivate the research question, introduce the problem setting, and outline the structure of the thesis.
1.1
Motivation
Industrial control system (ICS) is a general term which describes the integration of hardware and software used to govern physical processes in a wide range of indus-trial and critical infrastructure sectors, such as manufacturing, chemical, energy, water and wastewater, and transportation. The National Institute for Standards and Technology defines an ICS cyber attack as "an attempt to gain unauthorized access to system services, resources, or information, or an attempt to compromise system integrity, availability, or confidentiality" [2]. As industrial control systems are pervasive and essential in modern society, effective ICS cybersecurity is neces-sary to ensure reliable operation of industrial processes, protect national security, and minimize risk to health and safety, damage to the environment, and financial loss.
Although there are many more reports regarding cyber attacks on information technology (IT) systems than ICS, the number of the latter incidents is rising. In February 2020, IBM’s X-Force Threat Intelligence Index identified a sharp increase
in ICS cyber incidents, reporting more ICS cyber events in 2019 than in the previ-ous three years combined [3]. A separate survey conducted by the SANS Institute, a cybersecurity research and education organization, found that the percentage of industrial sites with control systems which experienced three or more cyber inci-dents in a 12 month period increased from 35% in 2017 to 58% in 2019 [4].
In addition to the increased frequency of ICS cyber targeting incidents, the sophistication and severity of successful attacks continues to grow. SANS reports that the recent growth in cyber incidents is attributed to " foreign nation-states and organized crime where disruption or destruction is the main objective" [4]. As an analyst for the ICS cyber security firm Dragos observed, ICS cyber events have pro-gressed from "data gathering. . . to active disruption of operations. . . to potentially seeking physical destruction" [5]. The examples of notable ICS cyber attacks in the past decade listed below show that that ICS cyber actors have both the ability and willingness to execute attacks which could result in serious physical consequences (i.e., damage to equipment, loss of critical services, and risk to public safety).
• In June 2010, Stuxnet, the first publicly known malware to target ICS, was discovered (the malware was likely active since 2005). Stuxnet caused sub-stantial physical damage to Iranian nuclear centrifuges by modifying the programmable logic controller (PLC) control parameters while simultane-ously relaying expected system values to make it appear that operations were normal [6, 7].
• In August 2013, an individual suspected of working on behalf of the Iranian Revolutionary Guard Corps (IRGC) illegally accessed the supervisory control and data acquisition (SCADA) systems of the Bowman Dam in Rye, New York though an unsecured wireless network [7].
• In 2014, a cyber attack on a German steel mill prevented the blast furnace from shutting down properly and resulted in massive physical damage [8]. • In December 2015 and December 2016, suspected Russian hackers attacked
• In August 2017, the safety systems of Saudi Aramco, the world’s largest oil company, were targeted in an apparent attempt to cause massive physical damage; ultimately, no damage was caused due to an emergency shutdown [9].
• In March 2019, a U.S. power company which serves multiple western states experienced a "cyber event" that disrupted operations but did not cause black-outs [10].
• In April 2020, Israel’s cybersecurity agency and the Israel Water Authority thwarted an attempt to disrupt water treatment and water distribution net-works in two rural districts; the failed cyber attack was attributed to Iran [11].
• In May 2020, a cyber attack targeting Iran’s Shahid Rajaee port terminal took port computers offline and disrupted port operations for multiple days, an attack believed to have been carried out by Israel in retaliation for the at-tempted April 2020 cyber attack [12].
Beyond these reported attacks, the U.S. Department of Homeland Security’s (DHS) Industrial Control Systems Cyber Emergency Response Team (ICS-CERT) has issued numerous alerts of increased cyber activity targeting critical infras-tructure, warning in particular of activity from advanced persistent threat (APT) groups based in Russia and Iran [13, 14, 15, 16]. These warnings, the rising num-ber of ICS cynum-ber events, and the examples of successful attacks have heightened awareness about the risk of ICS cyber attack and increased demand for methods to detect cyber attacks in industrial control systems. In particular, new methods are needed which can detect sophisticated and previously unseen ICS cyber attacks quickly (before the attack damages the industrial system or threatens safety) and accurately (to minimize system downtime and impact on operations).
1.2
Summary of Technical Approach
This thesis evaluates multiple anomaly detection methods to detect cyber attacks in industrial control systems. Although there is substantial existing work on anomaly and fault detection in industrial settings, ICS cyber attack detection presents unique challenges.
First, unlike faults caused by equipment failures or operator error, cyber at-tacks are caused by malicious actors who seek to avoid detection by making dis-ruptions appear normal. Since cyber attacks may mimic normal operations, they are not easily detected by existing methods, which are designed to alarm when a process deviates from normal operations by a predetermined threshold. This thesis uses machine learning methods to learn correlations across different pro-cess measurements in order to increase the sensitivity of fault detection methods without increasing false alarm rate.
Second, there are no known publicly available data sets which represent real world ICS cyber attacks. A single industrial site may only experience a small num-ber of attacks and sharing data across sites is difficult due to the unique and often proprietary nature of industrial data. Moreover, since attacks are constantly are evolving to exploit new vulnerabilities, even if historical attack data existed, there is no guarantee that future attacks would be similar to past attacks. The lack of historical attack data and the limited utility of the historical data, when it does ex-ist, makes it hard to develop predictive models based on the traditional approach of having two clearly labeled classes: normal and attack. In order to address this challenge, this thesis explores fault detection methods which generalize well to anomalies which are unseen in training data. More specifically, the thesis devel-ops methods which can be trained without access to attack data and still perform well when evaluated on attack data by recognizing deviation from a state of nor-mal operations.
In all cases, the methods presented in this thesis are evaluated both on their ability to quickly detect ICS cyber attacks and their ability to maintain a very low
false alarm rate (close to zero). Most industrial control systems are designed to operate continuously (e.g. power plants, water treatment systems, transportation systems). As a result, ICS operators have a strong aversion to false alarms in attack detection, since attacks are rare and false alarms result in system downtime to in-vestigate a possible attack. High false alarm rates prevent the acceptance of many anomaly detection algorithms, so achieving a false alarm rate which approaches zero is an operational requirement in many ICS settings.
The thesis leverages the Kasperskey Tennessee Eastman process (KTEP) dataset [1], which is a simulated chemical process that includes simulated cyber attacks. Specifically, the thesis presents and analyzes a baseline method and four addi-tional detection methods for early detection of novel cyber attacks (anomalies which are not included in the training) while keeping false alarm rates low. The baseline approach is based on the multivariate Shewhart control chart, a standard method in statistical process control [17]. In addition to the baseline method, the thesis describes four extensions to the Shewhart chart which use machine learning or optimization methods to improve detection performance. Two of these methods are based on dimensionality reduction techniques (stationary subspace analysis [18] and maximized ratio divergence analysis [19]) which are applied to the data to transform it before sending it as input to the Shewhart control chart; these meth-ods are designed to either filter out non-stationary noise from the signals used for fault detection or increase the separability of data drawn from normal operations and data drawn after a fault or attack has occurred. An additional model-based fault detection method is implemented using residuals from LASSO (least absolute shrinkage and selection operator) regression models as the input to the Shewhart control chart. Finally, since the analysis suggests that no single method dominates all others, the thesis develops an ensemble method to combine the output of multi-ple models based on an optimization formulation that selects the ensemble which minimizes detection delay.
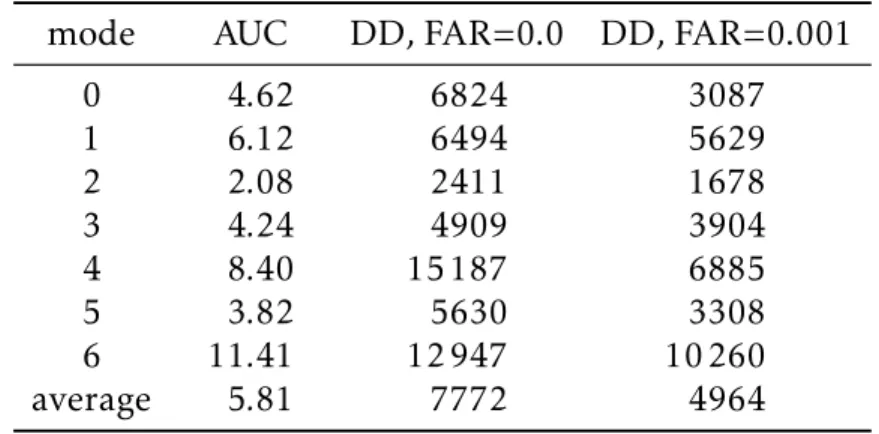
All four of the methods evaluated outperform the baseline method on attack data when evaluated on detection delay over a range of false alarm rates.
How-ever, in addition to seeking methods which reduce detection delay over a range of false alarm rates, this thesis seeks methods which reduce detection delay on attack data when the false alarm rate is set to zero, which is highly desirable in an industrial setting. The KTEP dataset includes seven different operating modes and no single method achieves the lowest detection delay for every mode when the false alarm rate is set to zero. When the method which performed best on the training data is selected for each mode and applied to attack data, detection delay is reduced by 3% (13 minutes) on average when compared to the baseline method. In contrast, the ensemble method reduced detection delay on attack data by 12% (55 minutes) on average when compared to the baseline method. In almost every mode, the model which performed best on the training set (which includes proxy attack data instead of real attack data) did not perform best on attack data, yet the ensemble method was able to learn an ensemble based only on training data, which significantly improves out of sample detection performance when compared to the baseline method and the best single method.
1.3
Thesis Structure
The remainder of this thesis is organized as follows:
• Chapter 2 (Background) provides background on industrial control systems, introduces concepts of statistical process control, and reviews existing litera-ture related to machine learning methods applied to process control and ICS cyber attack detection. The chapter also discusses the unique characteristics of the ICS cyber attack setting and the need for new methods to improve ICS cyber attack detection.
• Chapter 3 (Dataset), introduces the Kaspersky Tennessee Eastman process, a simulation of a chemical processing plant with disruptions caused by simu-lated cyber attacks [1]. The dataset’s large size, complex and varied
anoma-lous behavior examples, and exact labels for normal and anomaanoma-lous behav-iors make it well-suited to the research tasks in this thesis.
• Chapter 4 (Baseline methods) presents a baseline model based on the mul-tivariate Shewhart control chart, a fault detection method from statistical process control which is widely used in industrial settings. The chapter also introduces metrics which will be used to evaluate all proposed approaches and motivate the need for additional methods to improve detection perfor-mance.
• Chapter 5 (Methods to increase stationarity and separability) describes dif-ferent machine learning based approaches that increase the stationarity and separability of the input fed into the Shewhart control chart to improve the baseline performance. The methods described in this chapter are station-ary subspace analysis (SSA), maximized ratio divergence analysis (MDRA), and a model-based fault detection framework using residuals from LASSO regression models.
• Chapter 6 (Ensemble methods to minimize detection delay) describes an en-semble method to improve overall detection performance. Given that no single fault detection method described in Chapter 5 dominates, the ensem-ble method selects a weighted combination of the results from each method and improves the overall performance.
• Chapter 7 (Conclusion) summarizes the work and proposes areas of future research.
Chapter 2
Background
This chapter provides background on the structure of industrial control systems and their vulnerabilities. Additionally, the chapter reviews existing literature re-lated to machine learning methods applied to process control and ICS cyber attack detection. Finally, the chapter summarizes key characteristics of the ICS cyber at-tack detection problem setting, noting that due to the intentional and malicious nature of cyber attacks, new methods are needed to improve sensitivity to previ-ously unknown attacks and to attacks which are designed to avoid detection.
2.1
ICS Architecture
Industrial control systems can include a wide variety of devices, networks, and systems used to operate industrial processes. The most common types of indus-trial control systems are supervisory control and data acquisition (SCADA) sys-tems, distributed control systems (DCS), and configurations of lower-level control devices such as remote terminal units (RTU) and programmable logic controllers (PLC) [2]. In addition to these components, the larger ICS architecture may also include databases, servers, and workstations related to planning and managing the industrial processes as well as connections to the enterprise network, which is the network on which business decisions and coordination between multiple industrial sites typically takes place.
The Purdue Enterprise Reference Architecture (referred to as the Purdue Model, see Figure 2-1) is a framework for understanding industrial control systems and has been used to provide consistent terminology in control system security stan-dards such as the National Institute of Stanstan-dards and Technology (NIST) Guide to Industrial Control Systems (ICS) Security (SP800-82) and other related inter-national standards for control system and enterprise system integration [2].1 Al-though modern industrial systems are less hierarchical and more interconnected than the Purdue Model suggests, the core components of the Purdue Model still provide a baseline for understanding and discussing ICS cyber security.
Figure 2-1: Purdue Enterprise Reference Architecture
The Purdue Model divides the architecture of a notional industrial control sys-tem into two zones: the enterprise zone and operations management zone encom-pass functions on the IT (enterprise) network and ICS network, respectively, and are typically separated by a demilitarized zone (DMZ), which is a routing firewall used to protect the systems on the ICS network from external threats. Within the
1Other industrial standards which mention the Purdue Model include ANSI/ISA-95, a series
of international standards from the International Society of Automation (ISA) for developing an automated interface between enterprise and control system, and IEC 62264 and IEC 62443, a series of international standards from the International Electrotechnical Commission (IEC) on enterprise-control system integration and the mitigation of security vulnerabilities in industrial automation and control systems.
operations management zone there may be multiple cell or area zones which rep-resent subsystems managed by a single area supervisory control system.
The Purdue Model defines levels based on the hierarchy of information and data flow. Data regarding operations flows up from level 0 to level 5; upper levels use the data from lower levels to make decisions about operations, which flow down from level 5 to level 0.
• Level 5 (Enterprise Network) includes corporate IT infrastructure systems and applications, web servers for internet access, email servers for external email, and VPN remote access; this level is directly exposed to the public internet and therefore most vulnerable to external cyber attacks.
• Level 4 (Business Planning and Logistics) includes IT systems dealing with reporting, scheduling, inventory management, capacity planning, operational and maintenance management. This level is often considered an extension of level 5 and security for both levels is typically managed by an IT organi-zation.
• Level 3 (Site Operations) includes systems responsible for managing plant operations, such as the plant historian, production scheduling and reporting systems, and engineering workstations. Systems on level 3 typically commu-nicate with the enterprise zone through a DMZ and may also commucommu-nicate with levels 1 and 2. Level 3 may also include remote access services which allow operators to access systems on levels 1 and 2, which would be an addi-tional vulnerability to external attacks.
• Level 2 (Area Supervisory Control) includes the supervisory control systems that allow an operator to control an individual production area and support real time monitoring, such as human machine interfaces, alarms and alert systems, and control room workstations.
• Level 1 (Basic Control) includes devices responsible for sensing and process control equipment such as distributed control systems (DCS), programmable
logic controllers (PLC), and remote terminal units (RTU) that receive input from sensors and respond based on control algorithms that are programmed and configured from engineering workstations on level 2 or 3.
• Level 0 (Physical Process) includes the physical process itself and the sensors and actuators that directly control and measure the physical process.
The Purdue Model is designed so that connectivity and security requirements are similar within a level, but connections between levels require additional lay-ers of security. Levels in the enterprise security zone are easier for attacklay-ers to access since they are connected to the internet, but attackers entering the enter-prise security zone must breach multiple layers of security before they can impact the industrial process. Levels in the industrial security zone are typically more difficult for attackers to access but grant attackers the ability to manipulate the industrial process directly.
2.1.1
Vulnerabilities in the ICS Architecture
Historical ICS cyber attacks demonstrate that, due to the interconnected nature of the ICS architecture, vulnerabilities at any level may give attackers a foothold from which they can launch their attacks. As more and more ICS networks are connected to enterprise networks, the trend in recent ICS cyber attacks has been to use malware designed for IT systems, which is more widely available than ICS-specific malware, to gain access and perform reconnaissance on the enterprise net-work before moving to the ICS netnet-work to deliver a tailored attack on the physical system [5]. For example, the threat group which perpetrated the attack on Saudi Aramco’s safety systems is believed to have first gained access to the enterprise network through spear-fishing or other common IT cyber attack methods before using extensive credential harvesting to gain sufficient privileges to pivot onto the ICS network and execute specialized malicious code targeting the Triconex safety instrumented system (SIS) used in Saudi Aramco’s industrial processes [5].
Attackers have also infiltrated the industrial security zone directly, for exam-ple through improperly secured wireless access points, infected removable media, or vulnerabilities in remotely accessed control stations. The Stuxnet virus is be-lieved to have been transferred onto ICS networks by infected USB drives, and the threat group which executed the 2015 attack on the Ukrainian power grid was able to directly control breakers in the power distribution network after gaining access to a built-in remote access capability [7]. In many cases, the designers of in-dustrial control systems have added remote access capability to facilitate routine maintenance or gather real time data to improve system operations, which also unintentionally increases vulnerability to cyber attacks. These examples show the potential vulnerability of ICS processes at every level of the ICS architecture.
2.2
Anomaly Detection in Industrial Processes
Regardless of the way an attacker gains access to the ICS network, the ultimate goal of an ICS cyber attack is to disrupt the physical process (level 0). One of the lessons learned from historical cyber attacks is that, given enough time, determined and well-resourced threat actors can likely gain access to almost any system. As re-searchers from Idaho National Laboratory concluded, " [t]he ability to detect and recover from a cyber-attack is the important takeaway, as protecting all systems from any attacker is not possible" [7]. Therefore, the assumption in this thesis is that the attacker has already gained access to the ICS network and is able to dis-rupt the industrial system. The focus of this thesis is to explore methods which detect attacks by monitoring the actual physical process with the goal being to de-tect anomalous behavior as soon as possible, before the attack causes irreversible damage to the system.
Detection of unauthorized attempts to access the ICS network and suspicious behavior on the network itself are also critical components of ICS cyber secu-rity but are outside the scope of this thesis. Numerous commercial tools exist to address these threat areas, for example, indicator of compromise (IOC) tools,
which seek to detect known malicious data defined by a rule set, or network traffic anomaly detection (NTAD) tools, which seek to identify novel threats by detect-ing network traffic that deviates from normal behavior. In fact, a survey of ICS security tools conducted by Idaho National Laboratory (INL) found that IOC and NTAD tools were the most common type of commercially available ICS security tool [20]. The INL survey focused on tools which monitored the cell/area zone (level 0, 1, 2) in the Purdue Model, reasoning that IT-specific tools could be used to detect threats on the higher levels which have greater interaction with the enter-prise network and IT devices. This thesis also focuses on data from the cell/area zone but deals with physical process data instead of network data. Since it is un-realistic to assume that IOC and NTAD tools will be able to detect all malicious network behavior, active monitoring and detection of anomalous behavior in the physical process itself is an important part of any defense-in-depth ICS cyber de-fense strategy.
2.3
Literature Review: Machine Learning for SPC and
ICS Cyber
Given our focus on detecting cyber attacks through anomalies in the physical pro-cess, our problem can be viewed as an extension of statistical process control (SPC), a well-established field which studies statistical methods used to monitor the sta-bility of processes and identify faults. In essence, a cyber attack can be considered a specialized type of fault and detected using existing SPC methods. Due to the widespread acceptance of SPC methods in the ICS community, they provide a use-ful starting point for developing methods which are more tailored to the ICS cyber problem setting.
In this thesis, we combine the traditional process control methods with ma-chine learning in order to develop methods which are more tailored to ICS cyber. The general framework of traditional SPC methods is to develop a test statistic
that is compared against a threshold in order to make a determination on whether the process is "in control" (normal) or "out of control" (abnormal). SPC methods typically assume that statistical characteristics of the "in-control" process remain stable unless a fault occurs [21]. Additional detail on SPC methods is provided in Section 4.1.
In recent decades, there has been a significant increase in the use of machine learning (ML) in combination with SPC methods to deal with the large amounts of data generated by modern industrial systems. Russell, et al. provide a use-ful introduction to data-driven process control methods, including principal com-ponent analysis (PCA), Fisher discriminant analysis (FDA), partial least squares (PLS), and canonical variate analysis (CVA) [17]. Ge, et al. provide a comprehen-sive survey of ML techniques used in the process industry and find that PCA is the most commonly used unsupervised method, while artificial neural networks (ANN) and PLS are the most commonly used supervised methods [22]. Additional survey papers on the use of ML in process control include [23, 24, 25].
In addition to the more commonly used ML methods mentioned above, we also highlight stationary subspace analysis (SSA), a projection algorithm proposed by Bünau, et al. which is designed to separate a multivariate time series into station-ary and non-stationstation-ary components [18, 26], and maximized ratio divergence anal-ysis (MRDA), a dimensionality reduction technique proposed by Lu, et al. which seeks to maximize the Kullback–Leibler divergence of two data classes [19]. As SSA and MDRA aim to increase the stationarity and separability of data, respec-tively, we hypothesize that applying these methods will increase the sensitivity of SPC fault detection methods. We define stationarity and separability and describe both SSA and MDRA in more detail in Chapter 5.
While many of these ML-based SPC techniques are applicable to ICS cyber, they were designed to support system reliability and quality control by detecting ran-dom, independent faults. As a result, these methods are not best-suited for detect-ing ICS cyber attacks, which are comprised of intentional faults caused by a mali-cious actor who may be seeking to obfuscate his actions. For example, traditional
SPC methods would not be able to detect cyber attacks which replay previously recorded sensor signals to mask the true sensor value. In addition, data-driven SPC methods assume that historical data is available which accurately represents the faults which must be detected. In the case of ICS cyber, historical data of past attacks may not be available and, if available, may not accurately represent new attacks. New methods are needed which use multi-sensor data and machine learning to improve sensitivity to the adaptive behavior of attackers and to quickly detect previously unknown and unlabeled attack instances. Additional discussion about the unique characteristics of ICS cyber anomaly detection is found in the following section.
Various approaches have been proposed to specifically address the challenges of using machine learning to detect cyber attacks on industrial data. We find that these methods can be categorized as using either 1) a direct approach (applying either supervised or unsupervised machine learning methods directly to historical process data to perform binary classification or anomaly detection) or 2) a model-based approach (using historical process data to learn a model of the underlying physical process and then using the model as part of the anomaly detection pro-cess) [27].
Works which present direct approaches include [28], which evaluates the ad-vantages and disadad-vantages of one class support vector machines (OCSVM), sup-port vector machines (SVM), rule-based approaches, neural networks, and hidden markov models when applied to detecting cyber attacks on a SCADA system. An overview of anomaly detection on industrial wireless sensor networks was given in [29], which compares multiple ML methods, including K-nearest neighbor (KNN), SVM, ANNs and hybrid schemes. Authors in [30] and [31] propose OCSVM mod-els for cyber attack detection, due to the fact that the OCSVM (an extension of the SVM algorithm to unlabeled data) is an unsupervised method that does not need any labeled training data or other prior information about the type of anomaly generated by an attack. Kiss, et al. propose a clustering method which uses a
Gaus-sian mixture model to cluster sensor measurements in order to efficiently identify abnormal ICS measurements which may be attributed to cyber attack [32].
Works which present model-based approaches include [33], in which physical process models were used together with techniques from feedback control theory to predict future states and detect anomalies. The authors in [34] proposed train-ing a linear model to represent a chemical plant and then ustrain-ing the trained model to perform anomaly detection for cyber attacks. Instead of a linear model, Oak Ridge National Laboratory used a neural network to learn the underlying physi-cal relationships in a smart grid network and then used the inferred relationships to detect sensor measurements which may be within expected values but are im-plausible when viewed in the context of other sensor measurements [35, 36]. Re-searchers at Kaspersky proposed a similar method using a long short-term mem-ory (LSTM) recurrent neural network (RNN) to forecast the next observation in multivariate time series data and detecting anomalies based on deviation from the forecast [1].
In this thesis, we implement existing methods from both the direct approach (SSA, MDRA) and model-based approach (using residuals from a LASSO model) in order to detect cyber attacks in the Tennessee Eastman Process, a simulated chemical process (see Chapter 3 for additional details). To our knowledge, SSA, MDRA, and LASSO model-based anomaly detection have not been evaluated on ICS cyber data, which has unique characteristics which make detection more chal-lenging than the traditional SPC fault detection setting. In addition, since cyber attacks may manifest themselves in a variety of ways and it is unlikely that a single method would be maximally sensitive to all variations of cyber attacks, we propose a novel ensemble method which seeks to optimally combine the results of multiple methods with the goal of minimizing detection delay across a range of attack types. Other unique aspects of this thesis include: 1) integrating methods from machine learning and optimization into an SPC framework which is already widely used in industrial settings to increase the ease of acceptance in the ICS community; and
2) withholding attack data during training based on the assumption that there are no available attack data sets.
2.4
Characteristics of ICS Cyber Anomaly Detection
Based on the survey of existing work on SPC fault detection and ICS cyber attack detection in previous section, we highlight similarities and differences between ICS cyber attack detection and general fault detection which help give context to the ICS cyber problem setting. Some key similarities ICS cyber attack detection and general fault detection include:
• Large data sets. Control systems typically log a large number of signals at a
high update frequency, generating an extensive operating history which can be used for estimating pre-change processes.
• A concept of normal operations. Industrial settings are more controlled than
IT environments and there is notionally a concept of normal or stable opera-tions.
• Noisy data. Historical data may be noisy due to measurement errors or
miss-ing data and because behavior which may be considered "normal" (i.e., main-tenance, usage spikes) may generate signals which fall outside the bounds of typical operations.
• Correlation between signals. Systems are governed by physical laws and/or
control logic which can be modeled.
• High autocorrelation. Due to the high update frequency and the inertia of
physical and chemical processes, signals typically exhibit high autocorrela-tion and non-staautocorrela-tionarities.
• Real time detection. Decisions must be made in real time or near real time;
models may be trained on historical data but when evaluated on change de-tection, must observe data sequentially and make a decision in real time.
• High cost for false alarms. ICS operators have a strong aversion to false alarms
in attack detection, since attacks are rare and the cost for false alarms is high and known (downtime to investigate a possible attack), while the cost for delayed detection is unknown (ranging from zero to catastrophic). High false alarm rates prevent the acceptance of many anomaly detection algorithms in operational settings.
In addition to these shared characteristics, due to the intentional and malicious nature of cyber attacks, faults caused by cyber attack differ from the characteristics described above in two key ways -obfuscation and novelty.
First, unlike traditional fault detection which seeks to identify part failures or other unintentional faults, cyber attacks are caused by malicious actors who may seek to obfuscate their actions by making them appear normal. Although cyber attacks may disrupt the system in an immediately obvious and destructive way, they may also be designed to obfuscate their impact on the system. For example, an attacker may wish to remain undetected in order to maintain long-term access to the system, either to gather intelligence and perform reconnaissance, stage for future attack, or degrade the performance of the system indefinitely. In those cases, the attacker may design his attacks so that the disruption is within "normal" bounds and therefore not detectable by traditional SPC methods.
The second key difference between traditional SPC and cyber attack detection is the lack of historical attack data. Given the highly controlled nature of ICS envi-ronments, traditional SPC methods were designed to detect a known set of faults, which may be defined by expert knowledge or learned using data-driven methods. However, due to the low number of reported ICS cyber attacks and the sensitivity of any attack-related data, there are no known publicly available data sets which represent real world ICS cyber attacks. Even if such data sets existed, there is no guarantee that future attacks would follow the same pattern as past attacks, since there are many different ways to disrupt an industrial control system and cyber attackers are continuously seeking new vulnerabilities to exploit. The lack of his-torical attack data presents significant challenges in developing anomaly detection
methods which must be trained on proxy data that does not always represent the characteristics of attack data.
This thesis seeks to develop anomaly detection methods which will address these two challenges. Specifically, we seek to address the challenge of obfuscation by developing methods which can increase the sensitivity of the fault detection without increasing the false alarm rate. We also seek to address the lack of his-torical attack data by developing methods which avoid overfitting to training data and are able to detect previously unseen anomalies. These two objectives are in tension with each other, as methods which are more sensitive are also typically more closely fitted to the training data and methods which are robust to unseen data typically have a higher false alarm rate, but we use machine learning methods which learn the correlation between features as well as patterns within each time series to improve sensitivity and detection performance on unseen data.
Chapter 3
Dataset
Ideally, the methods described in this thesis would be evaluated on historical data of known ICS cyber attacks. However, due to the sensitivity and proprietary na-ture of any such data, there are no detailed, publicly available ICS cyber attack datasets. In the absence of historical data, the dataset used in this thesis is based on the Tennessee Eastman Process (TEP), a simulated chemical process widely used as a benchmark dataset in industrial fault detection research [37]. Kaspersky has extended the TEP dataset by adding simulated cyber attacks on top of “normal” operating modes. The Kaspersky TEP dataset’s large size, complex and varied anomalous behavior examples, and exact labels for normal and anomalous behav-iors make it well-suited to the research tasks in this thesis.
3.1
Tennessee Eastman Process (TEP)
The Tennessee Eastman Process (TEP) is a well-known simulation of a chemical processing plant. Downs and Vogel formally introduced the simulation in the 1990s in order to provide a realistic industrial process for evaluating process con-trol methods [37]. Originally based on an actual chemical process from the East-man Chemical Company, the TEP has been updated and extended multiple times and is still widely used in process monitoring and fault detection studies, includ-ing those focused on evaluatinclud-ing systems under cyber attack [1, 32, 38, 39, 40].
Figure 3-1 provides a schema of the TEP; we provide a high-level description of the process in the following paragraph, but a detailed description of the TEP can be found in [37, 17, 41]. The process simulated in the TEP transforms a mix of gaseous reactants (A, C, D, E) into two liquid products (G, H). In Figure 3-1, the in-flow of reactants A, D, and E can be seen in the upper left and all three reactants are fed directly into the reactor, where the reactor temperature and pressure con-trol the efficiency of the reaction. The output of the reactor is sent to the condenser (directly above the reactor in Figure 3-1), where it is cooled to liquid form and fed into the liquid-vapor separator (depicted in the upper right of Figure 3-1), which separates unreacted gases from the liquid products and recycles vapor containing the unreacted gases back to the reactor through a compressor (shown at the top of Figure 3-1, just to the left of the separator). The cycle of moving gaseous reactants through the reactor, condenser, separator, and compressor continues indefinitely with additional inputs of reactants A, D, and E, although a portion of the recy-cle stream is purged to prevent inert reactants and byproducts from accumulating (shown in the upper right of Figure 3-1). The liquid output of the separator is fed to the stripper (shown in the center of Figure 3-1), which 1) removes any re-maining reactant and sends it back to the recycle stream and 2) mixes in reactant C, ultimately producing the final products G and H. None of these processes are 100% efficient, so measurements are made of the chemical composition of the reac-tor (recycle) feed, purge feed, and product feed to assess the purity of the product feed and the amount of waste in the purge feed.
The TEP is a complex, nonlinear process which can be controlled and perturbed in many ways. In addition to the underlying chemical processes, there are closed-loop control strategies in place to maintain process variables at set points (12 ma-nipulated variables are set by the operator), minimize variability in the product rate and product mix, minimize the operating cost (which depends on the chemi-cal composition of the purge stream and the compressor work and stripper steam rates), and keep process operating conditions within equipment constraints. In particular, five process variables (reactor pressure, reactor level, reactor
tempera-Figure 3-1: Schema of the Tennessee Eastman Process [1]
ture, product separator level, and stripper base level) have operating constraints which cannot be exceeded for safety reasons [37]. Disruption to these key com-ponents can cause the process to shut down. More generally, perturbations of the process variables can decrease product quality or increase product cost, or lead to cascading effects which may impact other process variables and ultimately lead to plant shutdown [42]. These dynamics make the TEP well-suited as a test-bed for cyber attack detection.
3.2
Kaspersky Tennessee Eastman Process (KTEP)
The version of the TEP used in this thesis was created by Kaspersky and adds simulated cyber attacks on top of the baseline TEP chemical process [1]. Kaspersky released the dataset in 2017 in order to address the lack of labeled ICS cyber attack datasets that could be used for evaluating proposed attack detection approaches.
Their stated goal was to simulate multiple realistic cyber attacks on a complex cyber-physical system.
We use a subset of the KTEP dataset, 𝑋, which is an 𝑛 x 𝑚 matrix, where 𝑛 is the number of observations (48000 × 𝑠), 𝑚 is the number of features (51), and 𝑠 is the number of samples (491). In our subset of the KTEP, each sample represents 48 hours of the TEP, with 1000 observations per hour for a total of 48,000 obser-vations. We use 𝑋(𝑡) ∈ 𝑅1 x 𝑚 to represent a single observation of all 𝑚 features at time step 𝑡. The 51 features represent both measured and manipulated variables which monitor the process state, including temperature, level, pressure, flow, and chemical composition measurements as well as the product rate and product cost. We use 𝑥𝑖 ∈ 𝑅𝑛 x 1 to indicate the vector of observations for a single feature 𝑖 in univariate analyses.
See Appendix A for additional information about the full KTEP dataset and a detailed breakout of a sample types and features.
3.2.1
Operating Modes
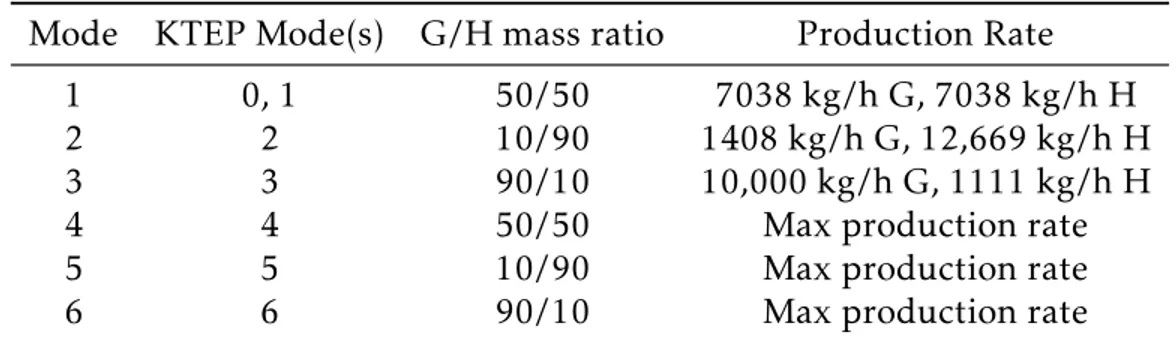
Each sample in the KTEP dataset can be categorized as one of seven operating modes and three sample types. Although Kaspersky does not disclose the set points for its operating modes, we assess that Kaspersky generally follows the orig-inal TEP modes defined by Downs and Vogel. The operating modes set by Downs and Vogel (see Table 3.1) represent different product mix ratios (the proportion of chemical G and chemical H in the final product) and production rates. In a real world scenario, the product mix and production rate which would be set by the operator based on market demand.
In Downs and Vogel’s original model, modes 4, 5, and 6 were designed to op-erate at the maximum production rate, whereas modes 1, 2, and 3 were set for less aggressive production rates. In order to operate at the maximum production rate, some process variables are pushed close to shut-down limits (for example, the TEP chemical reaction is most efficient at higher temperatures and pressure levels, so the reactor temperature and pressure levels are pushed to the highest
Table 3.1: Downs and Vogel operating modes with corresponding KTEP modes Mode KTEP Mode(s) G/H mass ratio Production Rate
1 0, 1 50/50 7038 kg/h G, 7038 kg/h H
2 2 10/90 1408 kg/h G, 12,669 kg/h H
3 3 90/10 10,000 kg/h G, 1111 kg/h H
4 4 50/50 Max production rate
5 5 10/90 Max production rate
6 6 90/10 Max production rate
possible values). As a result, modes 4, 5, and 6 exhibit behaviors in which some process variables are pushed to near shut-down limits before control measures are enforced to bring the process back within acceptable limits. This behavior can be observed in the KTEP dataset (compare plots for modes 0, 1, 2, 3 with plots for modes 4, 5, 6 in Figure 3-2) and makes the higher modes more difficult to model.
Figure 3-2: Plots of the stripper level (feature 16) illustrate how operating modes 4, 5, and 6 (bottom row) are less stationary than modes 0, 1, 2, 3 (top row)
3.2.2
Sample Types
• Single state - the process stays at the base operating mode and does not change
for the duration of the sample. We use single state samples to represent normal operations.
• Transient - the process starts at the base operating mode; at a known time the
set point of a single variable abruptly changes to a new value and remains at that value for the duration of the sample. Although the change in a transient sample represents legitimate (non-attack) change implemented by the oper-ator, we use transient samples as proxy for attack samples in our training sets.
• Attack - the process starts at the base operating mode; during a period with
known start and stop times, an attack is executed on a variable or set of variables. Attack samples have been simulated by Kaspersky to represent a variety of attack types, but we assume that attack samples are not available to be used in training sets.
Both transient and attack samples have a change point, which in our dataset always occurs at 𝑡 = 24,000. In order to distinguish between pre-change (normal) and post-change (abnormal) data, we use 𝑋𝑝 ∈ 𝑅𝑛𝑝x 𝑚, where the subscript 𝑝 is 0 if
the data is pre-change and 1 if the data is post-change and 𝑛𝑝 is the number of
observations in class 𝑝, typically 24000𝑠.
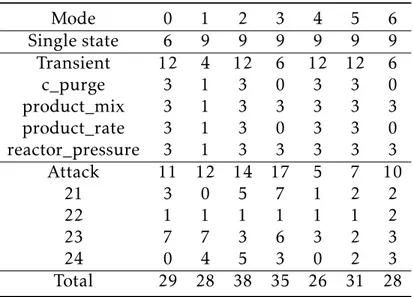
Transient processes are meant to represent legitimate (non-attack) changes to the base process which may be implemented by an operator. There are four types of transient changes (C purge, product mix, product rate, and reactor pressure), each of which changes the set point of the process variable affected by 2-10%.
Plots in Figure 3-3 show how a single variable (percentage of reactant C in the reactor feed, feature 26) sample responds to each of the four types of transient changes when the change occurs in mode 2 and mode 5 samples; in every case, the change occurs at the midpoint of the sample, which is indicated with a dashed red line. From these examples, it is clear that each transient type has a different signature that depends both on the transient type and on the mode. For mode 5,
the product mix, product rate, and reactor pressure transient types result in a clear change point, but the change point from the C purge transient type is not obvious from visual inspection. For mode 2, these signatures can be different: for example, the product_mix transient type no longer results in an obvious mean shift at the change point.
Figure 3-3: Plots of the reactor feed (feature 26) illustrate how the four transient types (shown in blue) deviate from a single state sample (shown in orange); the
transient samples types from L to R are C purge, product mix, product rate, reactor pressure
Kaspersky’s attack samples represent three different kinds of cyber attacks: in-tegrity attacks change the value of a process variable to an arbitrary value differ-ent from the value generated by the TEP; denial of service (DoS) attacks freeze the value of a process variable; and noise attacks add Gaussian noise to the value of a process variable. These attack scenarios represent attacks in which the at-tacker may remain undetected at first but may still cause irreversible damage to the physical system. In the KTEP dataset, these cyber attacks are implemented in four different attack types:
• Type 21 – the reactor temperature measurement is changed to an arbitrary
value (integrity);
• Type 22 – three variables related to the stripper are frozen for the duration of
• Type 23 – the D feed flow variable is frozen for the duration of the attack
(DoS); and
• Type 24 - noise is added to the true values of C feed flow, purge flow, stripper
underflow and stripper steam flow (noise).
Plots in Figure 3-4 show how the same variable depicted for transient samples (percentage of reactant C in the reactor feed, feature 26) responds to each of the four types of attacks when the attack occurs in mode 2 and mode 5 samples; in every case, the attack occurs at the midpoint of the sample, which is indicated with a dashed red line. Based only a visual inspection, it appears that the change point is more difficult to identify in in attack samples than in transient samples. It also appears that each attack type may result in a different signature that depends both on the attack type and on the mode.
Figure 3-4: Plots of the reactor feed (feature 26) illustrate how the four attack types (shown in blue) deviate from a single state sample (shown in orange); the
attack types from L to R are type 21, 22, 23, 24
Within these combinations of modes, transient types, and attack types, the KTEP data provides a good example of an ICS system with a wide range of anoma-lies ‘hidden’ within a complex physical system. Additional information about the modes and sample types, as well as the eight transient and attack types, can be found in Appendix A.
3.3
Data Preparation
The full KTEP dataset has 646 samples, each of which is 120,000 observations in length. As previously mentioned, in order to simplify the calculation of false alarm rate and detection delay and to reduce computation time, we create a set of truncated samples in which each sample is 48,000 observations.
In order to create this set of truncated samples, we exclude the first 20,000 ob-servations to account for a “burn in” period at the start of each time series before the process stabilizes. This modification takes into account the fact that most in-dustrial systems are designed to operate at a steady state without frequent starts and stops and assumes that attack detection algorithms will primarily be used on processes that are in a steady state.
After removing the first 20,000 observations, each sample is length 100,000. We select a window of 48,000 observations around each change point (24,000 observations prior to the change point and 24,000 observations after the change point). If a sample’s change point falls before 𝑡 = 24,000 or after 𝑡 = 76,000, that sample is excluded. This criteria excludes approximately 35% of attack and tran-sient samples (191 samples).
We justify the use of only 24,000 observationsafter the change point by arguing
that if the algorithm is unable to detect an attack within 24,000 observations (24 hours), it is not useful in an ICS setting. We justify the use of only 24,000 obser-vations prior to the change point by arguing that, given the operating mode, all
pre-change data is statistically equivalent. Under the assumption that the data is multivariate normal, we use Hotelling’s T-squared test to confirm the hypothesis that the subset (24,000 change observations) and superset (all available pre-change observations) can be considered drawn from the same normal distribution. Since the KTEP simulation is designed to keep the process at a stable state, it is a reasonable assumption that the data would be statistically equivalent prior to the change point.
In addition to the preprocessing steps described above used to create the set of truncated KTEP samples, we further create five training and test sets that will be used to train, test, and perform cross-validation on the methods described in Chapters 4, 5, and 6.
In particular, we highlight that no attack data is included in any of the training sets. Recall that a key characteristic of the ICS cyber problem setting is the nov-elty of attacks and the lack of relevant historical attack data. In order to develop methods which can perform well in the absence of historical attack data, training sets only include single state and transient samples. For models which require la-beled data, transient data is used as a proxy attack data. We use approximately 60% of the single state and transient samples in the training set. Test sets include the remaining single state and transient samples and all attack samples. A more detailed breakout of the train and test sets created is provided in Appendix B.
After generating the train and test sets, we apply a standard scaler to each fea-ture to ensure feafea-tures with large measurement ranges do not dominate the fault detection procedure. Using a standard scaler is a necessary preprocessing step in many machine learning and dimensionality reduction techniques [17]. Specifi-cally, we subtract each value by the pre-change (normal) mean and divide by the pre-change standard deviation; the pre-change mean and standard deviation are calculated on the training set and applied to the test set. The standard scaler re-sults in data which have zero mean and unit variance, if the data follow the same distribution as the pre-change training data.
Throughout this thesis, when we refer to raw data, we are referring to data which has been preprocessed using the standard scaler but otherwise unaltered.
3.4
Notation
Given the datasets described in this section, we summarize the following notation used to describe the datasets for each mode; additional notation will be introduced as needed.
• 𝑋 ∈ 𝑅𝑛 x 𝑚: process observations, preprocessed but otherwise unaltered. – 𝑛 is the number of total observations in the dataset, which is equal to
48000 · 𝑠
– 𝑚 is the number of features (51)
– 𝑠 is the number of samples in the dataset (varies by mode)
• 𝑋𝑝∈𝑅𝑛𝑝x 𝑚 : the subscript 𝑝 is used to indicate the class of the data (normal
if the data is taken from before the change point or abnormal if the data is taken from after the change point).
– 𝑝 is 0 if the data is pre-change and 1 if the data is post-change
– 𝑛𝑝 is the number of observations in class 𝑝, typically 24000 · 𝑠
• 𝑋(𝑡) ∈ 𝑅1 x 𝑚: a single observation of all 𝑚 features at time step 𝑡.
• 𝑥𝑖 ∈𝑅𝑛 x 1: the superscript 𝑖 over a lowercase 𝑥 is used to indicate the vector of observations for a single feature 𝑖 in univariate analyses.
• 𝑋𝑡𝑟𝑎𝑖𝑛, 𝑋𝑡𝑒𝑠𝑡∈𝑅𝑛 x 𝑚: if necessary, the superscript is used to indicate whether the data is from the training or test set.
We also use the following phrases interchangeably: normal, pre-change, and in-control to describe the portion of the sample which occurs before the change point; and abnormal, anomalous, post-change, and out-of-control to describe the portion of the sample which occurs after the change point.
Chapter 4
Methodology
This section introduces concepts of statistical process control, describes the train-ing and test data, and defines performance metrics which will be used to evaluate all proposed approaches. The multivariate Shewhart control chart is implemented and baseline performance metrics are described in order to motivate the need for additional methods to improve detection performance.
4.1
Statistical Process Control
Statistical process control traces its origins to early 20th century efforts to monitor the quality of manufacturing processes [21]. The general framework of traditional SPC methods is to develop a test statistic that is compared against a threshold in order to make a determination on whether the process is "in control" (normal) or "out of control" (abnormal). SPC methods typically assume that statistical charac-teristics of the "in-control" process remain stable unless a fault occurs [21].
4.1.1
Shewhart Control Chart
In order to give further intuition on statistical process control, we introduce the univariate Shewhart control chart, a simple but widely-used SPC technique which
remains standard in many industrial control settings and provides the base for more sophisticated control charts [17].
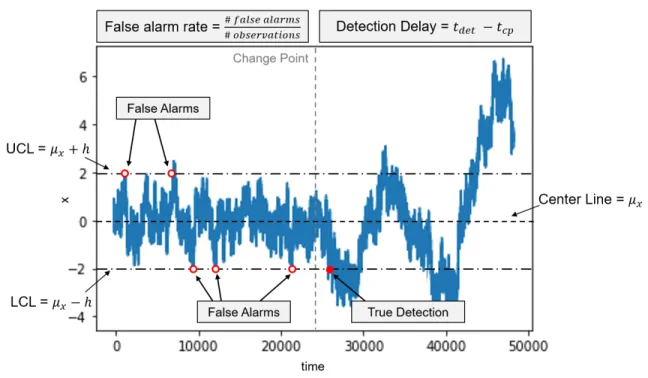
The Shewhart control chart attempts to distinguish between two types of vari-ation, "common" or normal variation (random noise inherent to normal, in-control operations) and "special" or abnormal variation (all other variations). It assumes that the normal variation can be characterized as random variations around a con-stant average value,
𝑥(𝑡) = 𝜇 + 𝑒(𝑡)
where 𝑥(𝑡) is the measurement at time 𝑡, 𝜇 is its true mean, and 𝑒(𝑡) is the ran-dom error at time 𝑡. Like all traditional statistical process control methods, the Shewhart control chart, assumes:
1. the true value of 𝜇 is constant, and
2. the error values 𝑒(𝑡) are independent and normally distributed with zero mean, 𝑁 (0, 𝜎2)).
In a time series context, these two assumptions also imply stationarity. Given these assumptions, the Shewhart control chart is designed to alarm when an observation deviates from 𝜇 (typically approximated by the historical, in-control mean) by more than a certain threshold (typically determined by the historical, in-control standard deviation). If 𝜇𝑥 is the historical in-control mean of 𝑥 and 𝜎𝑥 is the
his-torical in-control standard deviation, then the center line, the upper control limit (UCL), and the lower control limit (LCL) for the Shewhart control chart are
UCL = 𝜇𝑥+ 𝑘𝜎𝑥
Center Line = 𝜇𝑥
where 𝑘 parameterizes the chart’s sensitivity. Determining the optimal thresh-old is critical to the chart’s performance; there is an inherent trade-off between minimizing false alarms and missed detections; smaller threshold values result in fewer missed detections, but a high false alarm rate, whereas larger threshold values result in fewer false alarms but many missed detections.
4.1.2
Multivariate Shewhart Control Chart
Although univariate control charts for a small subset of individual features re-main common in practice, in the process control setting, data are almost always multivariate. In the case of ICS cyber attack detection, monitoring only a subset of individual features is unacceptable, as the feature which will exhibit the anomaly is unknown. In complex ICS environments with dozens or even hundreds of fea-tures, it is infeasible to monitor all univariate signals due to the increase in oper-ator load and increase in the combined false alarm rate (the likelihood that one of many control charts will alarm). Even if it were practical to monitor each fea-ture individually, univariate control charts cannot capfea-ture the correlation between variables which may provide additional information about possible anomalies.
Multivariate control chart methods are ways to transform multivariate data into a single test statistic that can then be used in a way similar to univariate con-trol charts. In this thesis, a discriminant function is used which quantifies the relationship between the observation vector and a class (normal, abnormal). The discriminant function is commonly used in SPC and ML methods and is a para-metric approach where underlying distributions are assumed known [17].
Let class 0 be the normal condition and class 1 be the abnormal condition. We seek to define a discriminant function, 𝑔𝑖(𝑋), that assigns an observation 𝑋(𝑡) to
class 0 if 𝑔0(𝑋(𝑡)) > 𝑔1(𝑋(𝑡)) and to class 1 otherwise. Recall that 𝑋(𝑡) ∈ 𝑅1 x 𝑚
is a single observation of all 𝑚 features at time step 𝑡. To simplify notation in the following formulas, we will refer to the vector 𝑋(𝑡) as 𝑥. If 𝜔1 is the event that
class 1 occurs (i.e. a change occurs), the optimal discriminant function is given by Bayes Rule:
![Figure 3-1: Schema of the Tennessee Eastman Process [1]](https://thumb-eu.123doks.com/thumbv2/123doknet/14014890.456824/39.918.146.777.122.572/figure-schema-tennessee-eastman-process.webp)