HAL Id: hal-02758121
https://hal.inrae.fr/hal-02758121
Submitted on 4 Jun 2020HAL is a multi-disciplinary open access archive for the deposit and dissemination of sci-entific research documents, whether they are pub-lished or not. The documents may come from teaching and research institutions in France or abroad, or from public or private research centers.
L’archive ouverte pluridisciplinaire HAL, est destinée au dépôt et à la diffusion de documents scientifiques de niveau recherche, publiés ou non, émanant des établissements d’enseignement et de recherche français ou étrangers, des laboratoires publics ou privés.
Performances of two crop models in various conditions
Hatem Belhouchette, M. Adam, E. Casellas, Florian Celette, Marc Corbeels,
Jacques Wery
To cite this version:
Hatem Belhouchette, M. Adam, E. Casellas, Florian Celette, Marc Corbeels, et al.. Performances of two crop models in various conditions. Integrated Assessment of Agriculture and Sustainable Development (AgSAP), Mar 2009, Egmond aan Zee, Netherlands. 2009, Modélisation bio-économique, évaluation de l’impact des politiques économiques et environnementales. �hal-02758121�
AgSAP Conference 2009, Egmond aan Zee, The Netherlands
196
Performances of two crop models in various conditions:
The importance of underlying assumptions
H. Belhouchette, M. Adam, E. Casellas, F. Celette, M. Corbeels, J. Wery UMR-SYTEM, 2, Place Pierre Viala,
34060 Montpellier Cedex 1, France Contact: [email protected]
Introduction
APES, a modular model was developed in the SEAMLESS project (Van Ittersum et al., 2008) to assess, in different EU regions, the impact of farm management on crop production and environmental externalities. Such purpose assumes the capability of APES to simulate cropping systems in a wide range of climate, soil and crop management. The main topic of this study is to evaluate APES, under different stresses and management practices (temperature, water and nitrogen), to simulate crop production and nitrogen and water dynamics. For this evaluation, APES was compared to the CropSyst (Stöckle et al., 2003) model (widely evaluated and used under different biophysical conditions and management practices). An explicit description of the limitations and specificities of each modelling approach is related to the behaviour of each model in different situations.
Methods
Both models were calibrated independently, using the same experimental data sets collected for rainfed durum wheat in the Midi-Pyrenees region (Mahmood, 2008; Adam et al., 2009). Soil is mainly clay-loamy and weather data were collected on site, including rainfall, temperature and radiation. The performance of each model has been tested, under different scenarios, to define how they reacted to different gradients of temperature (scenario 1: Taverage
to Taverage + 4°C + no water stress+ no N stresses), irrigation regime (scenario 2: Taverage + no
N stress + irrigation doses from 0 to 700 mm) and nitrogen fertilization (scenario 3: Taverage +
no water stress + N fertilization from 0 to 200 kg N ha–1). The behavior of the two models under different scenarios was defined analysing model outputs such as leaf area index, above ground biomass and grain yield, water uptake and nitrogen uptake and leaching enabled.
Results and discussion
Temperature impact on leaf area development and biomass accumulation
The dynamics of the total leaf area development and biomass accumulation generated by the two models are different (data not shown). When the average temperature increases, the LAI decreases in CropSyst, while in APES it remains constant (data not shown). The approaches used in each model explain these differences. LAI development in CropSyst at potential production is directly dependent on biomass production, following a logistic curve with a LAImax. In APES, LAI development is simulated following two phases, the first one being the juvenile phase with an exponential growth, followed by a linear growth directly dependent on biomass production. Another important (indirect) effect occurs through simulated biomass production: in CropSyst there is a temperature effect on the radiation use efficiency during early growth, while in APES the RUE is considered constant through the crop cycle. This means that in CropSyst simulated biomass at the beginning of the cycle decreases with increased average temperature, while in APES, it remains constant. Concerning leaf senescence, the decrease of the LAI in APES is the same as in CropSyst, even though different approaches are used. In APES, senescence responds to shading, temperature and ageing (leaf duration), while in CropSyst only the ageing factor is directly considered by simulating the leaf area duration.
Session B3: Cropping systems modelling 197 0 8 16 0 200 400 600 irrigation (mm) B io m a ss ( t/ h a ) CropSyst APES Water-limited conditions
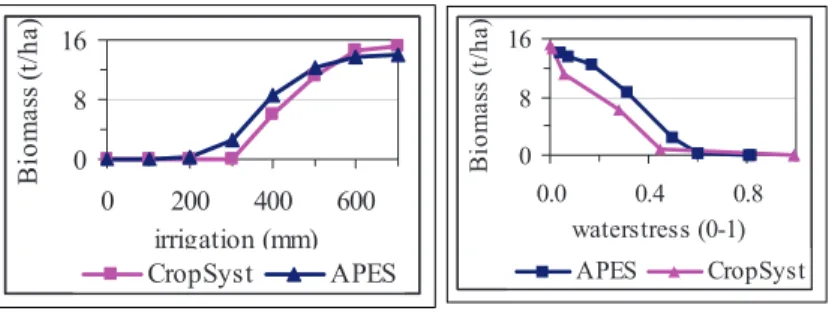
Figure 1 illustrates the total biomass trend when irrigation increases gradually from 0 to 700 mm. CropSyst is more sensitive than APES to the low amounts of water, but more biomass is simulated with the larger irrigation scenario. In APES, water stress (actual transpiration /potential transpiration) is only effective above a
given threshold level. On the other hand, in CropSyst, water stress affects linearly the biomass accumulation from emergence to flowering. After the growing period, the harvest index is adjusted to account for sensitivity to water stress during flowering and/or grain filling. The ‘threshold value’ in APES causes a lower water stress sensitivity (also linked to the function continuity) than CropSyst for equivalent levels of Actual/Potential transpiration (Figure 2).
Nitrogen-limited conditions biomass and nitrogen balance
APES simulates more biomass than CropSyst when N fertilization increases gradually from 0 to 150 kg ha–1 (Table 1). In both models, the crop experiences N stress when its N concentra-tion drops below a critical value for unrestricted growth (NNI approach, Lemaire, 1989).
The two models simulate N transformation in a similar way using first-order kinetics. Both models include routines for the simulation of soil temperature, and its effect on N transformations. The main difference between the two models is that in CropSyst the microbial community is considered as not limiting to the nitrogen transformation process, which is driven only by water and temperature. While, APES, based on the formalism of G’DAY model represents the role of soil micro-organisms in a mechanistic way through the mineralization-immobilization turnover processes during organic matter decomposition.
Biomass (t ha–1) N leaching (kg ha–1) Total mineralization (kg ha–1) N uptake (kg ha–1) N (kg ha–1)
CropSyst APES CropSyst APES CropSyst APES CropSyst APES 0 6.5 7.2 1.4 7.2 27.0 31.7 80.0 157.0 50 9.9 13.3 1.0 13.3 26.7 22.8 130.0 194.0 100 12.7 14.9 0.9 14.8 26.4 24.2 180.0 213.0 150 14.7 14.9 0.9 14.8 26.3 22.2 230.0 215.0 Conclusions
From our model comparison it appears that even if models use different approaches to simulate growth, water and N dynamics, the final results in term of crop production and exter-nalities are very similar. However, under specific conditions of water, N or/and temperature stress, some modules are more suitable to be used than others. The following main conclusions can be drawn. CropSyst seems more sensitive to heat stress than APES, especially to predict phenology and biomass accumulation. For water stress and N stress, the results seem more ambiguous due to the complexity of the approaches used that relate both to crop and soil processes.
References
Adam, M., et al., 2009. AgSAP Conference 2009, these proceedings.
Lemaire, G. (Ed.), 1997. Diagnosis of the nitrogen status in crops. Berlin, Springer, 239 pp. Mahmood, F., 2008. Mémoire de Master, SupAgro-Montpellier, 39 pp.
Stöckle, C.O., et al., 2003. European J. of Agronomy 18(3-4): 289-307. Van Ittersum, M.K., et al., 2008. Agricultural Systems 96: 150-165.
0 8 16 0.0 0.4 0.8 waterstress (0-1) B io m a ss ( t/ h a ) APES CropSyst
Figure 1. Simulated total biomass for different amounts of irrigation
Figure 2. Total biomass simulated for different amounts of irrigation v.s. water
t
Table 1. Biomass and nitrogen balance: percentage difference between CropSyst and APES.