Research Article
Sources and distribution of organic carbon and nitrogen
in the Tagliamento River, Italy
Edith Kaiser1,*, David B. Arscott2, 3, Klement Tockner2and Barbara Sulzberger2
1 Swiss Federal Institute for Environmental Science and Technology (EAWAG), Limnological Research Center,
CH-6047 Kastanienbaum, Switzerland
2 Swiss Federal Institute for Environmental Science and Technology (EAWAG), CH-8600 Duebendorf, Switzerland 3 Current address: Stroud Water Research Center, Avondale, Pennsylvania 19311, USA
Received: 22 May 2003; revised manuscript accepted: 31 October 2003
Abstract. Elemental carbon (C) and nitrogen (N) con-centrations, C:N ratios, and stable C and N isotopic com-positions (d13C and d15N) were used to determine the
sources of riverine solid phase extracted and ultrafiltered dissolved organic matter (DOM) and suspended fine particulate organic matter (FPOM). DOM and FPOM as well as potential source materials were seasonally col-lected in downstream direction along the last large semi-natural river draining the European Alps, the Taglia-mento River (Italy). These investigations suggest that the major sources of FPOM and solid phase extracted and DOI 10.1007/s00027-003-0683-4
© EAWAG, Dübendorf, 2004
ultrafiltered DOM in this river are a mixture of river-borne bacterial and microalgal biomass and soil-derived organic matter. Low C : N ratios of FPOM and bulk DOM, compared to DOM isolates, further indicate that FPOM is highly reactive and that its degradation releases bioavailable DOM compounds. Downstream abundance and distribution of organic C and N were also compared to inorganic nutrient concentrations and indicate that FPOM remineralization is a major pathway for the formation of inorganic nutrients in Tagliamento surface waters.
Key words. DOM; POM; stable C and N isotopes; nutrients.
Introduction
Carbon (C) and nitrogen (N) are essential to all life processes and vital for the flow of energy through aquatic and terrestrial environments (Wetzel, 1992). Particulate organic matter (POM) and dissolved organic matter (DOM) represent major reactive reservoirs of organic C and N on Earth (Meybeck, 1981; Hedges et al., 1997). Exploring their transport and transformations help under-stand the global biogeochemical cycling of these ele-ments.
Rivers receive, produce, and discharge a significant portion of organic material. Further, they integrate a wide range of different habitats, reaching from alpine regions to coastal and oceanic realms (Hedges et al., 1997; Op-sahl and Benner, 1997). Over the recent past we have learned that these systems perform multiple functions, which heavily depend on climate, catchment area, habitat structure and diversity, trophy, and several other factors (Ward, 1998; Arscott et al., 2000; Tockner et al., 2002). Rivers not only transport material but transform it through chemical, physical, and biological reworking (It-tekot, 1988; Hedges et al., 1994; 1997; Raymond and Bauer, 2001). The origin of organic matter is of particular interest since it greatly determines its chemical and bio-logical reactivity and hence controls specific transforma-tion pathways (Wetzel, 1992; Hedges et al., 1992; 1997). *Corresponding author phone: +41 41 3492125;
fax: +41 41 3492168; e-mail: [email protected] Published on Web: March 24, 2004
Over the past three decades, applications of elemental ratios and stable isotopes for source identifications and process studies in terrestrial and aquatic environments proliferated. The d13C of POC and DOC have been used
successfully to identify organic C sources and to enhance the understanding of organic matter cycling (Canuel et al., 1995; Benner et al., 1997; Raymond and Bauer, 2001). The d15N isotope has been beneficial to the study
of N cycling, particularly for processes such as N2
-fixa-tion, nitrifica-fixa-tion, and denitrification (Wada and Hattori, 1976; Altabet, 1988; Bronk et al., 1994; Benner et al., 1997). d15N is also used as trophy indicator and for
trac-ing the flow of N within food webs (Macko et al., 1983; Fry, 1991; McLeod et al., 1998). Many isotope composi-tion studies have been conducted in freshwater and ma-rine systems, but detailed information on how C and N cycle spatially and temporally during riverine transport is still scarce (see Finlay et al., 1999; 2001). More informa-tion is needed to better understand the exchange of en-ergy and nutrients between ecosystems, especially at the land-river interface.
Organic material borne by larger lotic systems is mainly terrestrial POM and DOM (Hedges et al., 1986; Findlay and Sinsabaugh, 1999; Raymond and Bauer, 2001) and highly degraded (Hedges et al., 1994). Owing to isotopic differences between C3- and C4-plants,
differ-ent vascular plant sources (Fogel and Cifudiffer-entes, 1993) as well as their turnover can be readily identified. Isotopic values of suspended organic particulates were found to closely match that of soil organic matter (Meybeck, 1981; Hedges et al., 1986). However, depending on riparian vegetation, stream size, and discharge, autochthonous microbial production may also contribute significant por-tions to riverine organic matter (Minshall, 1978; Finlay et al., 2001). The presence and influx of different source materials vary along longitudinal transport gradients and with season (Hobbie, 2000). Therefore, the isotopic sig-natures of different materials may overlap to a significant degree, making interpretation of d13C and d15N
measure-ments for source identification in aquatic systems dif-ficult.
In this study, a combination of C : N ratios and stable C and N isotopic compositions of DOM isolates, FPOM, and particulate organic materials were used to infer the origin and chemical and biological reactivity of riverine DOM and FPOM. Samples were collected along the Tagliamento River, located in northeast Italy (Fig. 1). This study reports results of the first measurements of stable N isotopic composition of riverine solid phase ex-tracted and ultrafiltered DOM. The downstream distribu-tion of organic C and N and inorganic nutrient concentra-tions helped to elucidate different decomposition and remineralization pathways of DOM isolates and FPOM. The overall goal of this study was to investigate the origin and spatial-temporal distribution of organic matter in the
Tagliamento River to better understand possible fates of C and N in this highly oligotrophic ecosystem.
Materials and methods
Study area and hydrology
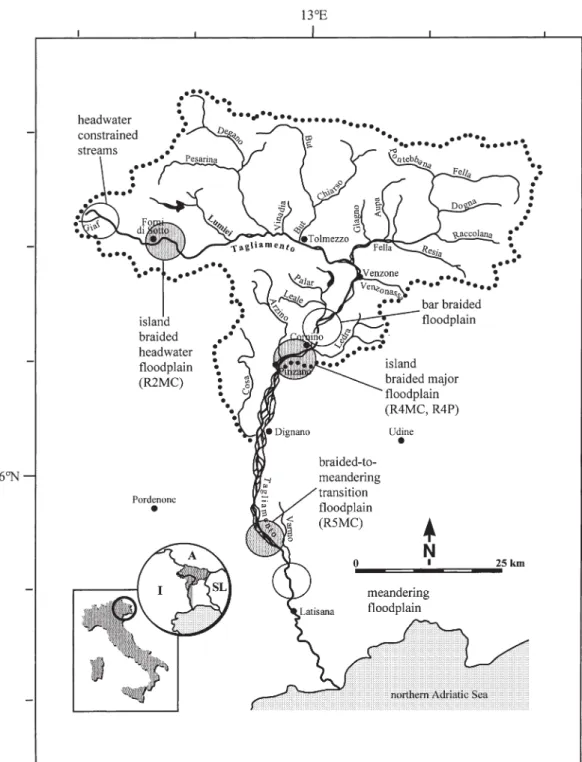
The Tagliamento River, the last large semi-natural river draining the European Alps, has been intensively studied (Ward et al., 1999; Gurnell et al., 2000; Arscott et al., 2000; 2002; Nat van der et al., 2002; Kaiser et al., 2003a; 2003b; Tockner et al., 2003). This river flows unre-strained from the alpine headwater reaches, situated in the Carnian Alps, to the northern Adriatic Sea (Fig. 1). Reach morphology grades from headwater tributaries to braided floodplains, and a lowland meandering reach near the river mouth (Ward et al., 1999; Fig.1). The chan-nel structure is highly complex and the chanchan-nels shift reg-ularly and in response to peaks in the hydrograph (Arscott et al., 2002; Tockner et al., 2003).
The hydrograph is a flashy pluvio-nival regime driven by intense rainfall events in autumn and rain on snowpack in spring. Average discharge at river-km 59 (7thorder) is
90 m3s–1, with periodically returning floods that are
esti-mated to be 1100, 1500, and 2150 m3s–1when averaged
over 2, 5, and 10 years, respectively (Gurnell et al., 2000). Major tributary streams to the Tagliamento River are the Arzino, But, Degano, and Fella (Fig. 1). The streambed typically lacks surface water at certain points along the Tagliamento mainstem during summer low-flow condi-tions (Ward et al., 1999). However, groundwater up-welling and tributaries, such as the But and Degano, con-tribute water to the mainstem, thereby replenishing surface water. Additionally, water is abstracted at river-km 33, exacerbating dry conditions, and returns to the Tagliamento mainstem at river-km ~ 68 (Lago di Carozzo).
Sample collection
Samples, such as woody debris, benthic algae, particulate organic material contained in terrestrial soil sediment (SPOM) – in the following denoted as particulate organic matter (POM) –, and suspended fine organic particles > 0.7 µm (FPOM) were bimonthly collected along the main channel (MC) in an island-braided headwater flood-plain (R2), an island-braided lower and major floodflood-plain (R4), and in a braided-to-meandering transition flood-plain (R5). Additionally, material was sampled from an isolated pool (P) located in R4 (Fig. 1, Table 1). The pool was connected to the main channel via surface flow dur-ing flood events. Small woody debris was collected par-tially submerged from surface flow or from the river banks, where it had accumulated. Benthic algae was scraped from rocks or collected from the sediment
sur-face. Samples were collected on seven dates in March, May, July, August, October, and November 1999, and April 2000. Non-decomposed wood and leaf material (Salix eleagnos, Populus nigra, and Alnus incana) was collected from R4 in April 2000. These materials were packed in clean, acid-rinsed plastic-bags, sealed, and stored frozen. Later, these materials were freeze-dried
and homogenized to powder. FPOM was collected by fil-tering raw river water (1 – 4 liters depending on turbidity) through precombusted GF/F filters (250 °C, Whatman). The filters were wrapped in precombusted aluminium-foil, and stored frozen. Homogenized POM and FPOM on GF/F filters were acidified by vapor-phase to remove residual carbonates.
Figure 1. Catchment of the Tagliamento River with sampling sites marked by large grey patches. Main channel in headwater floodplain
(R2MC), in major floodplain (R4MC), and in transition floodplain (R5MC), and isolated pool in major floodplain (R4P). The most im-portant tributary streams, the Arzino, But, Degano, and Fella in the catchment area are also shown. The inset shows the location of the Tagliamento River within Europe.
Water for C18-solid phase extraction and ultrafiltra-tion were sampled bimonthly from the Tagliamento main channel in R2, R4, and R5, and from a pool in R4 on each sampling date. Water levels between sampling events var-ied from low- to high-flow conditions (Kaiser et al., 2003 a). Water samples (~ 200 L) for DOM fractionation were collected with clean 50 L high-density polyethylene (HDPE) carboys and were transported back to the labora-tory near R4 for further processing. Immediately follow-ing collection, water samples were passed through clean GF/F- and 0.2 µm Durapore filters (142 mm diameter, Millipore) and stored in clean 50 L carboys.
On August 25 and 26, 2001, water samples were taken at 3 – 5 km intervals along the entire length of the Taglia-mento mainstem. To estimate the extent of point and non-point source nutrient addition to mainstem surface wa-ters, samples were also taken at 3 – 5 km intervals from the main channels of the tributaries Arzino, But, and Fella (Fig. 1). Tributaries and the Tagliamento mainstem were near baseflow conditions during sampling. Temperature and pH were measured in the field during sample collec-tion. FPOM was collected as described above. Filters were stored frozen for particulate organic C (POC), par-ticulate N (PN), and parpar-ticulate P (PP) analyses (see
be-low). Water for inorganic nutrient analyses and dissolved organic N (DON) were filtered using a sterile 60 mL sy-ringe (Merck) with a disposable, sterile 0.45 µm cellulose nitrate prefilter (Sartorius). The filtrates were stored in precombusted 500 mL Schott-bottles (Duran) at 4 °C in the dark. Subsamples for TOC and DOC analyses were collected directly after filtration in acid-rinsed, precom-busted 40 mL EPA glass vials (Wheaton), acidified to pH ~ 3 (2 M HCL), sealed with Teflon-lined caps, and stored at 4 °C.
DOM fractionation and isolation
The fractionation of all water samples was performed im-mediately after collection. DOM was either chemically fractionated or size fractionated. In April 2000, DOM was isolated by employing both methods in parallel for a more complete recovery of DOM components. Chemical fractionation of DOM into hydrophobic and hydrophilic compounds was achieved using a Mega Bond Elute C18 column (C18 loaded silica, 60CC, Varian) and by follow-ing the procedure by Louchouarn et al. (2001). From the bulk DOC (DOC < 0.2 µm) 6 – 29 % were recovered as a hydrophobic fraction after sorption, elution, and
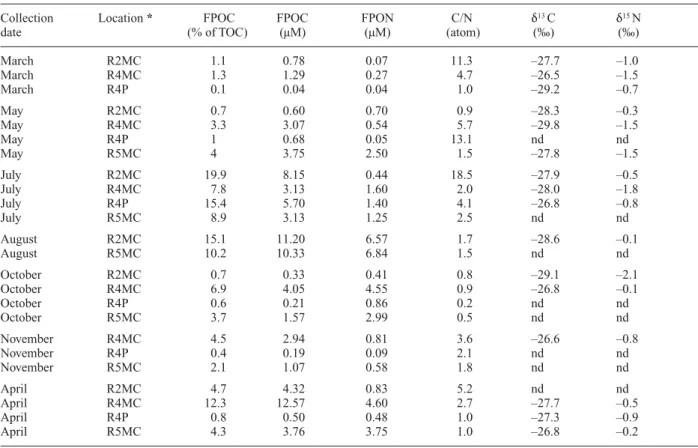
Table 1. Sample description, fraction of FPOC from TOC (%), and concentrations and stable isotope compositions of C and N in
sus-pended particulate organic matter (FPOM) (retained on a GF/F filter (>0.7 µm) from the Tagliamento River. Samples were taken in March, May, July, August, October, and November 1999, and April 2000. nd = not determined.
Collection Location * FPOC FPOC FPON C/N d13 C d15 N
date (% of TOC) (µM) (µM) (atom) (‰) (‰)
March R2MC 1.1 0.78 0.07 11.3 –27.7 –1.0 March R4MC 1.3 1.29 0.27 4.7 –26.5 –1.5 March R4P 0.1 0.04 0.04 1.0 –29.2 –0.7 May R2MC 0.7 0.60 0.70 0.9 –28.3 –0.3 May R4MC 3.3 3.07 0.54 5.7 –29.8 –1.5 May R4P 1 0.68 0.05 13.1 nd nd May R5MC 4 3.75 2.50 1.5 –27.8 –1.5 July R2MC 19.9 8.15 0.44 18.5 –27.9 –0.5 July R4MC 7.8 3.13 1.60 2.0 –28.0 –1.8 July R4P 15.4 5.70 1.40 4.1 –26.8 –0.8 July R5MC 8.9 3.13 1.25 2.5 nd nd August R2MC 15.1 11.20 6.57 1.7 –28.6 –0.1 August R5MC 10.2 10.33 6.84 1.5 nd nd October R2MC 0.7 0.33 0.41 0.8 –29.1 –2.1 October R4MC 6.9 4.05 4.55 0.9 –26.8 –0.1 October R4P 0.6 0.21 0.86 0.2 nd nd October R5MC 3.7 1.57 2.99 0.5 nd nd November R4MC 4.5 2.94 0.81 3.6 –26.6 –0.8 November R4P 0.4 0.19 0.09 2.1 nd nd November R5MC 2.1 1.07 0.58 1.8 nd nd April R2MC 4.7 4.32 0.83 5.2 nd nd April R4MC 12.3 12.57 4.60 2.7 –27.7 –0.5 April R4P 0.8 0.50 0.48 1.0 –27.3 –0.9 April R5MC 4.3 3.76 3.75 1.0 –26.8 –0.2
lyophilization (cDOC) (Table 2). Fractionation of bulk DOM into high- and low-molecular weight (HMW and LMW) DOM was achieved using a Filtron tangential flow ultrafiltration system with a polyethersulfone mem-brane (1 kDa nominal weight cutoff) and by following the protocol by Benner et al. (1997) and Kaiser et al. (2003 a). Water temperature ranged from 20 – 22 °C during ultrafil-tration. Ultrafiltered DOC (cDOC) varied between 4 – 9 % of bulk DOC after concentration and freeze-dry-ing (Table 2). For every sample, a C mass balance was es-tablished to determine whether C was lost or gained dur-ing fractionation. Samples for DOC analysis were collected as described above and stored frozen until analysis. The percentage of DOC recovered after frac-tionation of bulk DOC was calculated as follows: % of initial DOC (< 0.2 µm) = 100 (DOCretentate+ DOCpermeate)
(DOC< 0.2 µm)–1, where DOC stands for DOC
concentra-tion and was corrected by the respective concentraconcentra-tion factor. The concentration factor was calculated as fol-lows: CF (concentration factor) = ratio of the initial
sam-ple volume to the volume of retentate (concentrate) at the end of filtration (solid phase extraction). Mass balance calculations revealed that 99 – 144 % from initial DOC were recovered after ultrafiltration and 100 – 139 % after C18-solid phase extraction.
All samples for laboratory experiments were stored at 4 °C in the dark and immediately brought to EAWAG, Switzerland. DOM adsorbed onto the C18 phase was eluted by gentle vacuum-filtration using high-purity methanol (Merck). The methanol phase was removed from DOM by roto-evaporation and freeze-drying. The extract was then again redissolved in MQ-UV water (Mil-lipore). For removal of trace metals for 13C NMR
experi-ments, two solid phase extracted and one ultrafiltered DOM sample (see Fig. 6 D, E, F) were cation-exchanged (Bio-Rad, AG 50W and AG MP-50, Everett et al., 1999). All DOM concentrates were freeze-dried to a powdery solid phase. Dried material was sealed in precombusted glass tubes (Supelco) and stored at 4 °C in the dark for el-emental, stable isotope, and 13C NMR analyses.
Table 2. Sample description, concentration of bulk DOC, and concentrations (cDOC, cDON) and stable isotope compositions of C and N
in solid phase extracted and ultrafiltered dissolved organic matter from the Tagliamento River. Solid phase extracted = SPE, nd = not determined.
Collection date Location * DOC DOM cDOC cDON C/N d13 C d15 N
(µM) isolate (µM) (µM) (atom) (‰) (‰) March 1999 R2MC 81 SPE 7.9 0.13 61 –27.8 –3.5 R4MC 86 SPE 6.2 0.22 28 –27.7 –3.3 R4P 62 SPE 7.9 0.13 61 –28.0 –5.5 R5MC 32 SPE 4.1 0.14 29 –27.8 –3.2 July 1999 R2MC 38 SPE 4.9 0.24 20 –19.8 –4.3 R4MC 39 SPE 6.3 0.25 25 –26.5 –3.1 R4P 41 SPE 3.9 0.15 26 –28.4 –4.1 R5MC 34 SPE 9.2 0.31 30 –28.5 –4.6 October 1999 R2MC 47 SPE 6.4 0.26 25 –31.2 –2.3 R4MC 51 SPE 9.8 0.43 23 –27.8 –4.7 R4P 35 SPE 10.3 0.39 26 –28.0 –4.3 R5MC 48 SPE 2.9 0.13 22 –31.0 –2.8 April 2000 R2MC 85 SPE 13.6 0.22 62 –29.1 –5.0 R4MC 95 SPE 10.4 0.18 58 –30.4 –4.2 R4P 56 SPE 14.7 0.24 61 –28.3 –3.6 R5MC 83 SPE 15.9 0.23 69 –29.2 –4.6 May 1999 R2MC 89 ultrafiltered 7.3 0.21 36 –39.4 –2.2 R4MC 91 ultrafiltered 3.8 0.13 28 –35.9 –2.6 R4P 66 ultrafiltered 3.1 0.07 44 –41.6 –4.1 R5MC 78 ultrafiltered 6.5 0.25 26 –32.8 –2.1 August 1999 R2MC 76 ultrafiltered 4.8 0.15 31 –39.8 –5.0 R5MC 73 ultrafiltered 4.1 0.08 52 –38.1 –3.9 November 1999 R4MC 67 ultrafiltered 4.3 0.25 17 –35.9 –2.6 R4P 48 ultrafiltered 2.4 0.16 15 –41.8 –5.0 R5MC 50 ultrafiltered 4.4 0.25 18 –33.4 –1.7 April 2000 R2MC 85 ultrafiltered 5.7 0.15 37 –40.8 –6.7 R4MC 95 ultrafiltered 4.3 0.11 40 –35.9 –2.5 R4P 56 ultrafiltered 3.6 0.06 58 –43.1 –6.1 R5MC 83 ultrafiltered 5.6 0.15 37 –31.3 –2.9
Measurements of organic C and N and inorganic nutrients
Carbon and N contents of the various POM, FPOM, and DOM samples were measured by using a Vario-EL CHNS analyzer (Hedges and Stern, 1984). Total organic C (TOC) and DOC concentrations were determined by high temperature catalytic oxidation with a Shimadzu 5050A analyzer (Benner et al., 1993; 1997). POC was calculated as the difference between TOC and DOC con-centrations.
For samples from August 2001, concentrations of am-monium (NH4+), nitrite (NO2–), nitrite plus nitrate (NO2
–
+ NO3–), total dissolved nitrogen (TDN), dissolved organic
nitrogen (DON), soluble reactive phosphorous (SRP), to-tal dissolved phosphorous (TDP), particulate nitrogen and phosphorous (PN, PP) were analyzed as reported in Arscott et al. (2000). Particles collected on GF/F filters were not acid-fumed and may have contained inorganic N and P, in contrast to seasonally collected particles, which were treated with acid. Therefore, we use the notation PN and PP for August 2001 samples. Nitrate (NO3–) was
cal-culated as ([NO2 –
] + [NO3–]) _[NO2 –
], DON was calculated as TDN – ([NO2
–
] + [NO3–]) – [NH4+]. Temperature
(± 0.1 °C) and pH (± 0.01) were measured in the field using a Universal Pocket Meter Multiline P4 (WTW GmbH).
Stable C and N isotope analyses
Stable C and N isotope compositions of dried and ho-mogenized POM, FPOM, and isolated DOM were mea-sured on an Isoprime isotope ratio mass spectrometer (Micromass). Samples were combusted at 850 °C. Iso-topic compositions were reported as
dNE = [(R
sample/Rstandard) – 1] ¥ 1,000 (1)
where NE is the heavy isotope of an element (13C or 15N)
and R is the ratio of 13C :12C or 15N :14N in the sample and
the standard (Craig, 1957). The C and N isotope ratios of the samples were determined by comparison with the standards carbonate (NBS19 carbonate), sucrose CH-6), calcite CO-8), ammonium sulfate (IAEA-N-1, IAEA-N-2), potassium nitrate (IAEA-NO-3), and lithium carbonate (LSVEC), with all values reported rel-ative to the PeeDee Belemnite and atmospheric N2
stan-dards. The reproducibility of analysis was typically ± 0.1 ‰ for d13C and ± 0.3 ‰ for d15N.
Solid-state 13C NMR spectroscopy
13C NMR spectra of dried and homogenized POM and
isolated DOM were obtained as described by Zang et al. (2000) and Dria et al. (2002), using the ramp cross polar-ization magic angle spinning (ramp CPMAS) pulse
pro-gram and two pulse phase modulated (TPPM) decoupling on a Bruker DSX 300 NMR spectrometer, operating at a frequency of 300 MHz for 1H or 75.48 MHz for 13C.
Ap-proximately 20 – 30 mg of sample was spun at a fre-quency of 13 kHz using a contact time of 2 ms and a 1 s recycle delay time. For each sample 80,000 – 100,000 acquisitions (scans) were collected. For each sample’s free induction decay, 1,024 complex data points were col-lected and zero-filled to a total of 4,096 data points. The samples were Fourier-transformed, 100 Hz line-broaden-ing was applied and phased appropriately. The carboxyl carbon of glycine (176.03 ppm) provided a secondary ref-erence for all solid-state spectra.
The spectra were split into aliphatic and aromatic regions and integrated over 0– 60, 60 – 90, 90– 110, 110 – 160, 160 – 180, and 180 – 230 ppm regions for quan-titative comparisons. The area between 0 – 110 ppm was assigned to aliphatic carbons, and that between 110 – 160 ppm to aromatic carbons (Malcolm, 1990). The aro-maticity and aliphaticity of each sample was calculated as percent of corresponding area from the total integrated area (data not shown). The chemical shift of more defined signals indicate specific functional groups or structures, such as: alkyl groups (12 – 25 ppm), methylene (29 – 35 ppm), sugars, aliphatic methine, alcohols, methoxyl and amino carbons (45 – 90 ppm), possible anomeric sug-ars (90 –110 ppm), aromatics and alkenes (110 – 140 ppm), aromatic carbon adjacent to oxygen (140 – 160 ppm), carboxylates, aliphatic amides (160 – 190 ppm), and carbonyls and ketones (190 – 230 ppm).
Statistical analysis
Statistical analysis were performed with parametric analysis of variance (ANOVA) and the multiple t-test (Bonferroni) using SYSTAT version 10 for PC (SPSS Inc., 2000).
Results
Spatial-temporal distribution of POM, FPOM, and DOM
Based on bimonthly measurements, the C and N contents of woody debris ranged from 13 to 38 and 0.1 to 0.7 µmoles mg–1, respectively (n = 29, data not shown). In
comparison, non-decomposed wood and leaf biomass collected in April 2000 contained on average (± standard error, SE) 39 ± 1 µmoles C mg–1and 0.3 ± 0.03 µmoles N
mg–1(n = 3) (data not shown). There were no observable
downstream patterns of C and N concentrations of woody debris, however, there were seasonal trends (p < 0.02 for both). C concentrations were highest in March 1999 (p < 0.005), strongly decreased until May 1999, stayed low until November 1999, and then increased in April 2000.
N appeared to be selectively removed relative to C from March to November 1999. Benthic algal C ranged from 3 to 31 µmoles mg–1and exhibited only small seasonal
vari-ation with lowest values in May and July 1999, and high-est values in March 1999 and April 2000 (p < 0.19) (data not shown). Benthic algal N concentrations ranged from 0.1 to 1.7 µmoles mg–1with lowest values in July 1999
and highest values in March 1999 and April 2000 (p < 0.2) (data not shown). C and N contents of SPOM ranged from 0.4 to 2.1 and 0.01 to 0.03 µmoles mg–1, respectively
(n = 4, data not shown).
The C content of FPOM made up 0.1 to 19.9 % of to-tal organic carbon (TOC) in the Tagliamento River with a spatial-temporal variation between 0.04 to 12.6 µM (Table 1). The N content of FPOM was high, relative to C, and ranged from 0.04 to 6.8 µM with highest
concentra-tions observed in R2 or R4, and lowest concentraconcentra-tions in R4P (p < 0.006, Table 1).
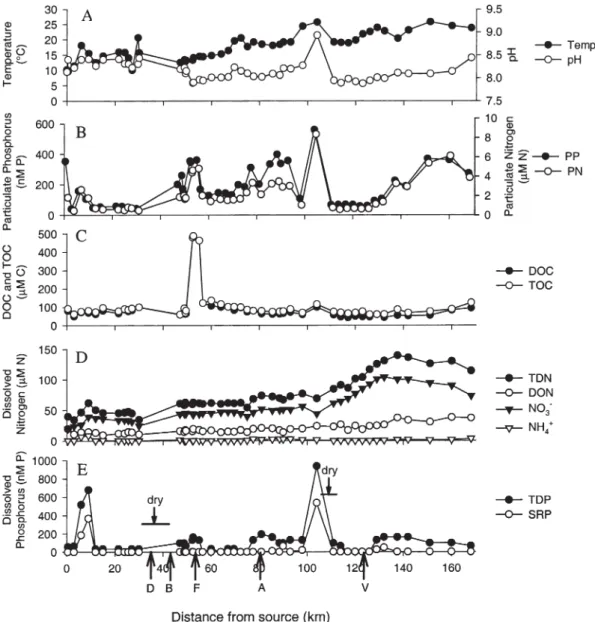
Bulk DOC concentrations in Tagliamento surface wa-ters were low, ranging from 32 to 95 µM (Table 2, Fig. 2 C). [Note that the DOC peak at river-km 50 likely re-sulted from a point-source pulp mill influx, Fig. 2 C]. DOC concentrations exhibited highest concentrations in R4MC and lowest ones in R4P and R5MC (Table 2). They also varied seasonally, being highest in March 1999 and April 2000, corresponding to high flow, and lowest in July 1999, during baseflow. An August 1999 flood-event supplied a short-term pulse of C to the system (Table 2). In August 2001, we also measured dissolved organic ni-trogen (DON) concentrations along the Tagliamento mainstem and found that they increased from ~ 5 to 33 µM N with downstream transport (Fig. 2 D). Average
Figure 2. Temperature, pH, and C, N, and P concentrations along the mainstem of the Tagliamento River in August 2001: (A)
tempera-ture and pH, (B) PP and PN , (C) TOC and DOC, (D) TDN, DON, nitrate, and ammonium, and (E) TDP and SRP. Letters and arrows in (E) indicate influx of important tributary streams: D, Degano; B, But; F, Fella; A, Arzino; V, Varmo.
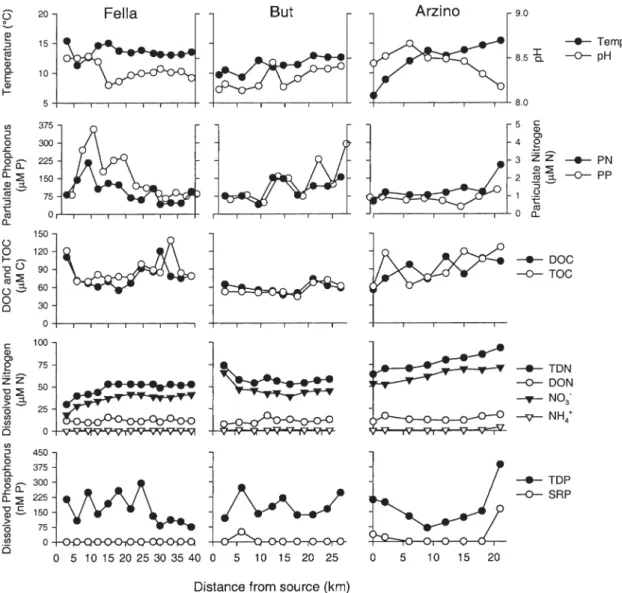
(± SE) DOC and DON inputs from the three tributary streams were 75.9 ± 3.3 µM C and 11.3 ± 0.5 µM N (raw data are shown in Fig. 3).
Carbon and N concentrations of isolated DOM (cDOC and cDON, respectively) ranged from 2.9 to 15.9 µM C and 0.1 to 0.4 µM N for solid phase extracted DOM, and from 2.4 to 7.3 µM C and 0.06 to 0.3 µM N for ultrafiltered isolates (Table 2). Significant temporal vari-ations only were observed for solid phase extracted cDOC, with highest concentrations in April 2000 and lowest in July 1999 (p < 0.02).
Fine-scale downstream distribution of C, N, and P during August 2001
Particulate organic carbon (POC) concentrations varied longitudinally from 3 to 29 µM, PN concentrations from
0.4 to 7 µM, and PP concentrations from 0.1 to 0.6 µM and followed the longitudinal variation of DOC, TDP, and SRP concentrations (Fig. 2 B, C, D, E). Note that POC concentrations represent the difference between TOC and DOC concentrations. Increased concentrations of PN and PP at river-km 55 resulted from pulp mill effluents, how-ever, they were readily diluted to upstream levels, by ad-ditional flow from the Fella tributary at river-km 57 (car-rying a greater discharge than in the mainstem). In-creased concentrations of PN and PP at river-km 80 resulted from particle influx from the Arzino tributary, and at river-km 104 from agricultural inputs and very low surface discharge for dilution (Fig. 2 E). Average (± SE) inputs of particles from the three tributaries into the Tagliamento mainstem amounted to 14 ± 1.1 µM for POC, 1.7 ± 0.2 µM for PN, and 0.16 ± 0.52 µM for PP (raw data are shown in Fig. 3).
Figure 3. Temperature, pH, and C, N, and P concentrations along the mainstem of three tributary streams of the Tagliamento River in
Nitrate increased from ~18 to 89 µM N and ammo-nium from ~ 0.2 to 3 µM N from the source region to lower reaches (river-km 168) in the Tagliamento main-stem (Fig. 2 D). This increase was due to elevated nitrate concentrations in a groundwater fed tributary (Varmo River) and increased density of agriculture in lower reaches. TDP concentrations were low, ranging from 0.03 to 0.69 µM, and SRP concentrations were as low as 0.001 to 0.534 µM in the Tagliamento mainstem (Fig. 2 E). Peak values were caused by two point-source additions of TDP and SRP at river-km 8.7 (local village effluent) and 104 (see above). Similar to PN and PP, the additional TDP was quickly removed within a downstream distance of ~ 3 km, however, the decrease was attributable to receding sur-face flow and high retention of nutrients by the hyporheic zone, rather than to dilution. In the Tagliamento main-stem, changes in dissolved nutrient concentrations tended to co-vary with PN and PP concentrations, suggesting that particles are biologically reactive and that TDP is pri-marily being released through particle decomposition and remineralization.
In the tributaries, TDN concentrations were lower than in the Tagliamento mainstem but increased with dis-tance from the source areas (Fig. 3). Average (± SE) ni-trate and ammonium concentrations in the tributaries were 44 ± 2.7 µM N and 1 ± 0.23 µM N, respectively. TDP and SRP concentrations (0.19 ± 0.02 µM for TDP and 0.01 ± 0.01 µM for SRP) were by approximately a factor of two higher than those measured along the Tagliamento mainstem and showed large variations.
C : N ratios, stable C and N isotopic compositions, and bulk chemical composition of POM, FPOM, and DOM
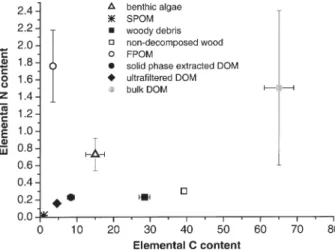
Figure 4 shows the relationship among the elemental C and N contents in POM, FPOM, and DOM isolates. Note, that all the data listed below are average values ± standard errors (SE) (see also Tables 1 and 2). The average C:N ra-tio of woody debris was 174 ± 20 and was close to the av-erage ratio of non-decomposed wood and leaf biomass (144 ± 75). Ratios were slightly higher in R2MC or R5MC than in R4P (p = 0.5), indicating differences in the chemical composition of the woody debris present in the mainstem versus the isolated pool (data not shown). The average C : N ratio of SPOM was 53 ± 18, of benthic algal biomass 46 ± 16, and of FPOM 3.7 ± 0.9 (Fig. 4). Unlike the wood material collected, SPOM has a low C:N ratio and falls close to the DOM isolates (Fig. 4). Inter-estingly, benthic algae are separate from the other POM samples, as well as from FPOM and DOM isolates (Fig. 4). C:N ratios of FPOM (Table 1) are far lower than those (8 – 10) reported in other studies (Meybeck, 1981; Hedges et al., 1986). The average C : N ratio of bulk DOM was 6.9 ± 0.1 (based on DOC and DON data shown in
Fig. 2 C and D) and is also at the lower end of values (8 – 41) reported for freshwater DOM (Meybeck, 1981; Hedges et al., 1994; Buffam et al., 2001; Tockner et al., 2002). Interestingly, the C : N ratios of bulk DOM are dif-ferent from those of DOM isolates, indicating difdif-ferent chemical composition of bulk DOM and DOM isolates. The average C:N ratios of solid phase extracted and ul-trafiltered DOM were 39.2 ± 4.6 and 33.8 ± 3.7, respec-tively (raw data shown in Table 2), and are similar to the average C:N ratio of SPOM (Fig. 4), while the C:N ratios of bulk DOM are distinct from those of POM samples.
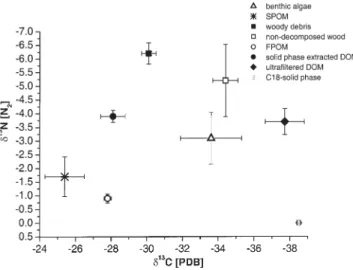
The average (± SE, n = 29) d13C and d15N of woody
debris were –30.1 ± 0.4 ‰ and –6.2 ± 0.4 ‰, respectively (Fig. 5, the individual data are not shown). Non-decom-posed wood and leaf material exhibited an average (± SE, n = 3) d13C of –34.4 ± 0.7 ‰ and d15N of –5.2 ± 1.3 ‰
(Fig. 5). Generally, d13C and d15N of woody debris
re-flected C3-plant origin and were lower than those reported
in the literature (Hedges et al., 1986; Nadelhoffer and Fry, 1988; Zah et al., 2001). The guaiacyl lignin content iden-tified by 13C NMR in woody debris (97 and 120 ppm, Fig.
6 C) additionally confirms C3-plant origin and reflects the
abundance of C3-plants in the riparian and terrestrial
veg-etation along the Tagliamento River (Karrenberg et al., 2003). Non-decomposed wood and leaf biomass con-tained more intact lignin than woody debris, as expressed by the shoulder on the peak centered around 105 ppm and by the broader carbohydrate peak (including methoxy carbons at 56 ppm) (Fig. 6 B, C). The otherwise small dif-ferences in the 13C NMR spectra of non-decomposed
wood and leaves and woody debris (Fig. 6 B, C) suggest that the collected woody debris was diagenetically young. Indeed, C fractionation in woody debris accounted for up to ~ 7 ‰ in d13C throughout 1999, indicating that the Figure 4. Average elemental C and N contents of POM, FPOM,
bulk DOM and DOM isolates. The units are mM for FPOM, bulk
DOM and DOM isolates, and mmole mg–1for the POM samples.
Note that non-decomposed wood is equivalent to non-decomposed wood and leaves. Data represent means ± standard errors.
chemical composition of wood material changes while decomposition.
The average d13C and d15N of benthic algae were
– 33.6 ± 1.7 ‰ and – 3.1 ± 0.9 ‰, respectively, and are at the lower end of values reported for streams (Hedges et al., 1986; Finlay et al., 1999; Zah et al., 2001). These val-ues reflect low primary productivity (Finlay et al., 1999), possibly limited by low SRP in Tagliamento surface wa-ters (Arscott et al., 2000). Since nitrate concentrations in Tagliamento surface flow are relatively high (Fig. 2 D), benthic algae do not appear to be N limited. Therefore, as suggested by other studies (Fogel and Cifuentes, 1993; Bronk et al., 1994), benthic algae may exhibit the N iso-tope signature of their abundant inorganic N sources, es-pecially of nitrate. SPOM was isotopically heavier than the POM and DOM samples with regard to d13C (average
value ± SE: – 25.4 ± 1.1 ‰) and had an average d15N value
of – 1.7 ± 0.7 ‰ (Fig. 5). These values correspond to lit-erature data (Hedges et al., 1986). FPOM was isotopi-cally heavier than the other POM samples with average (± SE) d13C and d15N values of – 27.4 ± 0.2 ‰ and –0.9 ±
0.2 ‰, respectively (Fig. 5).
The individual samples of both DOM isolates exhib-ited large differences in d13C (~10 ‰) (Table 1). The
av-erage d13C values of these two isolates were distinct from
each other (– 28.1 ± 0.7 ‰ and –37.7 ± 1.1‰ for solid phase extracted and ultrafiltrated DOM, respectively), while their average d15N values were similar (– 3.9 ±
0.2 ‰ and – 3.7 ± 0.5 ‰ for solid phase extracted and ultrafiltered DOM, respectively) (Fig. 5). We have also tested the C18 resin for possible contamination of the C isotopic signature of solid phase extracted DOM and found that it behaved non-contaminating (Fig. 5).
13C NMR spectroscopy of solid phase extracted DOM
(Fig. 6 D, E) revealed a relatively high aliphatic C con-tent, including carbohydrate/alcohol, and a low abun-dance of anomeric C from carbohydrates. In contrast, 13C
NMR spectroscopy of ultrafiltered DOM (Fig. 6 F) showed a higher aromatic C content, and a higher abun-dance of methoxy/amino group carbons, as compared to the solid phase extracted DOM (Fig. 6 D, E, F). Further-more, the ultrafiltered sample exhibited only a minor peak assigned to carbohydrate/alcohol carbons (see ma-terial and methods for peak identification).
Discussion
Sources of FPOM and DOM
Our results of C : N ratios and stable isotopic signature of fine suspended particulate organic matter (FPOM) and of source materials (POM) suggest that FPOM present in
Figure 5. Average stable C and N isotopic compositions of POM,
FPOM, and DOM isolates. Data represent means ± standard errors. Note that non-decomposed wood is equivalent to non-decomposed wood and leaves.
Figure 6. Solid-state 13C NMR spectra of POM and DOM isolates.
(A) Benthic algae from R4MC, April 2000, (B) Salix eleagnos (non-decomposed wood and leaves) from R4MC, April 2000, (C) woody debris from R4MC, April 2000, (D) solid phase extracted DOM from R4MC, March 1999, (E) solid phase extracted DOM from R4MC, April 2000, and (F) ultrafiltered DOM from R4MC, April 2000. The peak at ~ 33 ppm (*) is attributed to C18 contami-nation during solid phase extraction, and the one at 0 ppm (*) to methyl siloxanes. The NMR spectra of the DOM isolates (Fig. 5 D – F) exhibit relatively low signal-to-noise ratios due to low sam-ple quantities, samsam-ple comsam-plexity, and low organic C contents. Spectra D – F show some sharp peaks that are uncharacteristic for DOM and may be attributed to artifacts (Kaiser et al., 2003 a).
A B C D E F
Tagliamento surface waters is derived from more than one source material. The N content of FPOM is closest to that of benthic algae among the POM samples (Fig. 4), indicating that algae biomass probably contributes to the formation of FPOM. However, this contribution may only be minor, as suggested for watersheds < 10 km2(Finlay,
2001). Another possible source of FPOM is organic ma-terial leached from soil sediments close to the mainstem (SPOM), as inferred from similar d13C and d15N values of
these two materials (Fig. 5), in line with other studies (Rounick and Winterbourn, 1986; Schiff et al., 1997). An aggregation of dissolved organic compounds appears to be negligible for FPOM formation (Kaiser et al., 2003 a). The C:N ratios of the DOM isolates (Table 2) are much higher than those of bulk DOM, whose C : N ratio is on average ~ 7 (data not shown). Using the measured C:N ratios of bulk DOM and DOM isolates we calculated an average C : N ratio of 4 for DOM permeates. [We have calculated this C : N ratio, because DOM permeates are low-molecular weight and hydrophilic compounds and, therefore, cannot be concentrated by conventional tech-niques, see DOM fractionation and isolation.] The big difference in the average C : N ratio of DOM permeates and DOM isolates suggests that these two DOM pools have different source materials. The C : N ratio of the DOM permeates corresponds to those of FPOM (Table 1) and suggests FPOM origin. Kaiser and Sulzberger (2003 b) have shown that DOM permeates, which repre-sent the largest pool of DOM in the Tagliamento River, were highly bioavailable to riverine bacterioplankton. The fast microbial turnover of this DOM pool implies that also the production/release from FPOM must be fast. These results contradict the findings by Raymond and Bauer (2001) that FPOM forms an aged and recalcitrant compartment of riverine organic matter.
In contrast, the relatively high C : N ratios of DOM isolates correspond to those of SPOM (Table 2, Fig. 4). Regarding the individual DOM isolates, the average d13C
of solid phase extracted DOM falls close to that of SPOM (Fig. 5). However, SPOM is probably not the only source of hydrophobic DOM compounds. The relatively high aliphatic and relatively low aromatic C content, and the presence of carbohydrate/alcohol, inferred from 13C
NMR spectroscopy of solid phase extracted DOM (Fig. 6 D, E), are not in contradiction with benthic algae origin.
13C NMR spectroscopy of benthic algae biomass revealed
a high aliphatic C content (86 % of total C) (Fig. 6 A). However, the observed low abundance of anomeric C from carbohydrates in solid phase extracted DOM, com-pared to benthic algae (Fig. 6 A versus D, E), suggests that algal biomass must have been heavily degraded be-fore entering the DOM pool that could be gained by C18-solid phase extraction. The average d13C of ultrafiltered
DOM plots closest to those of benthic algae and non-de-composed wood and leaves (Fig. 5). However, the
contri-bution of benthic algal biomass is probably low as indi-cated by different abundance of anomeric C from carbo-hydrates in ultrafiltered DOM and benthic algae (Fig. 6 A versus F). Vascular plant material certainly contributes to the d13C in ultrafiltered DOM, as also indicated by the
presence of phenolic signals (representative of lignin) in the aromatic region of the 13C NMR spectra (Fig. 6 B, C,
F). Ultrafiltered DOM also contained a relatively high aromatic C content and abundance of amino group car-bons (Fig. 6 F), which are an indication for protein mate-rial being contained in high-molecular weight DOM compounds. Kaiser and co-workers (2003a) identified an abundance of protein material in ultrafiltered DOM from the Tagliamento River. Their study further indicates that soil-derived microbial biomass is an important source of ultrafiltered DOM. Furthermore, Kaiser and Sulzberger (2003 b) found that these high-molecular weight com-pounds are highly biorecalcitrant, suggesting that the pro-tein material found in ultrafiltered DOM must have been diagenetically altered. Thus, we conclude that DOM leaching from soils or being released by degradation of SPOM contributes to the pool of biorecalcitrant and slowly cycling DOM. A further support of this conclusion is that the d15N of the DOM isolates were less variable
than those of FPOM (Table 1, 2), suggesting that the high-molecular weight and hydrophobic compounds are less dynamic than the small FPOM reservoir, which is an important source of low-molecular weight and hy-drophilic compounds in the Tagliamento River (see above).
Interestingly, the average d15N of both DOM isolates
were close and isotopically lighter than SPOM and FPOM (Fig. 5). In river water, bacterial degradation of SPOM may cause N sequestration and can explain low
d15N in DOM isolates (Macko and Estep, 1983). Similar
differences in the isotopic signature of POM and ultrafil-tered DOM have been observed in marine samples (Ben-ner et al., 1997). However, the average d15N of both DOM
isolates plotted close to benthic algae (Fig. 5), indicating that benthic algae biomass may also be contained in the DOM isolates (see above).
Spatial-temporal variability of POM, FPOM, and DOM
Large seasonal variations in C and N concentrations of woody debris collected along the Tagliamento mainstem probably result from wood material having different vas-cular plant sources from different locations in the vast river catchment and, therefore, show various degrees of decomposition. High floodplain complexity in the Taglia-mento River further fosters accumulation/retention of wood material (Gurnell et al., 2000; Tockner et al., 2003). Longer residence times of woody debris also add to the complexity in chemical composition of this material.
High C and N concentrations in woody debris in spring and winter may have resulted from deposition and accu-mulation of woody material during cold periods with low-flow. Whereas, lower concentrations in summer and fall may have resulted from rapid removal of reactive or labile components from freshly produced woody debris. Nitrogen was selectively removed from woody debris during summer and fall months. Microbial utilization of labile organic N from decomposing woody material is known to be fast, usually within the order of days (Kaushik and Hynes, 1971). Decreasing N concentrations from March to October 1999, therefore, indicate a rapidly cycling component of organic N in woody debris. C and N concentrations measured in benthic algae were highest in early spring months (data not shown). These increased concentrations are due to rising temperatures and in-creased primary productivity, which was stimulated by excess nutrients from snow melt.
In this study we found that the abundance of FPOM was low relative to stream size, in contrast to the data by Meybeck (1981). Only ~ 5 % on average of river-borne TOC was present in the form of FPOC and > 90 % resided in the dissolved phase (Table 1). FPOM abundance was generally lowest in the isolated pool, due to particle sedi-mentation and dilution by upwelling groundwater (Table 1). Only during flood events were high percentages of FPOM measured in the Tagliamento River (Arscott et al., pers. comm.). The high N content of FPOM, which was also observed in other studies (Malcolm and Duurum, 1976; Hedges et al., 1994) suggests high biological reac-tivity of this organic matter pool as well as continuous in-put of FPOM along the river. Adsorption of the N-rich FPOM onto positively charged clay minerals can be ne-glected because Kaiser and Sulzberger (2003 b) observed only negligible amounts of clay minerals in the Taglia-mento River. FPOM concentrations shortly increased during post-flood conditions in August 1999. Since our study suggests that FPOM is an important source mater-ial of low-molecular weight and hydrophilic, i. e., bioavailable DOM compounds, we assume that during flood events with higher amounts of FPOM, increased concentrations of bioavailable DOM are released into Tagliamento surface waters. A high abundance of bioavailable DON during a flood was observed by Stepanauskas et al. (2000) in a boreal stream.
Strong seasonal variations in bulk DOC, cDOC, and cDON concentrations (Table 2) reflect fluctuations in dis-charge, as also was shown by Mantoura and Woodward (1983), as well as various decomposition rates of precur-sor materials. Source materials of DOM have smaller de-composition rates during cold periods with low-flow, and therefore a smaller DOM release. With increasing dis-charge and temperature, i. e., under high-flow conditions in spring, DOM release increases, particularly from de-composition of freshly produced vascular plant biomass.
During summer and fall low-flow, autochthonous algal and prokaryotic biomass production declines and, there-fore, also their contribution to DOM.
Possible fate of C and N in the Tagliamento River Based on total organic carbon (TOC), total N, and total P concentrations, average monthly discharge (1998 – 1999), and catchment area (Arscott et al., 2000, and pers. comm.), we calculated exports of ~ 3184 kg C km–2y–1,
~ 632 kg N km–2y–1, and ~ 22 kg P km–2y–1from
Taglia-mento surface waters to the river estuary and possibly to the northern Adriatic Sea. In comparison, Meybeck (1981) estimated average exports of ~3899 kg C km–2y–1,
but only ~140 kg N km–2y–1and ~11 kg P km–2y–1 for
rivers of similar size and discharge. In the Tagliamento River, TOC export is dominated by POC and is dramati-cally increased during flood events on top of base flow. According to our calculations, the average POC export is ~ 2613 kg C km–2y–1while that of DOC is only ~ 571 kg
C km–2y–1. Our calculations also predict that from total
N, export of dissolved inorganic N dominates, and from total P, export of PP. Overall, it appears that the Taglia-mento River recycles C, however, transports N and P.
As stated above, C export from the Tagliamento River is lower compared to rivers reported by Meybeck (1981), and retention of organic material, i.e., woody debris, is high (Gurnell et al., 2000). Therefore, we assume that a dominant portion of organic matter is transformed in the Tagliamento River during its transport to the northern Adriatic Sea. This study suggests that in this river the ma-jor source of bioreactive DOM and in part of inorganic nutrients is diagenetically young FPOM. Bioreactive DOM is further transformed by microbial processes, re-sulting in the production of biorecalcitrant, low-molecu-lar weight compounds. We, therefore, assume, as also proposed by Kaiser and Sulzberger (2003b), that the Tagliamento River dominantly exports small and diage-netically highly altered moieties of DOM to the northern Adriatic Sea that contributes to the large pool of highly degraded, aged, and low-molecular weight marine DOM. For these reasons we propose that the elucidation of the sources and fates of organic matter in semi-natural rivers helps to increase our understanding of global carbon cy-cling.
Acknowledgments
The authors are grateful to the Tagliamento Research group for enormous help with water sampling and other field work. We specially thank Toni Mares, Karl Dria, and Achim Paetzold for all their help with sample measure-ments, and Ronald Benner, Patrick Hatcher, and Bern-hard Wehrli for their enthusiasm, consistent support, and
advice to make this work possible. Many critical com-ments by Laura Sigg helped to improve the manuscript considerably. This work was supported by EAWAG. NMR spectroscopy was performed in the Department of Chemistry at The Ohio State University, Columbus, Ohio.
References
Altabet, M. A., 1988. Variations in nitrogen isotopic composition between sinking and suspended particles: Implications for ni-trogen cycling and particle transformation in the open ocean. Deep-Sea Res. 35: 535–554.
Arscott, D., K. Tockner and J. V. Ward, 2000. Aquatic habitat diver-sity along the corridor of an alpine floodplain river (Fiume Tagliamento, Italy). Arch. Hydrobiol. 149: 679–704. Arscott, D. B., K. Tockner and J. V. Ward, 2002. Geomorphic
dy-namics along a braided-river corridor in the Alps (Fiume Tagliamento, NE Italy). Ecosystems. 5: 803–814.
Benner, R. and M. Strom, 1993. A critical evaluation of the analyt-ical blank associated with DOC measurements by high-tem-perature catalytic oxidation. Mar. Chem. 41: 153–160. Benner, R., B. Biddanda, B. Black and M. McCarthy, 1997.
Abun-dance, size distribution, and stable carbon and nitrogen iso-topic compostion of marine organic matter isolated by tangen-tial-flow ultrafiltration. Mar. Chemistry 57: 243–263. Bronk, D. A., P. M. Gilbert and B. B. Ward, 1994. Nitrogen uptake,
dissolved organic nitrogen release, and new production. Sci-ence 265: 1843–1846.
Buffam, I., J. N. Galloway, L. K. Blum and K. J. McGlathery, 2001. A stormflow/baseflow comparison of dissolved organic matter concentrations and bioavailability in an Appalachian stream. Biogeochemistry 53: 269–306.
Canuel, E. A., J. E. Cloern, D. B. Ringelberg, J. B. Guckert and G. H. Rau, 1995. Molecular and isotopic tracers used to examine sources of organic matter and its incorporation into the food-webs of San Francisco Bay. Limnol. Oceanogr. 40: 67–81. Craig, H., 1957. Isotopic standards for carbon and oxygen and
cor-rection factors for mass-spectrometric analysis of carbon diox-ide. Geochim. Cosmochim. Acta 12: 133–149.
Dria, K. J., J. R Sachleben and P. G. Hatcher, 2002. Solid-state car-bon–13 nuclear magnetic resonance of humic acids at high magnetic field strengths. J. of Environ. Quality 31: 393–401. Everett, C. R., Y.-P. Chin and G. R. Aiken, 1999. High-pressure size
exclusion chromatography analysis of dissolved organic matter isolated by tangential-flow ultrafiltration. Limnol. Oceanogr.
44: 1316–1322.
Findlay, S. and R. L. Sinsabaugh, 1999. Unravelling the sources and bioavailability of dissolved organic matter in lotic aquatic ecosystems. Marine and Freshwater Res. 50: 781–790. Finlay, J. C., M. E. Power and G. Cabana, 1999. Effects of water
ve-locity on algal carbon isotope ratios: implications for river food web studies. Limnol. Oceanogr. 44: 1198–1203.
Finlay, J. C., 2001. Stable-Carbon-Isotope ratios of river biota: Im-plications for energy flow in lotic food webs. Ecology 82: 1052–1064.
Fogel, M. and L. Cifuentes, 1993. Isotope fractionation during primary production. In: Engel, M. H. and S. A. Macko (eds.), Organic Geochemistry: Principles and Applications. Plenum Press, New York: 73–98.
Fry, B., 1991. Stable isotope diagrams of freshwater food webs. Ecology 72: 2293–2297.
Gurnell, A. M., G. E. Petts, N. Harris, J. V. Ward, K. Tockner, P. J. Edwards and J. Kollmann, 2000. Large wood retention in river channels: The case of the Fiume Taglimento. Earth Surf. Process. Landforms 25: 255–275.
Hedges, J. I. and J. H. Stern, 1984. Carbon and nitrogen determina-tion of carbonate containing solids. Limnol. Oceanogr. 29: 657–663.
Hedges, J. I., W. A. Clark, P. D. Quay, J. E. Richey, A. H. Devol and U. De M. Santos, 1986. Compositions and fluxes of particulate organic material in the Amazon River. Limnol. Oceanogr. 31: 717–738.
Hegdes, J. I., 1992. Global biogeochemical cycles: progress and problems. Mar. Chem. 39: 67–93.
Hedges, J. I., G. L. Cowie, J. E. Richey, P. D. Quay, R. Benner, M. Strom and B. R. Forsberg, 1994. Origins and Processing of or-ganic matter in the Amazon River as indicated by carbohydrates and amino acids. Limnol. Oceanogr. 39: 743–761.
Hedges, J. I., R. G. Keil and R. Benner, 1997. What happens to ter-restrial organic matter in the ocean? Org. Geochem. 27: 195–212.
Hobbie, J. E., 2000. Estuarine Science: The Key to Progress in Coastal Ecological Research. Island Press, Washington. Ittekot, V., 1988. Global trends in the nature of organic matter in
river suspensions. Nature 332: 436–438.
Kaiser, E., A. J. Simpson, K. J. Dria, B. Sulzberger and P. G. Hatcher, 2003a. Solid-state and multidimensional solution-state NMR of solid phase extracted and ultrafiltered riverine dissolved organic matter (DOM). Environ. Sci. Technol. 37: 2929–2935.
Kaiser, E. and B. Sulzberger, 2003b. Photochemical transforma-tions of riverine dissolved organic matter in the presence of abundant iron: Impact on bioavailability. Limnol. Oceanogr., in press.
Karrenberg, S., J. Kollmann, P. J. Edwards, A. M. Gurnell and G. E. Petts, 2003. Longitudinal patterns in woody vegetation along the active zone of a near-natural alpine river. Basic and Applied Ecology 4: 157–166.
Kaushik, N. K. and H. B. Hynes, 1971. The fate of dead leaves that fall into streams. Arch. Hydrobiol. 68: 465–515.
Louchouarn, P., S. Opsahl and R. Benner, 2001. Isolation and quan-tification of dissolved lignin from natural waters using solid-phase extraction and GC/MS. Anal. Chem. 72: 2780–2787. Macko, S. A. and M. L. F. Estep, 1983. Microbial alteration of
sta-ble nitrogen and carbon isopotic compositions of organic mat-ter. Annual Report of the Director, Geophysical Laboratory, Carnegie Institution of Washington, 1982–83: 394–398. Malcolm, R. and W. H. Durum, 1976. Organic carbon and nitrogen
concentrations and organic load of six selected rivers of the United States. US. Geol. Survey Water Supply Paper 1817F, 21pp. McLeod, N. A. and D. A. Barton, 1998. Effects of light intensity, water velocity, and species composition on carbon and nitrogen stable isotope ratios in periphyton. Can. J. Fish. Aqu. Sci. 55: 1919–1925.
Mantoura, R. F. C. and E. M. S. Woodward, 1983. Conservative be-haviour of riverine dissolved organic carbon in the Severn Es-tuary: chemical and geochemical implications. Geochim. Chosmochim. Acta 47: 1293–1309.
Meybeck, M., 1981. Carbon, nitrogen, and phosphorous transport by world rivers. Am. J. Sci. 282: 401–450.
Minshall, G. W., 1987. Autotrophy in stream ecosystems. Bio-science 28: 767–771.
Nat van der, D., 2002. Ecosystem processes in the dynamic Taglia-mento River (NE-Italy). Ph.D. Thesis. Swiss Federal Institute of Technology Zurich (ETHZ), Switzerland.
Nadelhoffer, K. L. and B. Fry, 1988. Controls on natural nitro-gen–15 and carbon–13 abundnaces in forest soil organic mat-ter. Soil Sci. Am. J. 52: 1633–1640.
Opsahl, S. and R. Benner, 1997. Distribution and cycling of ter-rigenous dissolved organic matter in the ocean. Nature 386: 480–482.
Raymond, P. A. and J. E. Bauer, 2001. Riverine export of aged ter-restrial organic matter to the North Atlantic Ocean. Nature 409: 497–500.
Rounick, J. S. and M. J. Winterbourn, 1986. Stable carbon isotopes and carbon flow in ecosystems. BioScience 36: 171–177. Schiff, S. L., R. Aravena, S. E. Trumbone, M. J. Hinton, R. Elgood
and P. J. Dillon, 1997. Export of DOC from forested catchments on the Precambrian Shield of Central Ontario: clues from 13C
and 14C. Biogeochemistry 36: 43–65.
Stepanauskas, R., H. Laudon and N. O. G. Joergensen, 2000. High DON bioavailability in boreal streams during a spring flood. Limnol. Oceanogr. 45: 1298–1307.
Tockner, K., F. Malard, U. Uehlinger and J. V. Ward, 2002. Nutrients and organic matter in a glacial river-floodplain system (Val Roseg, Switzerland). Limnol. Oceanogr. 47: 266–277. Tockner, K., J. V. Ward, D. B. Arscott, P. J. Edwards, J. Kollmann, A.
M. Gurnell, G. E. Petts and B. Maiolini, 2003. The Tagliamento River: A model ecosystem of European importance. Aquatic Sciences 65(3): 239–253.
Wada, E. and A. Hattori, 1976. Natural abundance of 15N in
partic-ulate organic matter in the North Pacific Ocean. Geochim. Chosmochim. Acta 40: 249–251.
Ward, J. V., 1998. Riverine landscapes: Biodiversity patterns, dis-turbance regimes, and aquatic conservation. Biological Conser-vation 83: 269–278.
Ward, J. V., K. Tockner, P. J. Edwards, J. Kollmann, G. Bretschko, A. M. Gurnell, G. E. Petts, 1999. A reference river system for the alps: the “fiume Tagliamento”. Regul. Rivers: Res. Mgmt.
15: 63–75.
Wetzel, R. G., 1992. Gradient-dominated ecosystems: sources and regulatory functions of dissolved organic matter in freshwater ecosystems. Hydrobiologia 229: 181–198.
Zah, R., P. Burgherr, S. Bernasconi and U. Uehlinger, 2001. Stable isotope analysis of macroinvertebrates and their food sources in a glacier stream. Freshwater Biol. 46: 871–882.
Zang, X., J. D. H. Heemst, K. J. Dria and P. G. Hatcher, 2000. En-capsulation of protein in humic acid from Histosols as an ex-planation for the occurrence of organic nitrogen in soil and sed-iment. Org. Geochem. 31: 679–695.