Plant Protection Products
Uncertainties in LCA
192
Int J LCA 1010101010 (3) 2005Supporting Information
Uncertainty Analysis in Life Cycle Assessment (LCA): Case Study on Plant
Protection Products and Implications for Decision Making
Georg Geisler
1, Stefanie Hellweg
1* and Konrad Hungerbühler
11 Institute for Chemical- and Bioengineering, Swiss Federal Institute of Technology, ETH-Hönggerberg, CH-8093 Zürich, Switzerland
* Corresponding author ([email protected])
DOI: http://dx.doi.org/10.1065/lca2004.09.178. 1
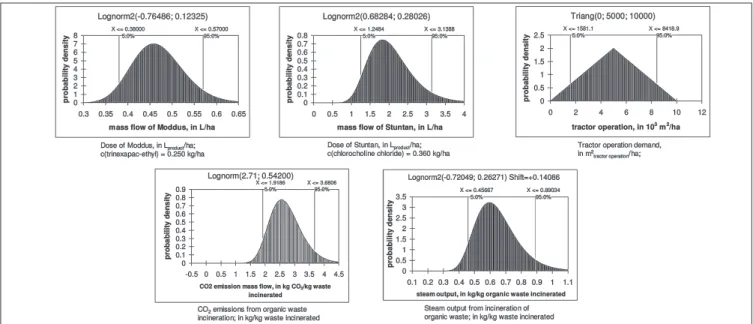
lognormal distributions for most parameters in the LCA of the case study. Dispersion factors are documented in Table S2 con-cerning characterisation factors of the CML-baseline method [12]. Additional uncertainty in the composition of sum param-eters was depicted as uniform distributions (see main article), the minimum and maximum values of which are documented in Table S3. To determine these values, first a set of substances contained in each sum parameter was chosen from all substances characterised in the CML-baseline method [13]. From these sets of substances, the minimum and maximum characterisa-tion factors were then determined for each sum parameter. Fi-nally, several parameters in the LCA model were based on data specifically acquired. Uncertainty in these parameters was as-sessed by statistical fitting of probability distributions, where enough data was available. In most cases, however, only few data were available, and therefore lognormal distributions were parameterised using dispersion factors (Equation 2, main article, DOI: http://dx.doi.org/10.1065/lca2004.09.178). Resulting dis-tributions for parameters with some importance in the assess-ment are docuassess-mented in Fig. S1. Dose distributions were calcu-lated from dose ranges recommended by pesticide registration
1 Generic Dispersion Factors for Elementary Flows
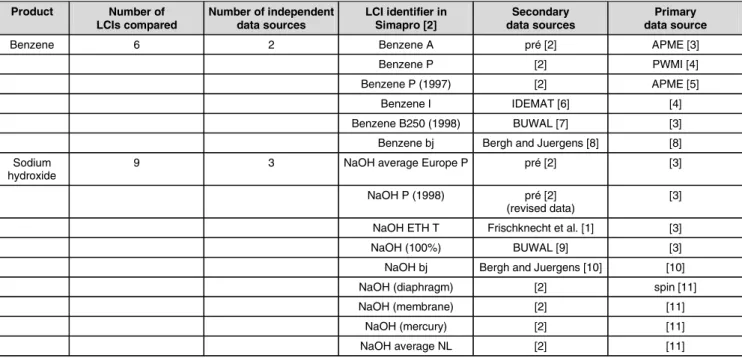
Elementary flows were compared in LCIs of sodium hydroxide and benzene production from different sources in order to de-rive generic dispersion factors (Equation 2 main article) for groups of these flows. Sources of the LCI datasets compared are shown in Table S1.
To calculate the dispersion factors listed in Table 2 (main article, DOI: http://dx.doi.org/10.1065/lca2004.09.178), the nomencla-ture of elementary flows and sum parameters was first harmo-nised between the LCIs in Table S1. All energy flows were then converted to primary energy demands [1] and divided into feedstock and energy supply use. Finally, dispersion factors (Equa-tion 2 main article) were calculated for all elementary flows. El-ementary flows with values below 10-10 kg/kg
product were excluded because such low values are likely to be calculation artefacts.
2 Probability Distributions for Parameters in the LCA Model
Generic dispersion factors (Equation 2, main article, DOI: http://dx. doi.org/10.1065/lca2004.09.178) were used to parameterise
Product Number of LCIs compared Number of independent data sources LCI identifier in Simapro [2] Secondary data sources Primary data source
Benzene 6 2 Benzene A pré [2] APME [3]
Benzene P [2] PWMI [4]
Benzene P (1997) [2] APME [5]
Benzene I IDEMAT [6] [4]
Benzene B250 (1998) BUWAL [7] [3]
Benzene bj Bergh and Juergens [8] [8]
Sodium hydroxide
9 3 NaOH average Europe P pré [2] [3]
NaOH P (1998) pré [2]
(revised data)
[3]
NaOH ETH T Frischknecht et al. [1] [3]
NaOH (100%) BUWAL [9] [3]
NaOH bj Bergh and Juergens [10] [10]
NaOH (diaphragm) [2] spin [11]
NaOH (membrane) [2] [11]
NaOH (mercury) [2] [11]
NaOH average NL [2] [11]
Table S1: Sources of LCIs used to derive generic dispersion factors for elementary flows, including the number of of LCIs from independent data sources.
APME is a successor organisation of PWMI
192.1
© 2005 ecomed publishers (Verlagsgruppe Hüthig Jehle Rehm GmbH), D-86899 Landsberg and Tokyo • Mumbai • Seoul • Melbourne • Paris Int J LCA 1010101010 (3) 192.1 – 192.3 (2005)
Uncertainties in LCA
Plant Protection Products
Int J LCA 1010101010 (3) 2005
193
Impact category Cases Dispersion factor CV, dimensionless
Emission to air or soil 500 159
Terrestrial ecotoxicity potential
Emission to other compartments 1000 500
Emission to air or fresh water 50 10
Freshwater ecotoxicity potential
Emission to other compartments 100 150
Human toxicity potential Emission to any compartment 50 10
Substances with net positive radiative forcing 1.4 0.17
Global warming potential
CO2 as reference substance None None
kOH < 4.0E-13 cm3/(molecule s) 2.1 0.39
(4.0E-13< kOH < 4.0E-11) cm3/(molecule s) k = –0.2 * ln(kOH) – 3.5 Substance-dependent
Photooxidant creation potential
kOH > 4.0E-11 cm3/(molecule s) 1.2 0.09
Acidification potential None 2.2 0.42
Eutrophication potential None 1.8 0.31
Table S2: Generic dispersion factors (Equation 2 main article) for characterisation factors in the impact categories of the CML-baseline method, from
Huijbregts [14]. Coefficients of variation calculated according to [15]
Sum parameter name Photooxidant creation potential Human toxicity potential Freshwater ecotoxicity potential Terrestrial ecotoxicity potential Minimum Maximum Minimum Maximum Minimum Maximum Minimum Maximum
Emissions to air
Aldehydes 5.1E-01 8.0E-01 8.3E-01 5.7E+01 8.3E+00 5.2E+02 9.4E-01 1.6E+01
Alkanes 1.2E-01 1.1E+00
Alkenes 6.3E-01 1.1E+00 4.3E-03 9.6E+01 8.7E-15 2.0E-10
Alcohols 1.1E-01 6.2E-01
Cfc(soft) 6.8E+00 3.4E+01 3.8E-05 1.2E-04 4.7E-06 1.8E-04
CxHy 6.0E-03 1.1E+00 2.7E-02 1.9E+03 1.4E-11 8.3E+00 1.3E-12 9.4E-01
CxHy aliphatic 4.3E-03 9.6E+01 8.7E-15 2.0E-10
CxHy aromatic 1.4E-01 1.4E+00 2.7E-02 1.9E+03 4.4E-05 4.5E+00 1.4E-07 3.2E-02
CxHy chloro 5.0E-03 4.5E-01 1.0E+00 3.5E+03 3.3E-05 1.3E+00 4.3E-06 2.6E-01
Cycloalkanes 6.0E-03 1.1E+00
Esters 2.7E-02 4.6E-01 1.0E+00 3.5E+03 3.3E-05 1.3E+00 4.3E-06 2.6E-01
Ethers 1.8E-01 4.5E-01
Heavy metalsb 1.7E+00 3.4E+06 1.9E+00 1.7E+03 6.1E-01 3.0E+03
Ketones 9.4E-02 6.0E-01
PAHs 5.2E-01 8.1E+00 5.0E-01 3.9E+03 1.4E-04 3.0E+01
Xylene 1.0E+00 1.1E+00 2.7E-02 1.2E-01 4.4E-05 9.3E-05 5.3E-07 1.3E-06
Emissions to water
AOX 1.1E+00 9.1E+03 1.2E-02 5.2E+03 2.6E-07 4.4E-01
Chlorobenzenes 1.1E+00 9.1E+03 1.2E-02 5.2E+03 2.6E-07 4.4E-01
Chromate 2.1E+00 3.4E+00 6.9E+00 2.8E+01 n/aa n/aa
CxHy chloro 1.1E+00 9.1E+03 1.2E-02 5.2E+03 2.6E-07 4.4E-01
Metallic ions 1.7E-02 2.3E+05 6.9E+00 9.1E+04 4.8E-22 3.3E-16
PAHs 2.1E+00 5.6E+00 5.2E+02 1.2E+06 6.2E-06 2.1E-01
Phenols 4.9E-02 9.1E+03 1.7E+02 5.2E+03 2.5E-06 6.1E-02
Xylenes 3.4E-01 4.2E-01 5.5E-01 6.0E-01 4.9E-07 1.2E-06
a n/a – not applicable due to lack of differentiation in characterisation factors between Cr(III) and Cr(VI) b The same uncertainties apply also for the sum parameter 'metals'
Table S3: Characterisation factors for sum parameters. The minimum and maximum characterization factor of components of each sum parameter were
used to define a uniform distribution that depicts the uncertainty due to the unknown composition of the sum parameter
Plant Protection Products
Uncertainties in LCA
194
Int J LCA 1010101010 (3) 2005authorities [16]. Tractor demand was defined as triangular distri-bution by expert judgement. Distridistri-butions for emissions and steam output from incineration were fitted to on-site data [17] using the @Risk software [18].
3 Contribution to Variance
When using Monte-Carlo Simulation, the influence of the in-put parameters on the results of any model is determined via correlation analysis [19]. Rank-order correlation coefficients [20] were calculated between any input and result parameters in the LCA model with the software @Risk [18].
The contribution of a single uncertain input parameter to the distribution of the result of an impact category was calculated according to CTVi,j= 2 j i, r2 j i, r -1 ⋅
∑
= i n 1 i 2 j i, r (1)where CTVi,j is the contribution to variance of one uncertain input parameter i to the probability distribution of the result of the impact category j (dimensionless), ri,j is the rank-order cor-relation coefficient between the parameter i and the score of impact category j, and ni is the number of parameters contrib-uting to the variance in the result of impact category j. Contri-bution to variance measures the influence of an input param-eter on the distribution of a result in terms of dispersion as well as in terms of the absolute order of magnitude of the results' values. Input parameters with high contributions to the abso-lute value of impact scores but very little uncertainty exhibit a minor contribution to variance, which is not corresponding to their contribution to absolute impact scores. However, such pa-rameters do not exist in the model analysed here owing to the use of generic uncertainties.
References
[1] Frischknecht RE, Bollens U, Bosshart S, Ciot M et al. (1996): Ökoin-ventare von Energiesystemen (LCIs of Energy Systems). Swiss Federal Office of Energy, Bern, 3rd ed
[2] Simapro 5.0 – LCI Database and LCA-Software 5.0.(2002): Pré con-sultants B.V., Amersfoort, the Netherlands
[3] Boustead I (1999): Eco-Profiles of Plastics and Related Intermediates. Association of Plastics Manufacturers in Europe (APME), Brussels [4] Ecoprofiles of the European plastics industry – Polystyrene (1993):
PWMI report. PWMI, Brussels, no. 4
[5] Ecoprofiles of the European plastics industry – Polymethyl methacr-ylate (1997): APME report. APME, Brussels, no. 14
[6] IDEMAT LCI-Database for material information for design and con-struction purposes (2001): Technical University of Delft
[7] Life Cycle Inventories for Packagings (1998): Part I and II. BUWAL Report. Bundesamt für Umwelt, Wald und Landwirtschaft (BUWAL), Bern, 250, 2nd ed
[8] Bergh V d, Jurgens (1990): LCI on Benzene Production – Dataset In-cluded in the Simapro 5.0 Database. Pré consultants, Amersfoort, NL [9] Ökoinventare für Verpackungen (LCIs of packaging) (1996): Schrif-tenreihe Umwelt. Bundesamt für Umwelt, Wald und Landwirtschaft (BUWAL), Bern, 250
[10] Bergh V d, Jurgens (1990): LCI on Sodium Hydroxide Production – Dataset Included in the Simapro 5.0 Database. Pré consultants, Amersfoort, NL
[11] Booij H (1993): Produktie van chloor. National Institute of Public Health and Environmental Protection (RIVM), The Hague, NL [12] Guinée JB, Gorrée M, Heijungs R, Huppes G et al. (2001): CML-Guide
to Life Cycle Assessment. Institute of Environmental Sciences (CML), Leiden University, NL
[13] van Oers L (2001): Impact Assessment Factors for the Problem Ori-ented Approach (CML-baseline method). 2.5 edition. Institute of En-vironmental Sciences (CML), Leiden University, NL <http://www. leidenuniv.nl/cml/lca2/index.html>
[14] Huijbregts MAJ (2001): Uncertainty and variability in environmental life-cycle assessment. Dissertation, Universiteit van Amsterdam, Faculteit natuurwetenschappen, wiskunde en informatica, Amsterdam, NL [15] Slob W (1994): Uncertainty analysis in multiplicative models. Risk
Analysis 14, 571–576
16] Pflanzenschutzmittelverzeichnis (Directory of Plant Protection Prod-ucts) (2002): Bundesamt für Landwirtschaft (BfL), Bern
[17] Data on Utility Inputs into and Emissions from the Chemical Waste Incinerator and the Wastewater Treatment Plant at the Monthey Pro-duction Site (2000): CIMO SA, Monthey, CH
[18] @Risk 4.5 – Risk Analysis Add-in for Microsoft Excel (2001): Palisade Corporation, Newfield, NY, USA
[19] Morgan MG, Henrion M (1990): Uncertainty. Cambridge University Press, Cambridge
[20] Hartung J, Elpelt B, Klösener K-H (1995): Statistik. 10th ed. R. Oldenburg Verlag, München
Fig. S1: Probability distributions of important specific parameters in the LCA model. Lognorm2 is a lognormal distribution parameterised with the mean
and standard deviation of the lognormal transformed data. Lognorm is a lognormal distribution parameterised with mean and standard deviation of the data in the linear space. Triang is a triangular distribution
![Table S2: Generic dispersion factors (Equation 2 main article) for characterisation factors in the impact categories of the CML-baseline method, from Huijbregts [14]](https://thumb-eu.123doks.com/thumbv2/123doknet/14843913.626389/2.892.71.820.132.395/generic-dispersion-factors-equation-characterisation-categories-baseline-huijbregts.webp)