Supplementary materials
Table S.3a. Adjusted prevalence rations (APR) for never CCS among eligible women in Switzerland and Belgiuma
Never had a CCS in Switzerland (women aged 20-70) Never had a CCS in Belgium (women aged 25-64 y/o)
1992 N = 5452 1997 N = 3838 2002 N = 7495 2007 N = 6845 2012 N = 8170 1997 N = 2114 2001 N = 2073 2004 N = 1943 2008 N = 1664 2013 N = 1648
APR 95% CI APR 95% CI APR 95% CI APR 95% CI APR 95% CI APR 95% CI APR 95% CI APR 95% CI APR 95% CI APR 95% CI
Education (ref: primary & lower secondary)
Upper secondary 0.7 0.59-0.82 0.58 0.46-0.72 0.71 0.59-0.85 0.61 0.50-0.74 0.63 0.53-0.75 0.76 0.57-1.00 0.97 0.72-1.29 0.89 0.62-1.29 0.68 0.48-0.98 0.62 0.40-0.94
Tertiary 0.77 0.61-0.98 0.68 0.47-0.97 0.62 0.47-0.81 0.61 0.48-0.77 0.58 0.47-0.72 0.57 0.42-0.78 0.75 0.54-1.05 0.71 0.43-1.16 0.47 0.30-0.75 0.41 0.25-0.69
Employment (ref: employed)
Unemployed/ non-employed 0.76 0.64-0.91 0.86 0.68-1.08 1.13 0.97-1.32 1.15 0.99-1.34 1.01 0.86-1.19 0.97 0.75-1.25 0.81 0.60-1.08 1.29 0.88-1.90 1.40 0.90-2.19 1.77 1.15-2.72
Monthly household income (ref: 1st quintile) 2nd quintile 0.79 0.63-0.99 0.94 0.74-1.20 0.75 0.62-0.92 1.02 0.85-1.23 0.79 0.66-0.96 0.81 0.60-1.10 0.73 0.50-1.07 0.65 0.41-1.04 0.87 0.56-1.35 0.73 0.40-1.33 3rd quintile 0.67 0.55-0.81 0.7 0.52-0.94 0.92 0.76-1.11 1.04 0.86-1.25 0.84 0.69-1.01 0.65 0.48-0.89 0.70 0.49-1.01 0.47 0.29-0.75 0.95 0.56-1.59 1.23 0.75-2.00 4th quintile 0.69 0.56-0.85 0.78 0.59-1.04 0.82 0.66-1.01 0.95 0.77-1.17 0.84 0.69-1.03 0.73 0.51-1.06 0.64 0.44-0.94 0.35 0.19-0.62 0.57 0.31-1.06 1.02 0.58-1.79 5th quintile 0.58 0.40-0.84 0.75 0.53-1.06 0.9 0.72-1.13 0.86 0.69-1.08 0.74 0.57-0.95 0.80 0.53-1.20 0.52 0.34-0.80 0.42 0.24-0.74 0.72 0.38-1.37 0.77 0.41-1.46
Partnership status (ref: no
partner)
Living with spouse/ partner 0.66 0.56-0.77 0.7 0.58-0.84 0.65 0.57-0.74 0.85 0.74-0.97 0.63 0.55-0.71 0.65 0.51-0.83 0.81 0.63-1.04 0.99 0.71-1.40 0.88 0.64-1.22 0.83 0.58-1.21
Age (ref: 20-29 / BE: 25-29)
30-39 0.42 0.34-0.52 0.41 0.32-0.51 0.6 0.49-0.72 0.58 0.50-0.69 0.70 0.58-0.85 0.61 0.45-0.83 0.58 0.42-0.79 0.56 0.37-0.86 0.75 0.47-1.19 0.64 0.39-1.06
40-49 0.35 0.27-0.45 0.29 0.21-0.41 0.41 0.33-0.51 0.33 0.27-0.40 0.54 0.45-0.65 0.67 0.49-0.93 0.36 0.26-0.51 0.40 0.27-0.61 0.56 0.34-0.92 0.49 0.30-0.81
50-59 0.48 0.37-0.62 0.30 0.21-0.42 0.43 0.35-0.53 0.32 0.25-0.41 0.44 0.36-0.55 0.47 0.31-0.70 0.43 0.28-0.66 0.44 0.27-0.72 0.67 0.39-1.14 0.41 0.24-0.69
60-70 / BE: 60-64 0.81 0.64-1.02 0.54 0.40-0.72 0.52 0.41-0.65 0.41 0.33-0.50 0.59 0.47-0.72 0.90 0.59-1.40 0.44 0.27-0.73 0.50 0.27-0.91 0.72 0.40-1.29 0.29 0.15-0.57
Foreign national 1.66 1.39-1.99 1.76 1.44-2.17 1.75 1.49-2.06 1.58 1.35-1.85 1.5 1.28-1.76 1.48 1.11-1.97 1.34 0.97-1.85 1.47 1.00-2.16 2.17 1.53-3.06 1.47 0.94-2.29 Area of residence (ref: urban)
Rural 1.19 1.03-1.38 1.05 0.87-1.27 1.20 1.04-1.38 1.19 1.04-1.37 1.11 0.96-1.27 1.17 0.91-1.50 1.16 0.89-1.52 1.06 0.75-1.50 0.73 0.50-1.07 0.82 0.56-1.22
Notes: APR = adjusted prevalence ratios. APR are weighted for sampling strategy in the SHIS and BHIS, and also for non-response in the SHIS. Variables used for adjustment: self-rated health, body mass index, doctor visit in the last 12 months, smoking.
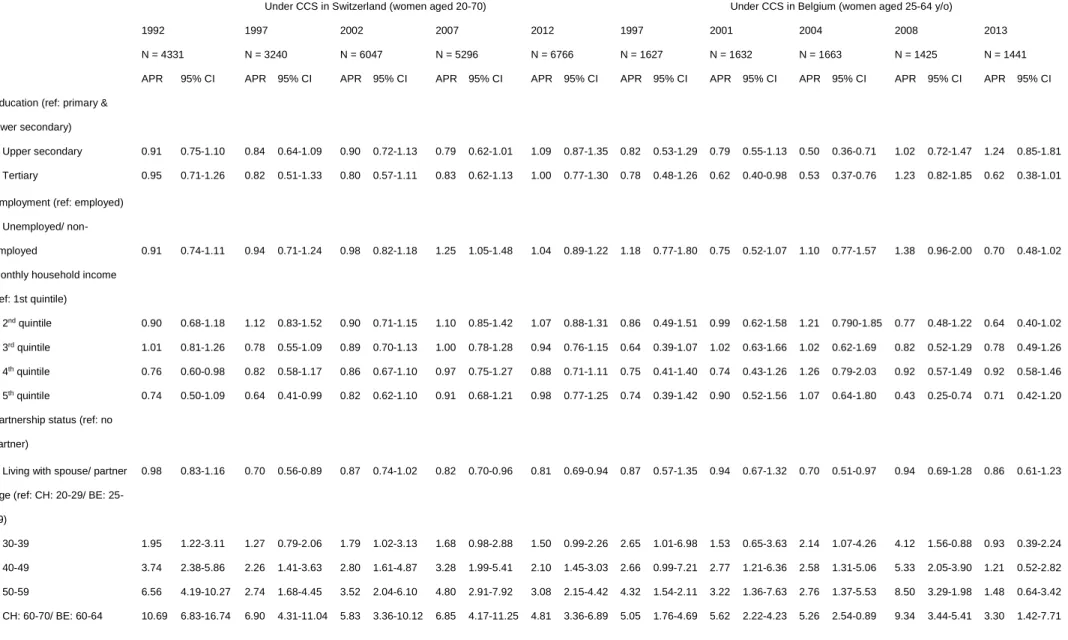
Table S.3b. Adjusted prevalence rations (APR) for under CCS among eligible women in Switzerland and Belgiuma
Under CCS in Switzerland (women aged 20-70) Under CCS in Belgium (women aged 25-64 y/o)
1992 N = 4331 1997 N = 3240 2002 N = 6047 2007 N = 5296 2012 N = 6766 1997 N = 1627 2001 N = 1632 2004 N = 1663 2008 N = 1425 2013 N = 1441
APR 95% CI APR 95% CI APR 95% CI APR 95% CI APR 95% CI APR 95% CI APR 95% CI APR 95% CI APR 95% CI APR 95% CI
Education (ref: primary & lower secondary)
Upper secondary 0.91 0.75-1.10 0.84 0.64-1.09 0.90 0.72-1.13 0.79 0.62-1.01 1.09 0.87-1.35 0.82 0.53-1.29 0.79 0.55-1.13 0.50 0.36-0.71 1.02 0.72-1.47 1.24 0.85-1.81
Tertiary 0.95 0.71-1.26 0.82 0.51-1.33 0.80 0.57-1.11 0.83 0.62-1.13 1.00 0.77-1.30 0.78 0.48-1.26 0.62 0.40-0.98 0.53 0.37-0.76 1.23 0.82-1.85 0.62 0.38-1.01
Employment (ref: employed) Unemployed/
non-employed 0.91 0.74-1.11 0.94 0.71-1.24 0.98 0.82-1.18 1.25 1.05-1.48 1.04 0.89-1.22 1.18 0.77-1.80 0.75 0.52-1.07 1.10 0.77-1.57 1.38 0.96-2.00 0.70 0.48-1.02
Monthly household income (ref: 1st quintile)
2nd quintile 0.90 0.68-1.18 1.12 0.83-1.52 0.90 0.71-1.15 1.10 0.85-1.42 1.07 0.88-1.31 0.86 0.49-1.51 0.99 0.62-1.58 1.21 0.790-1.85 0.77 0.48-1.22 0.64 0.40-1.02
3rd quintile 1.01 0.81-1.26 0.78 0.55-1.09 0.89 0.70-1.13 1.00 0.78-1.28 0.94 0.76-1.15 0.64 0.39-1.07 1.02 0.63-1.66 1.02 0.62-1.69 0.82 0.52-1.29 0.78 0.49-1.26
4th quintile 0.76 0.60-0.98 0.82 0.58-1.17 0.86 0.67-1.10 0.97 0.75-1.27 0.88 0.71-1.11 0.75 0.41-1.40 0.74 0.43-1.26 1.26 0.79-2.03 0.92 0.57-1.49 0.92 0.58-1.46
5th quintile 0.74 0.50-1.09 0.64 0.41-0.99 0.82 0.62-1.10 0.91 0.68-1.21 0.98 0.77-1.25 0.74 0.39-1.42 0.90 0.52-1.56 1.07 0.64-1.80 0.43 0.25-0.74 0.71 0.42-1.20
Partnership status (ref: no partner)
Living with spouse/ partner 0.98 0.83-1.16 0.70 0.56-0.89 0.87 0.74-1.02 0.82 0.70-0.96 0.81 0.69-0.94 0.87 0.57-1.35 0.94 0.67-1.32 0.70 0.51-0.97 0.94 0.69-1.28 0.86 0.61-1.23
Age (ref: CH: 20-29/ BE: 25-29)
30-39 1.95 1.22-3.11 1.27 0.79-2.06 1.79 1.02-3.13 1.68 0.98-2.88 1.50 0.99-2.26 2.65 1.01-6.98 1.53 0.65-3.63 2.14 1.07-4.26 4.12 1.56-0.88 0.93 0.39-2.24
40-49 3.74 2.38-5.86 2.26 1.41-3.63 2.80 1.61-4.87 3.28 1.99-5.41 2.10 1.45-3.03 2.66 0.99-7.21 2.77 1.21-6.36 2.58 1.31-5.06 5.33 2.05-3.90 1.21 0.52-2.82
50-59 6.56 4.19-10.27 2.74 1.68-4.45 3.52 2.04-6.10 4.80 2.91-7.92 3.08 2.15-4.42 4.32 1.54-2.11 3.22 1.36-7.63 2.76 1.37-5.53 8.50 3.29-1.98 1.48 0.64-3.42
Nationality (ref: national citizen)
Foreign national 1.05 0.80-1.37 0.90 0.64-1.27 0.92 0.70-1.23 0.74 0.53-1.04 0.96 0.76-1.22 1.22 0.65-2.27 1.26 0.67-2.39 0.80 0.40-1.60 0.61 0.35-1.07 1.99 1.17-3.38
Area of residence (ref: urban)
Rural 1.30 1.09-1.54 1.05 0.82-1.33 1.22 1.03-1.44 1.21 1.02-1.42 1.18 1.02-1.37 0.74 0.48-1.14 1.10 0.79-1.54 1.19 0.90-1.58 0.99 0.7-1.37 1.13 0.84-1.53
Notes: APR = adjusted prevalence ratios. APR are weighted for sampling strategy in the SHIS and BHIS, and also for non-response in the SHIS. Variables used for adjustment: self-rated health, body mass index, doctor visit in the last 12 months, smoking.