A classification model for non-alcoholic steatohepatitis
(NASH) using confocal Raman micro-spectroscopy
The MIT Faculty has made this article openly available.
Please share
how this access benefits you. Your story matters.
Citation
Yu, Yang, et al. "A Classification Model for Non-Alcoholic
Steatohepatitis (NASH) Using Confocal Raman Micro-Spectroscopy."
25-29 June 2017, Munich, Germany, edited by J. Quincy Brown and
Ton G. van Leeuwen, SPIE, 2017, p. 101. © 2017 OSA-SPIE
As Published
http://dx.doi.org/10.1117/12.2281445
Publisher
SPIE
Version
Final published version
Citable link
http://hdl.handle.net/1721.1/116906
Terms of Use
Article is made available in accordance with the publisher's
policy and may be subject to US copyright law. Please refer to the
publisher's site for terms of use.
PROCEEDINGS OF SPIE
SPIEDigitalLibrary.org/conference-proceedings-of-spie
A classification model for
non-alcoholic steatohepatitis (NASH)
using confocal Raman
micro-spectroscopy
Jie Yan, Yang Yu, Jeon Woong Kang, Zhi Yang Tam,
Shuoyu Xu, et al.
Jie Yan, Yang Yu, Jeon Woong Kang, Zhi Yang Tam, Shuoyu Xu, Eliza Li
Shan Fong, Surya Pratap Singh, Ziwei Song, Lisa Tucker Kellogg, Peter
So, Hanry Yu, "A classification model for non-alcoholic steatohepatitis
(NASH) using confocal Raman micro-spectroscopy," Proc. SPIE 10411,
Clinical and Preclinical Optical Diagnostics, 104110Y (28 July 2017); doi:
10.1117/12.2281445
A Classification Model for Non-alcoholic Steatohepatitis
(NASH) Using Confocal Raman Micro-spectroscopy
Jie Yan
1, a, Yang Yu
1, 2, 3, a, Jeon Woong Kang
4, a, Zhi Yang Tam
3, Shuoyu Xu
5, Eliza Li Shan Fong
2, Surya
Pratap Singh
4, Ziwei Song
1, 2, Lisa Tucker Kellogg
3,6, Peter So
3,7,8, Hanry Yu
1, 2, 3, 9, *1Institute of Bioengineering and Nanotechnology, Agency for Science, Technology and Research (A*STAR), Singapore 138669 2Department of Physiology, Yong Loo Lin School of Medicine, National University of Singapore, Singapore 117597
3BioSyM, Singapore-MIT Alliance for Research and Technology, Singapore 138602
4Laser Biomedical Research Center, George R. Harrison Spectroscopy Laboratory, Massachusetts Institute of Technology, Cambridge, MA
02139 USA
5InvitroCue Pte Ltd, Singapore 138667
6Duke-NUS Graduate Medical School Singapore, National University of Singapore, Singapore 169857 7Department of Mechanical Engineering, Massachusetts Institute of Technology, Cambridge, MA 02139 USA
8Department of Biological Engineering, Massachusetts Institute of Technology, Cambridge, MA 02139 USA 9Mechanobiology Institute, National University of Singapore, Singapore 117411
a Co-first authors
* Corresponding author: Hanry Yu ([email protected]) Block MD 9, 2 Medical Drive,
National University of Singapore, Singapore 117597 Tel. No. + 65 65163466, Fax No. +65 68748261
Abstract: We combined Raman micro-spectroscopy and machine learning techniques to develop
a classification model based on a well-established non-alcoholic steatohepatitis (NASH) mouse
model, using spectrum pre-processing, biochemical component analysis (BCA) and logistic
regression.
OCIS codes: (170.6510) General; Paper No.: 10413-1;
Background: Clinically, the histopathological evaluation of liver biopsies is currently the gold standard for
non-alcoholic steatohepatitis (NASH) diagnosis [1]. However, significant variation exists amongst pathologists in the
definition of NASH and an unequivocal agreement has not been reached. In sum, whether for diagnosing NASH or
for NAFLD staging, the traditional histological approach is fundamentally semi-quantitative, observer-dependent,
and includes only a very limited set of pathological features [2]. Besides being a label-free approach that enables
multiplexing, Raman micro-spectroscopy provides a biochemical map of the tissue of interest that potentially
enables the identification of spatial-temporal changes in tissue composition [3]. Thus, to address the disease
progression and spatiotemporal information, we have created a fully quantitative and objective approach to NASH
detection.
Methods: We combined spontaneous Raman micro-spectroscopy and machine learning techniques to identify
spectral signatures that are specific to NASH from the liver tissue provided by 42 STAM
TMmice that were
administrated with Streptozotocin (STZ), fed with high fat diet and sacrificed at 6 time points, by using spectrum
pre-processing, biochemical component analysis (BCA) and logistic regression.
Clinical and Preclinical Optical Diagnostics, edited by J. Quincy Brown, Ton G. van Leeuwen, Proc. of SPIE-OSA Vol. 10411, 104110Y · © 2017 OSA-SPIE
CCC code: 1605-7422/17/$18 · doi: 10.1117/12.2281445 Proc. of SPIE-OSA Vol. 10411 104110Y-1
A 4w 5w 6w 7w 9w 12w 16w B Pregnant C57BL/61 mice 1. hit (Chemical) Low dose streptozotocin
-r 2 "d hit (Diet)
High fat diet feeding
-Fatty Liver evident
NASH evident Fibrosis evident HCC evident 785nm I > ( LLD ) DM spectrograph
Fig. 1. A) Figure illustration of STAM mice model. The model was created by using both the effect of chemical toxic STZ (0 week) and high fat dietary (4 weeks) on non-genetic C57BL/6 mice with measurements conducted on the 5 different time points. A total of 42 cryo-preserved tissues were harvested from the mice. B) Schematic illustration of Raman micro-spectroscope set-up. Excitation laser was a continuous wave (CW) tunable Ti: Sapphire laser (wavelength set at 785nm) with a frequency-doubles Nd: YAG laser (wavelength set at 532nm) used as the pump source. The collimated beam passed through a bandpass filter (BP LL01-785-12.5, Semrock), a dichroic mirror (DM LPD01-785RU-25, Semrock), an objective lens (60X, NA=1.2), the dual-axis galvanometer mirrors and adjusted by a telescope before being focused on the tissue specimen. The inelastic scattering Raman signal was then delivered to the spectrograph by using the Raman grating which has the spectra shift coverage of -34 to 1894 cm-1 and the spectra resolution of 2.0 cm-1/pixel. Spectra are captured by a liquid Nitrogen cooled charge-coupled device
(CCD) and the bright field images were captured using an intensity controlled white light-emitting diode (LED) and the complementary metal-oxide semiconductor (CMOS) camera.
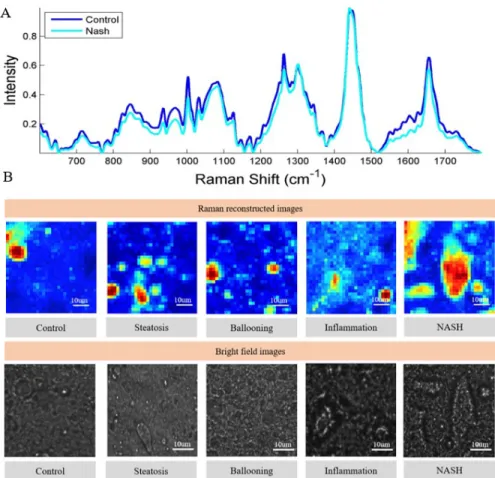
Results: We showed that Raman micro-spectroscopy can detect macro-steatosis with variation in both its size
and distribution, as a characteristic feature of NASH. Raman reconstructed images were also able to reveal the
spatiotemporal information during the disease progression. By employing a selected pool of biochemical
components to represent the liver constituents, we also identified biochemical changes specific to NASH and show
that the classification model is capable of accurately detecting NASH (Area Under Curve (AUC) = 0.87) in mice.
A
08-Control Nash 02 t,nr 700 800 900 1000 1100 1200 1300 1400B
Raman Shift
(cm-1)
1500 1600 1700Ramait reconstructed images
Cbntrol St cato s is Ballooning Inflammation NASI I
1.
Bright field imagesBallooning Inflatmnation NASH
Basic Chemicals A (7). (6) (r 4 3) C 700 800 800 1000 1100 1200 1300 1400 Raman Shift (cm') 1500 1800 1700 D 0.8 A.0.8 Ñ ÿ0.4 C 0 B 3- Nitro -L- Tyrosine Arachidic Acid L- glutathione reduced Linoleic Acid L- Phenylalanine Retinyl Acetate Actin Collagen Type DNA
AIM
700 800 900 1000 1100 1200 1300 1400 1500 1600 1700 Raman Shift (cri-1)Fig. 2. A) The averaged Raman spectrum of control and Non-alcoholic steatohepatitis (NASH) groups across 871 Raman shifts. B) Raman reconstructed image using the intensity at the Raman shift of 1655 cm-1 and respective bright field image from representative control, steatosis,
ballooning, inflammation and NASH group to reveal the spatiotemporal information.
Fig. 3. A) The Raman spectra of the selected nine compounds selected for the Raman signal decomposition. B) The name of the nine compounds. C) and D) The spectrum fitting result of the control and Non-alcoholic steatohepatitis (NASH) groups. The blue line represents the
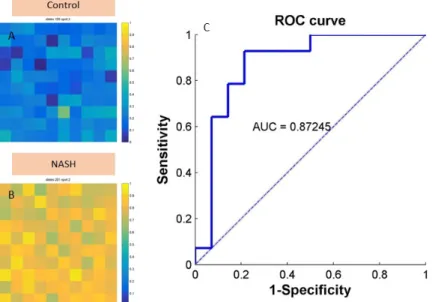
NASH 0.8 0.2
ROC curve
AUC = 0.87245 ' 0.2 0.4 0.6 0.81- Specificity
original spectrum and the green one represents the reconstructed spectrum using the nine selected compounds after spectrum decomposition while the red line gives the residual.
Fig. 4. A) and B) The diagnostic plot for a true negative and true positive sample where the pixels’ intensity represents the probability of being diagnosed as normal or NASH. C) The receiver operating characteristics curve (ROC) analysis of the classification model.
Conclusion: In this study, we demonstrate that Raman micro-spectroscopy can similarly be used for the detection
of NAFLD/NASH through quantification of the biochemical and biological changes at the cell and tissue level with
spatiotemporal resolution. The unique biochemical fingerprint generated in this study may serve as a useful criterion
to be leveraged for further validation in clinical samples.
References
1. Takahashi, Y. and T. Fukusato, Histopathology of nonalcoholic fatty liver disease/nonalcoholic steatohepatitis. World Journal of Gastroenterology : WJG, 2014. 20(42): p. 15539-15548.
2. Brunt, E.M. and D.G. Tiniakos, Histopathology of nonalcoholic fatty liver disease. World Journal of Gastroenterology : WJG, 2010.
16(42): p. 5286-5296.