Children as Data Scientists:
Explorations in Creating, Thinking, and Learning with Data
by
Sayamindu Dasgupta
B.Tech. West Bengal University of Technology (2008)
S.M. Massachusetts Institute of Technology (2012)
Submitted to the Program in Media Arts and Sciences, School of Architecture and Planning,
in partial fulfillment of the requirements for the degree of Doctor of Philosophy in Media Arts and Sciences
at the
MASSACHUSETTS INSTITUTE OF TECHNOLOGY September 2016
0 Massachusetts Institute of Technology 2016. All rights reserved.
MASS95 HgSINfi-TUTE 0 gCNOLGL7
DEC 12 201 6
LIBRARIES
ARCHIVES
Author Certified by.Signature redacted
61Program in Media Arts and Sciences August 18, 2016
_Signature redacted
Mitchel Resnick
LEGO Papert Professor of Learning Research
Program in Media Arts and Sciences Thesis Supervisor
Signature redacted
er P7tricia Maes
Alex W. Dreyfoos Professor of Media Technology Academic Head, Program in Media Arts and Sciences Accepted by
Children as Data Scientists:
Explorations in Creating, Thinking, and Learning with Data
by
Sayamindu Dasgupta
Submitted to the Program in Media Arts and Sciences, School of Architecture and Planning,
on August 18, 2016, in partial fulfillment of the requirements for the degree of
Doctor of Philosophy in Media Arts and Sciences
Abstract
Data is a powerful lens for learning about the world. Driven by advances in computational technologies and methods that make it easier to collect, store, and analyze vast amounts of data about our world, data science has emerged as a new discipline with immense
pos-sibilities for discovery and learning. However, these pospos-sibilities are primarily accessible for adult experts - in this thesis, I examine pathways to support children as data scientists. In the first part of this thesis, I study children's use of variables and lists in the Scratch pro-gramming environment. I quantitatively study the ways in which children use variables
and lists in Scratch (e.g., to keep score in games), as well as factors that foster this en-gagement. I find support for the theory that children learn to use data-structures through remixing their peers' works, as well through looking at source code of projects created
by their peers. I also find evidence to suggest that providing more powerful uses of
data-structures (such as data-persistence) leads to children using more data data-structures overall. In the second part of the thesis, I introduce a new system, Scratch Community Blocks, that enables children to create projects that access and analyze data from the Scratch online community (e.g., creating visualizations that show which programming blocks they used in their projects or analyzing trends in the popularity of their projects within the community). Through artifact-based case studies, interviews, and survey responses collected from a group of children using the system, I show how children use data and programming to answer their own questions about learning and social behaviour within the Scratch
community. I find that children use Scratch Community Blocks not only to create with data through stories and games, but also to think with data by engaging in self-reflection about
their own learning and social participation, and through critical conversations about the role of data within the culture of the Scratch community.
Thesis Supervisor: Mitchel Resnick
Children as Data Scientists:
Explorations in Creating, Thinking, and Learning with Data
by
Sayamindu Dasgupta
The following people served as readers for this thesis:
A
Thss e
_e-Signature
redacted
Harold Abelson Class of 1922 Professor of Computer Science and Engineering Department of Electrical Engineering and Computer Science Massachusetts Institute of Technology
Signature redacted
- ' \
Thesis Reader
Benjamin Mako Hill Assistant Professor Department of Communication University of Washington
Acknowledgements
This thesis is a result of many conversations and collaborations, and I would like to thank the people who helped me shape my nebulous ideas from six-years ago into something that became a PhD dissertation.
First, I would like to thank Mitch Resnick, my advisor. Mitch has been the most wise and wonderful guide I could have ever asked for - always supportive, always patient, and always kind.
Hal Abelson taught me how to identify, focus on, and bring out the essence of a given topic, and I am deeply grateful to him for his support and intellectual generosity. Benjamin Mako Hill helped me construct my identity as a researcher, and I thank him for creating some of the most wonderful and fruitful learning opportunities for me during my tenure as a graduate student. This thesis is about constructionist learning - and I am glad to report, that this thesis is also a product of constructionist learning.
Deb Roy and Ethan Zuckerman, my PhD general examination committee members, helped me expand the boundaries of my knowledge, and engage with the larger picture. With each and every step in my intellectual journey, I find uses for what they helped me learn. When I got admitted to the Media Lab, a member of the lab with whom I had worked before told me about someone named Brian Silverman, and advised that I should spend as much time as possible with Brian. That was one of the most valuable pieces of advice that
I have ever received. Brian has been a mentor and a friend who pushed me, challenged
me, and supported me to think in powerful ways.
Natalie Rusk has been a source of ideas, advice, and support. In my design and thinking,
I tend to agonize over small details that not many others seem to care about. Thank you
Natalie, for caring and co-agonizing with me, and for being ever-enthusiastic.
During the final year of the PhD program, Benjamin Berg and Samantha Hautea have not only been collaborators on specific projects, but also deeply thoughtful sources of feedback for my broader research. Many thanks to them.
Lifelong Kindergarten has been one of the most caring communities that I have been a part of. Ricarose Roque has been a constant source of support and encouragement for the last six years. I am glad that we went through this together. John Maloney and Amos Blanton, with their kindness and humility, helped me gain confidence to become a productive member of the community. Andres Monroy-Hernandez, Jay Silver, Karen Brennan, Eric Rosenbaum, Tiffany Tseng, Abdulrahman idlbi, Champika Fernando, David Mellis, Jennifer Jacobs, Alisha Panjwani, Shristi Sethi, and Juliana Nazare have all contributed to this work through conversations and discussions. Members of the Scratch Team, especially Carmelo
Presicce, Moran Tsur, and Julia Zimmerman have been immensely helpful by providing feedback, participating in beta-tests, and helping run workshops. Andrew Sliwinski, Colby Gutierrez-Kraybill, and Matthew Taylor solved any technical problems that I faced as I deployed the Scratch Community Blocks system. Stephanie Gayle and Abisola Okuk took care of any logistical requirements that I had, sometimes even before I asked them for help.
Beyond Lifelong Kindergarten, as I worked on my dissertation, I found wonderful friends, supporters, and collaborators in many, including J. Nathan Matias, Jude Mwenda, Karthik Dinakar, Harshit Agarwal, Pragun Goyal, Rajibul Islam, and Alec Resnick. Sayan Chakraborti, one of my closest childhood friends from Kolkata, magically turned up and lived in Cam-bridge for three out of the six years I have been here, and I am grateful to have had him around.
This work would not have existed without the children in the Scratch community - their creative spirit and energy kept me happy, and I am grateful for their time and enthusiasm. Family members, despite being half-way across the world, have been a constant source
of support and encouragement. My mother has been my inspiration, and I find myself in this place primarily because she never lost faith in me, and always encouraged me to seek
out and pursue ventures that I love and care about.
And finally, to Sucheta - thank you for all the proof-reading, for assuring me on many occasions that all of this makes sense, and for reinforcing my belief in the potential of children to transform their own lives through creativity, love, and play.
This thesis is based upon work supported by the National Science Foun-dation under grants 1027848, 1417663, and 1417952. Any opinions, find-ings, and conclusions or recommendations expressed in this material are those of the author and do not necessarily reflect the views of the National Science Foundation.
Contents
Abstract
1 Introduction
1.1 Epistemological background and empirical setting 1.2 Structure of this thesis . . . .
1.3 Related w ork . . . . 1.4 Contributions of this thesis . . . .
1.5 A note about collaborative work . . . .
2 Data Science
2.1 The three pillars of data science . . . . 2.2 Analyzing approaches to introduce data science . . .
2.3 Unpacking the foundational areas . . . .
2.3.1 Topics areas within Computer Science . . . . 2.3.2 Topic areas within Statistics and Mathematics
2.3.3 Topic areas in Social Sciences and Humanities 2.3.4 Substantive knowledge . . . . 2.4 Data science in this thesis . . . .
3 Uses of data within Scratch
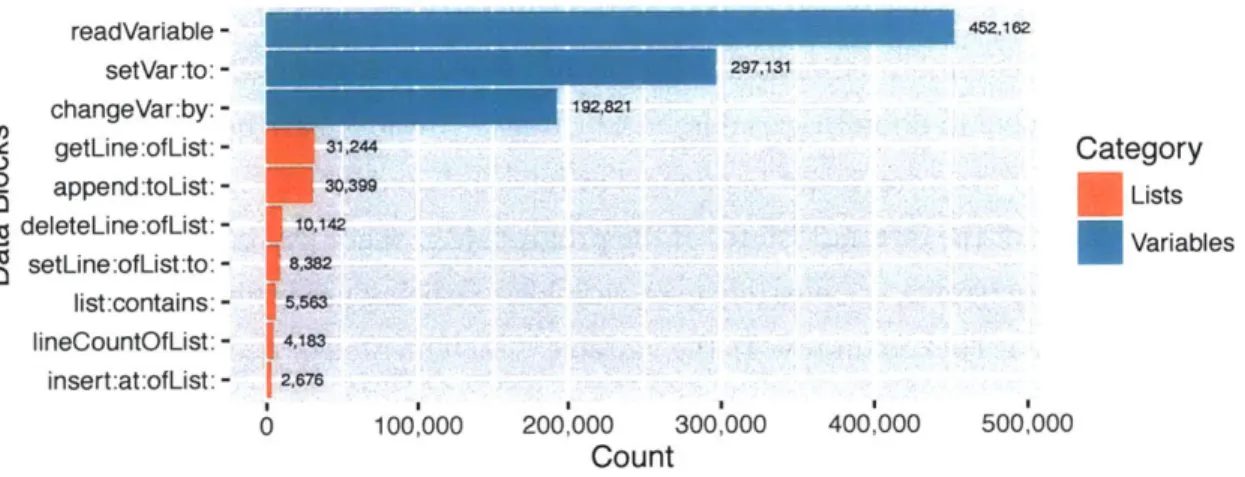
3.1 Data blocks within Scratch . . . .
3.1.1 Data about Scratch data . . . .
3.1.2 Who uses data blocks . . . .
3.1.3 How data blocks are used . . . .
3.2 Shared and online data in Scratch . . . .
3.2.1 NetScratch . . . .
3.2.2 Scratch Cloud data . . . .
3.2.3 The Scratch extension system . . . .
3.3 Sum m ary . . . . 3 19 22 25 26 28 30 31 . . . . 3 1 . . . . 34 . . . . 3 6 . . . . 3 6 . . . . 3 9 . . . . 4 1 . . . . 42 . . . . 42 45 . . . . 46 . . . . 47 . . . . 47 . . . . 48 . . . . 5 2 . . . . 5 2 . . . . 5 3 . . . . 5 6 . . . . 5 7
4 Fostering uses of data within Scratch
4.1 Appropriation in Scratch . . . ..
59
4.2 Study la: Remixing and use of data blocks . . . 4.2.1 Data and measures . . . . 4.2.2 Analysis . . . . 4.2.3 Results . . . . 4.3 Study ib: Remixing and use of data-patterns . . 4.3.1 Data and measures . . . . 4.3.2 Analysis . . . . 4.3.3 Results . . . . 4.4 Study lc: See-insides and use of data blocks . . 4.4.1 Data and measures . . . . 4.4.2 Analysis . . . . 4.4.3 Results . . . . 4.5 Study 2: Use of Cloud data and the general use o
4.5.1 Methodology . . . . 4.5.2 D ata . . . . 4.5.3 Analysis and results . . . . 4.5.4 Robustness checks . . . . 4.6 Discussion . . . . 4.6.1 Threats to validity . . . . 4.6.2 Adoption of Cloud Data . . . . 4.7 Summary of the findings . . . .
5 Scratch Community Blocks
5.1 Children as data scientists . . . .
5.1.1 New pathways to learning data science .
. . . . 60 . . . . 61 . . . . 63 . . . . 64 . . . . 66 . . . . 67 . . . . 69 . . . . 70 . . . . 7 1 . . . . 72 . . . . 73 . . . . f data structures 5.1.2 Reflection with data on learning and social participatio 5.2 D esign . . . . 5.3 Illustrative Examples . . . . 5.3.1 Sample 1: Filtering one's followers . . . . 5.3.2 Sample 2: Finding projects that produce sound . . . . 5.3.3 Sample 3: A project "recommender" system . . . . 5.3.4 Sample 4: Reimplementing an existing evaluation tool 5.3.5 Sample 5: Visualization of learning trajectories . . . . 5.4 Implementation . . . . 5.5 Limitations . . . . 5.5.1 Context-sensitive accessor blocks . . . . 5.5.2 Scaling visualizations . . . . 5.5.3 Expectations for real-time data . . . . 5.6 Summary . . . . 6 Studies with children 6.1 The empirical setting . . . . 73 75 77 79 80 84 88 88 90 92 95 95 96 97 n . . . . 98 . . . 102 . . . 102 . . . 103 . . . 103 . . . 103 . . . 105 . . . 105 . . . 107 . . . 107 ... .... . ... 111 . . . 112 . . . 112 115 . . . 115 12 . . . .
6.2 Creating with data . . . 118
6.2.1 Data stories . . . 119
6.2.2 Data games . . . 126
6.3 Thinking with data . . . 129
6.3.1 Data criticism . . . 130
6.3.2 Self-reflections with data . . . 135
6.4 Summary . . . 136
7 Conclusion 137 7.1 Summary and contributions . . . 137
7.2 Future directions. . . . 139
7.2.1 Evolution of norms around privacy and algorithmic bias . . . 139
7.2.2 Studying how analyses and visualizations are interpreted . . . 139
7.2.3 Learning with data from other sources . . . 140
7.2.4 Inferential statistics . . . 140
7.2.5 Educators . . . 141
Afterword: So, what does Dataland look like? 143 Connections to Scratch culture and beyond . . . 143
Social and cultural syntonicity . . . 144
A culture of stories and games . . . 145
An expanded meaning of sharing in a sharing culture . . . 146
Microworlds for Powerful Ideas . . . 147
Towards computational values . . . 148
A microworld for powerful social ideas . . . 150
The power of constructing stories . . . 151
Epilogue . . . 153
A Participant Survey 155
B Interview Protocol 157
List of Figures
1-1 The Scratch programming language . . . 23
1-2 Scratch online community, front page. (Retrieved: May 2016) . . . 24
1-3 Extended model of self-reflecting with data. . . . 29
2-1 Worldwide interest in the search term "data science" . . . 32
2-2 Data science Venn diagram . . . 33
3-1 Creating and programming with variables and lists in Scratch. . . . 46
3-2 Top 100 common variable and list names, for all de novo projects (shared at least once) between July 2014 and June 2015 . . . 48
3-3 Relative frequencies of data blocks for every de novo project between July 2014 and June 2015 that was shared at least once. . . . 49
3-4 Features introduced by NetScratch . . . 52
3-5 Scratch Cloud data . . . 53
3-6 Design space of persistent variables in Scratch - showing the position of standard Scratch variables, shariables, and Cloud variables . . . 54
3-7 Examples of Scratch projects created with Cloud data. . . . 55
3-8 Top 100 common cloud variable names, for all de novo projects (shared at least once) between July 2014 and June 2015. . . . 56
3-9 Developing a Scratch extension . . . 57
4-1 Remixing a "Pong" game in Scratch. . . . 60
4-2 Plots of model-derived estimates of the proportion of users who have used data blocks for prototypical Scratch users. Estimates are shown for two prototypical users: (a) a user who has never shared a remix that uses a data block, and (b) a user has shared three such projects. All other variables are held at their sample median. . . . 66
4-3 Common Scratch code script/pattern that contain data blocks. I hypothe-size that a Scratch user who remixes a project with one of these patterns is more likely to use this pattern later on in a de novo project. . . . 68
4-4 Plots of model-derived estimates of the proportion of users who have used data-block patterns for prototypical Scratch users. Estimates are shown for two prototypical users: (a) a user who has never shared a remix that uses a data-block pattern, and (b) a user has shared three such projects.
All other variables are held at their sample median.. . . . 71
4-5 The project page in the Scratch website (with the see-inside button high-lighted in red). . . . 72 4-6 Plots of model-derived estimates of the proportion of users who have used
data blocks for prototypical Scratch users. Estimates are shown for two prototypical users: (a) a user who has never views the source code of a project that uses a data block, and (b) a user has viewed the source code
of three such projects. All other variables are held at their sample median. 75
4-7 Graphical analysis of discontinuity point. Observations are binned per week and averaged (standard errors are shown). Vertical blue line marks cutoff point. . . . 80 4-8 Graphical analysis of number of observations per week from the time the
first member of the cohort became active. The number of observations per week is plotted against the week offset. Vertical blue line marks cutoff point. 85 4-9 Graphical analysis of placebo test with a "fake" cutoff (marked by vertical
blue line) at the median of the forcing variable. The range of the data represents the period before the actual cutoff. . . . 86 4-10 Graphical analysis of placebo test with a "fake" cutoff (marked by blue line)
at the median of the forcing variable. The range of the data represents the period after the actual cutoff. . . . 87 4-11 Graphical analysis of placebo test with a covariate other than the actual
dependent variable. Average values of number of times projects have been remixed is binned by week. Vertical blue line marks cutoff point. . . . 88 4-12 Plot of the estimate for Is Scratcher? across a range of bandwidths,
show-ing that the estimate remains positive, statistically significant, and reason-ably consistent throughout most of the range. . . . 89 4-13 Percentage of users who have used Cloud data in de novo projects - the
cutoff date is represented by the blue line, and the shaded area shows the analysis period (18 days). . . . . 91 5-1 Full palette of programming blocks made available through the Scratch
Community Blocks system. . . . 98
5-2 Accessor method block for Scratch sprites, with a dropdown to select the appropriate property. . . . 99
5-3 Data access blocks from an early prototype of the system . . . 99 5-4 Block representing query to return projects shared by a user (from an early
prototype). . . . 100
5-5 Fragment of the Scratch website user-profile page and the corresponding Scratch code snippet showing the block to loop over all shared projects by a user, along with the context-sensitive accessor block to fetch the title of
the project within the loop. . . . 100
5-6 Filter followers by country. . . . 102
5-7 Filter projects by use of of blocks from the "Sound" category. . . . 103
5-8 Script to find curated projects that use blocks from the Sound category. . . 103
5-9 A simplified version of Scratch Community Blocks code that can be used to reimplement a subset of DrScratch functionality. . . . 104
5-10 Visualizing learning trajectories of Scratch users . . . 105
5-11 System diagram for Scratch Community Blocks . . . 106
5-12 Part of a script from a user-created project that illustrates how the context sensitive accessor block is incorrectly used. . . . 108
5-13 Design interventions to address the out-of-context block usage. . . . 110
5-14 Example projects and code showing misconceptions and difficulties in us-ing Scratch Community Blocks. . . . 112
6-1 Self-reported age distribution of the 2,500 beta testers of Scratch Commu-nity Blocks . . . 116
6-2 Proportion of blocks from Scratch Community Blocks in projects created by the beta testers . . . 117
6-3 Results from survey of users of Scratch Community Blocks . . . 118
6-4 Doughnut chart. . . . 120
6-5 Non-canonical visualization projects. . . . 120
6-6 Pixel bugs. . . . 121
6-7 The "psychic" soda can. . . . 122
6-8 Calculating the percentage of projects contributed by a user and their fol-low ers. . . . 123
6-9 How talkative are you? . . . 125
6-10 Code to store and analyze data from multiple user trajectories using per-sistent Cloud Variables . . . 125
6-11 Games that incorporate social and code metadata into their mechanisms. . 126 6-12 Data-driven dress-up. . . . 128
6-13 "Scores" . . . . 128
6-14 Models for determining prominence/score of Scratch users. . . . 129
6-15 Conditional that would be TRUE only for followers of the creator of the project. . . . ... . . . 129
Chapter 1
Introduction
"Here you might object that we happened to take our examinations in particularly bad schools. Also, that whatever reports we receive from elsewhere all happen to be sad. You can say that you know a lot of other examples, as true as ours, but leading to the opposite conclusions.
So, let us drop all of us, a position that has become too emotional and let us stand on scientific ground.
Let us start all over, this time with numbers."
- Letter to a Teacher by the Schoolboys of Barbiana, 1970 [1]
This is how a group of Italian school children, aged thirteen to sixteen, preface the 'statis-tics' section of their argument showing how the then contemporary Italian school system was failing its most vulnerable students. Students from lesser socio-economic backgrounds, these children showed through painstakingly gathered data, were more likely to drop out after being unsuccessful in examinations. School, in its then current form, they argued, was "war against the poor". The effort that these children went into to compile, process, analyze, and visualize this data was nothing short of remarkable. They knew that to bol-ster their argument, they needed to go beyond anecdotal evidence - they needed data from the entire education system in Italy. In their own words, this work involved "scores of statistical compendia, scores of visits to schools or inquiries by letter, and trips to the Ministry of Education and to ISTAT (Central Institute of Statistics) to gather further data,
CHAPTER 1. INTRODUCTION
and whole days spent at the calculating machine." Not only did they use visualizations to support their argument - at the end of their book, they provided all the data tables that they used for their work, along with descriptions of the methods that they used to arrive at their visualizations and analysis results.
More than forty-five years after the publication of this book, we are starting to enter a world where citizen data-science projects like this are becoming more possible, if not more common. In 2011, after the earthquake and resultant tsunami in Japan[2], a band of volunteers quickly started a collaborative effort called Safecast' to create and disseminate data about the amount of radiation spread throughout the affected regions. In India, a group of volunteers built a crowdsourcing website2 to gather data about the extent of power outages (called 'powercuts' locally) throughout the country. These volunteers built a variety of tools (e.g. smartphone apps) and methods (e.g. text messaging system) for anyone to report power outages in his or her locality. This data is then visualized centrally on a map on the project website - anyone who accesses the website can instantly get a sense about which parts of the country are worst affected by power outages.
Grounds-up effort like Safecast and Powercuts.in are being complemented by governments and corporations providing access to large sources of data. The schoolboys of Barbiana had to physically visit the Ministry of Education and the Central Institute of Statistics multiple times to get the data necessary for their work. Today, at least a part of this data would be available online, through open data initiative run by the government, and in some cases, by non-profit agencies and foundations. In 2010, Google, whose stated mission is to "organize the world's information and make it universally accessible and useful" released an online tool called Ngrams.3 Ngrams enable visualization of the relative frequencies of text sequences from books published between 1500 and 2008. In 2011, a publication in Science [3] described how the dataset and the tool can be used to observe and uncover cultural trends. For example, using the tool, one can observe instances of historical censorship in a given language or locale - the authors of the paper found a very visible dip in the frequency of mentions of the Jewish artist Marc Chagall in German texts published between 1936-1944, signalling self or imposed censorship during the Nazi regime.
1 http://blog.safecast.org/about/ 2 http://powercuts.in
3 https://books.google.com/ngrams
CHAPTER 1. INTRODUCTION
All the examples above point to a fundamental shift in how data is accessed and produced.
Not only is more data than ever before about all sorts of topics now accessible by a general audience, but also there has been a corresponding increase in data being produced, often collaboratively, by the general public. This is good news, as data can be a powerful lens to understand the world, and in some cases, as the schoolboys of Barbiana show, a way to ad-vocate for positive societal change. However, to enable everyone to understand their world with data, more needs to be done. What we have seen so far has been largely restricted to instances of easier access to data sets, and of large-scale collaborative production of data (e.g. Safecast, Powercuts.in). Less common are instances of data being analysed by a general audience - even for the small number of instances that do allow members of the general public to perform data analysis, the methods of analysis remain pre-determined (e.g. for Google Ngrams, one can only access frequency charts). Though these restricted methods can be very powerful and useful, ultimately they are limited to the possibilities envisioned by the designer of the system in question. It is important that we consider approaches that enable everyone to design and build their own systems to analyse, visualize,
andfinally, learn with data - this is the broad topic of this thesis.
The increasing democratization of data access and production has been largely driven
by a parallel emergence and evolution of computational methods to store, transmit, and
process vast amounts of data. As data enables us to understand and interpret the world around us, computation helps us in this sense-making process. The emergent discipline around computationally-aided collection and sense-making with data is often labeled as data science. Data scientists combine computation and data to create representations and models that allow us to better understand the world. As computational power and storage capacities grow by leaps and bounds, our data representations and data models become more sophisticated, and in many cases, more accurate4.
A relevant question in this context is - how do we enable the next generation of young people get started in learning with data? Are there compelling and engaging ways in which young learners can see themselves as data scientists, understanding and learning about their own worlds through the lens of data? If such pathways to data science exist, can they also make young learners aware of the potential pitfalls and biases that data scientists ' It will be worthwhile, in this context, to point readers to Borges's On Exactitude in Science [4], where
a to-scale map of a province was created as a model for analysis, only to be abandoned by future generations, who found its use too cumbersome.
CHAPTER 1. INTRODUCTION
need to remain cognizant of? This thesis aims to be the first step towards answering these questions.
1.1
Epistemological background and empirical setting
The epistemological roots of the proposed work are grounded in Jean Piaget's theory of Constructivism [5], and Seymour Papert's framework of Constructionist learning [6]. Pi-aget theorized that children learn about and understand their world by constructing their own personal theories of how the world works, rather than through "transmission" of knowledge from an educator to a learner. As learners come across new pieces of infor-mation or knowledge, they either assimilate these into their theories, or in some cases,
accommodate their theories to account for the new information. Papert built on
Construc-tivist theory by arguing that this personal theory building process is even more effective if the learners are actively engaging in constructing not just theories in their minds, but also objects that can be used to think with.
Recognizing the power of the computer as the universal machine (the "Proteus of ma-chines" [7]), Papert and his colleagues came up with LOGO [8], a language designed to enable children to program computers. Children programmed in LOGO not necessarily for learning how to program (though that was a useful side-effect), but to create systems that simulated objects and phenomena from different areas of human knowledge. In his work, Papert highlighted the power of ideas - in his pedagogy of "powerful ideas", he encouraged
educators and learners "to understand, to love, and to use ideas" [9] that would empower learners. Digital technology, Papert argued, enabled young learners to explore previously inaccessible powerful ideas; programmablity allowed computers to become mediators and "transitional objects" between these ideas and learners. Later on, collaborators of Papert also demonstrated that digital technology not only made powerful ideas accessible, but also made it possible to present different representations of powerful ideas to learners. For example, LOGO-mediated explorations of geometry was through "turtle-geometry", which is different from the traditional representation of geometry (vector geometry); it was argued that this plural representation not only makes the ideas accessible to learners with different styles and ways of thinking, but also makes the learning experience richer through comparing and contrasting the different representations. In Turtle Geometry: The
Computer as a Medium for Exploring Mathematics [10], Abelson and diSessa stated:
6
CHAPTER 1. INTRODUCTION
"Turtle geometry and vector geometry are two different representations for geometric phenomena, and whenever we have two different representations of the same thing, we can learn a great deal by comparing representations and translating descriptions from one representation into the other. Shifting descriptions back and forth between representations can often lead to insights that are not inherent in either of the representations alone."
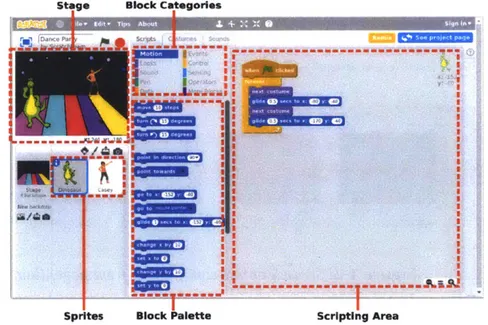
The spirit of LOGO lives on in Scratch [11], a block-based visual language designed for children (figure 1-1). Over the last nine years, Scratch has been incredibly successful in being able to engage millions of young learners from all over the world in creative expression and exploration of ideas through programming.
Stage Block Categories
--- -- -- -- --
--I.
0
(a) Scratch code to make a graphical character (called
a sprite) on the screen move back and forth.
Sprites (b)
Block Palette Scripting Area
The Scratch programming language editor.
Figure 1-1: The Scratch programming language.
This broad reach has been driven in part by the Scratch online community [12], where Scratch users can share their work with each other, build on one anothers' works, and also, interact with one another through comments and forum-posts (figure 1-2). Apart from adding a social element to the act of expression and exploration, the Scratch online community also acts as a source of inspiration - projects by their peers act as models and inspirations for young Scratchers as they engage in creating projects of their own. While criticizing the way programming is taught traditionally through rules of syntax and
k7 -7
7.7-I
CHAPTER 1. INTRODUCTION
grammar, Marvin Minsky pointed out that "[no] one ever learns a language from being told its grammar rules [, and we] always start with stories about things that interest us" [13]. The Scratch online community, for many Scratch users, is a library of Scratch literature
and serves as source of inspiration and project-ideas.
Ureate stones, Qames. and arirnaJor
JOIN E XAMPLES
A creative learning community with 14,893,916 projects shared
A i. S S RAT 0 [. f1hIDUGA!Oi '-OR PARNTS
Featured Projects
AnIrbaion
by Za'k 02
arn to Touchtype!
by hermionapnorO4
Figure 1-2: Scratch online community, front page. (Retrieved: May 2016)
A few years ago, an 11-year old Scratch user wrote on a public blog:
"I have made many projects. Now I have what I call a "Programmer's mind."
That is where I think about how anything is programmed. This has gone from toasters, car electrical systems, and soooo much more." [14]
Through programming with Scratch, this young person was starting to see the world around him in a new way. In a similar fashion, using Scratch and the Scratch online community as the empirical setting, in this thesis I show how we can design and create the technologies, toolkits, and pathways that help a new generation of learners better understand the world of data they are stepping into. Using the Scratch-based system designed and implemented as a part of this thesis, in later chapters, I will show how young
24
CHAPTER 1. INTRODUCTION
learners are creating projects to analyze and visualize data in new ways. In addition, I will also show how these children are using the system to develop nuanced ideas about the role of data in their world.
1.2
Structure of this thesis
In chapter 1 (the current chapter) of this thesis, I provide a broad rationale for my work, describing why this topic is important, and also provide the epistemological and empirical contexts of my work. I also conduct a short survey of related work in this space, and then spell out why the approach that I take is unique.
In chapter 2, I conduct a review of what constitutes data science. The broad topic of this thesis can be described as "children as data scientists", and as data science is an emerging interdisciplinary discipline, I use this chapter to (i) identify core themes within data science, especially in the context of teaching data science to novice learners, and then I proceed to (ii) situate my own work in this thesis within this thematization.
In chapter 3, I conduct a survey of the means and methods through which learners in the Scratch online community are engaging with the topic of data. I describe what data-centric computational affordances are available to Scratch users and I also present descriptive statistics on how these affordances are being utilized.
In chapter 4, I investigate, through four large-scale quantitative studies, some of the factors that are associated with increased use of data-centric computational affordances by Scratch users. In the first three studies, I show that remixing, as well as viewing the source of Scratch projects that use data, increases the possibility that the Scratch user in question will end up using data related programming primitives and constructs in their own subsequent projects (assuming that the user has not used data primitives and constructs before). In the fourth study, I establish a causal relationship between the use of a powerful data programming affordance (Cloud data) and increased use of data structures in general. In chapter 5, I introduce the design and implementation of a new system that aims to engage Scratch community members in the analysis of data about their own participation and learning with Scratch. With this new system, called Scratch Community Blocks, Scratch users can create Scratch projects to access, visualize, and analyze data about their and their peers' social participation, as well as programming activity within the Scratch community.
CHAPTER 1. INTRODUCTION
In chapter 6, I explore the learning possibilities that Scratch Community Blocks open up - through case studies of projects, surveys, and interviews with Scratch users using this system, I describe the emergent themes of how children engage with data analysis through this novel system. I find that Scratch users using the system are not only creating new types of stories and games that incorporate data, but also, they are using the system as an "object-to-think-with", and are exploring ideas around privacy, data-driven discrimination,
etc.
In chapter 7, I conclude with a summary of the work that I have done, and a survey of possible future directions for research.
Finally, in my afterword, I provide a reflective essay on what "Dataland" looks like. In
Mindstorms: Children, Computers, and Powerful Ideas [7], Seymour Papert talked about the
difficulty that young learners face while trying to learn a subject like mathematics. One of the measures of one's learning, he argued, is fluency, and despite years of schooling in mathematics, a vast majority of learners not only fail to have fluency in the subject, but making things worse, many of them become math-phobic and treat the subject with fear and trepidation. On the other hand, he pointed out, children growing up in France, for instance, have no problem becoming fluent in French (even if it is not their native language). In contrast to the outcomes of learning mathematics, fluency in French (after living in France) is a norm rather than an exception. The resultant question, Papert asked, is how do we create an environment that is as conducive to attaining fluency in mathematics
as living in France is for learning French - what does Mathland look like? In the spirit of Mathland, in my concluding essay, I reflect on what Dataland may look like, in the context
of work that I have done as a part of this dissertation.
1.3
Related work
When it comes to learning and programming with data for novice users, there are a few broad categories of related work.
In the first category, there has been a number of courses that focus on the topic of pro-gramming with data for novice programmers. For example, the "Answering Questions with Internet Data: Computational Tools for Social Studies Analysis" course [15],
con-ceptualized and taught by Richard Catrambone and Mark Guzdial, leads undergraduate
CHAPTER 1. INTRODUCTION
college students through analysis of social phenomenon with publicly available data-sets. In a blog-post [16] Guzdial wrote about the course as an exploration in "contextualized computing education", where students can connect their theoretical knowledge acquired in a class to real-world problems that they are interested in. MIT's "6.00.2x: Introduction to Computational Thinking and Data Science" [17], is an online course that covers (among other things) an introductory survey of programming with data. This course is also tar-geted towards novice programmers at the the undergraduate level. At the MIT Center for Civic Media, a number of learning experiences and activities have been designed to engage novices in explorations and visualizations of data [18].
The second category includes specialized toolkits which facilitate explorations of data. IBM ManyEyes [19], for example, lets users upload data-sets and visualize them in differ-ent ways. Yahoo! Pipes [20] let users create mashups between web-APIs and data-sources. Both of these tools were designed for novice users, but not necessarily for youth. Tinker-Plots [21] is a toolkit that enables the exploration of data (primarily through visualization), though there's little programming involved in TinkerPlot activities. Similarly, spreadsheet software like Microsoft Excel and LibreOffice Calc have been used traditionally to manage, analyze, and visualize data. Google Fusion Tables [22] takes the traditional spreadsheet further by adding new types of visualization and query capabilities. A lot of the work on spreadsheets builds on what has been traditionally described as "end-user programming"
[23] as people doing computational data analysis are often non-professional programmers.
Recently, there has also been explorations of the use of spreadsheets or spreadsheet-like interfaces for exploring machine-learning tasks [24]. Toolkits have also been developed for more specialized data, e.g. the Observatory for Economic Complexity [25] project provides a visualization system for international trade data.
MIT App Inventor [26] includes a number of components that enable access to data-sources; in addition, App Inventor also makes it possible for novice users to develop Android apps that collect and visualize data from the host phone's sensors. There is an emerging ecosystem around the Wolfram Programming Language that enable programming with data. The Wolfram Cloud [27], in particular, combines the expressiveness of the Wolfram Language (familiar to anyone who has used Mathematica) with collected and curated data-sources about a wide variety of topics starting from historical weather data going
CHAPTER 1. INTRODUCTION
back to the 19th century to shoe-size standards in different parts of the world5. A more
specialized prototype language that has semantic "understanding" of data and functionality components has been described by Samimi et. al. [28].
Recently, apart from the author's prior work [29], there has been a number of visual block-based programming languages focused on data [30], though the audiences for these languages are often different (e.g. undergraduate students in colleges, domain experts) than those addressed in the proposed dissertation.
Using data to self-reflect on one's activity has been a part of what is known as the "quantified-self" movement, and as self-reflection is an important aspect of the learning experience, over the last few years, there has been some work in the intersection of quantified-self and learning [31].
1.4 Contributions of this thesis
This thesis is an exploration of pathways to data science for young learners. As a a part of this exploration, I make the following contributions:
* A review of how data science is introduced to novice learners in a variety of contexts * A study of what opportunities Scratch provides for young learners to engage with data, and description of how they engage with some of these opportunities and affordances
* Four quantitative studies that investigate the factors that are associated with in-creased engagement of learners in Scratch with programming with data
. The design and implementation of a novel system (Scratch Community Blocks) that engages Scratch community members in programming and learning with data about their own social and programming participation in the Scratch community
- Studies with learners who are using this system, identifying emergent themes of how these learners are creating and thinking with data in new ways
. A reflective essay on "what Dataland looks like"
Within these contributions, especially in my systems building work, I try to focus on two often underplayed aspects of novice learners engaging with data - programming with data,
s https://reference.wolfram.com/language/guide/KnowledgeRepresentationAndAccess.html 28
CHAPTER 1. INTRODUCTION
awareness data awareness programmin
(self-) reflection questions (self-) reflection questions
sensemaking answers sensemaking answers
-m behavior c ange m t behavior change dta-science
imac new meanin ima new: renn~Zeflecin
(a) Original model of reflection with data (b) Extended model for reflection with programming
by Verbert et al. [33]. with data.
Figure 1-3: Extended model of self-reflecting with data.
and self-reflecting with data. I describe their importance, and my approach in focusing on them below.
An important point to highlight in the context of related systems and approaches is the relative lack of programming systems that help novice programmers, especially youth,
engage with data. Throughout this thesis, I try to address this gap by treating programming as a central element of learning with data. In contrast to a number of tools aimed at introducing young learners to data science, where often, visualization is central, I focus on programming as the primary way to engage with data. To me, programming is important because it lets the learner ask questions or conduct explorations which I, as the designer of the learning system or learning experience may not have thought of. Resnick and Silverman [32], while drawing out guiding principles for designing construction kits for children, state that "a little bit of programming goes a long way" in that it opens possibilities for a vast potential design space. In chapter 6, as I survey the artifacts created by Scratch users while programming with data from the Scratch community, it becomes clear that the opportunities opened up by the Scratch Community Blocks are significant and enable the young learners to "accomplish a lot with little."
Another differentiating aspect of the work described in this thesis is the use of data not just to understand the world around oneself, but also to understand oneself. Data traces can be used to support reflection on learning and social participation, and recognizing this potential, learning scientists have have advocated for dashboards that present data on a young person's experience in a social media or educational system to the user herself. Building on work by Li et al. [34], Verbert et al. [33] describes a model of how learning
CHAPTER 1. INTRODUCTION
these systems, work described in this thesis goes beyond traditional dashboards because
the Scratch Community Blocks system presented in chapter 5 seek to provide youth not
with a pre-determined set of measures and metrics but with more "raw" forms of data and tools that users can use to create their own dashboards and interactive visualizations. In the process, users engage in a process of interpreting data that tightly integrates the process of programming and data scientific methods into the process of reflection. Figure 1-3b presents an annotated version ofVerbert et al.'s model shown in figure 1-3a that is colored to indicate the way that the process of reflection supported by programming with data fosters active engagement with data science. In a traditional dashboard where data presented in predetermined, awareness and sensemaking are the two steps through which the learner processes the data. In work described in this thesis, users play an active role in both these steps by using programming to process data and create new visualizations.
1.5
A note about collaborative work
Portions of this thesis incorporate work done in collaboration with others, and constitute "remixes" of several articles, blog posts, and documents published earlier. The sources of
the material have been noted in the relevant sections, and in these sections, I have switched from "I" to "we" as the first-person personal pronoun.
Chapter 2
Data Science
In this chapter I provide a historical perspective on data science, describing how the idea of leveraging computational power and methods to collect, process, and analyze data has been a central driving force behind the development of digital technologies. In addition to examining data science from a historical viewpoint, I also survey the current state of how data science is introduced to novice learners. Using syllabi from a number of introductory data science courses, I draw out the core topics that form the discipline of data science, and then further use this thematization to discuss some of the opportunities that can be leveraged to engage novice learners in data science.
2.1 The three pillars of data science
In the 1962 article, "The Future of Data Analysis", John Tukey [35] drew a distinction between "mathematical statistics" and "data analysis". Tukey described the latter as
con-sisting of "procedures for analyzing data, techniques for interpreting the results of such procedures, ways of planning the gathering of data to make its analysis easier, more pre-cise or more accurate, and all the machinery and results of (mathematical) statistics which apply to analyzing data." With such a description, Tukey was pointing to something that had statistics at its core, but also included a number of other processes and techniques that later became closely associated with the domain of computational methods and computer science. For example, in the present context of data science, the process of "data gathering" consists of methods, strategies, and techniques which all have their roots in the discipline
CHAPTER 2. DATA SCIENCE
of computer science. Millions of electronic sensors collecting data for a physics experiment send their data to a central data collection program that parses and validates the data, sorts and synchronizes the individual data-units according to timestamps, and then stores it in a specialized format for later retrieval and analysis. Similarly, clicks from millions of users on the homepage of a popular news website are "streamed" via an in-memory database to a real-time visualization system used by the website administrators to understand which topic is trending, what topic is gaining in prominence, and so on.
Compare seaich terms.
data science" Add term
Interest over time
<I>
Figure 2-1: Worldwide interest in the search term "data science" according to Google trends.
(retrieved: April 2016)
This combination of computational methods and statistics has existed informally since the pre-dawn of the computer age. In 1884, Herman Hollerith [36] patented an electromechan-ical counting machine, to be used for the US census, and the title of the patent was "Art of compiling statistics". After the advent of modern computers, around the time when Edgar Codd [37] published his seminal work on data relation model (which forms the theoretical backbone of modern database systems), the IBM Scientific Subroutine Package for FOR-TRAN included subroutines to conduct common statistical tasks such as ANOVA, linear and polynomial regression, factor analysis, time-series analysis, and more [38]. However, despite this long history of co-existence, the term "data science" started to rise in world-wide search volume for Google from late 2012; as figure 2-1 from Google Trends' suggest, the term has seen steady rise in interest since then.
32
1 https://www.google.com/trends/
I
CHAPTER 2. DATA SCIENCE
Apart from statistical and computational techniques, a third pillar of data-science is sub-stantive expertise about a specific domain. It is hard to understand data without context and domain knowledge; a non-expert in physics who is well-versed in computer science, mathematics, and statistics will have a difficult time making sense of data collected from a physics experiment. An often-cited definition of data science treats it as the intersection of programming knowledge, statistics and mathematical know-how, and substantive ex-pertise, all the three areas being equally important. In 2010 Drew Conway came up with a Venn diagram representing this intersection[39], and his diagram is reproduced below (figure 2-2). Machine S Learning Data Science
Substantive
Expertise
Figure 2-2: Data science Venn diagram by Drew Conway [39]. Reproduced under a Creative
Commons Attribution-NonCommercial license.
In a similar vein, in a 2014 draft report to the National Science Foundation (NSF) titled "Data Science at NSF" [40], data science is defined as "the science of planning for,
acquisi-tion, management, analysis of, and inference from data" requiring a "broad set of skills & perspectives", including from "mathematics, statistics, computer science, domain specific expertise".
In this dissertation, I build upon and extend this definition of data science, and later in that chapter, describe topics that fall outside of these three core areas, but are increasingly
CHAPTER 2. DATA SCIENCE
seen as being valid and important pieces of knowledge that all data scientists should be familiar with.
2.2 Analyzing approaches to introduce data science
The topic of interest in this dissertation is data science for novice learners, and as an exploratory exercise to understand data science as a discipline, especially in how it is presented in an introductory context, I analyzed the syllabi for 4 introductory data science courses. The object of this analysis was to map the various topics taught in the courses to the foundational areas described earlier.
Course Provider Type Target Audience Pre-requisites
Coursera MOOC General/ Profession- Intermediate
program-als ming experience and
familiarity with databases Georgia Tech Summer College students N.A.
Course
edX MOOC General/ Undergrad- Basic Python
program-uates ming skills, some knowl-edge of computational complexity
Udacity MOOC General/ Profession- Basic programming and
als statistics knowledge
Table 2.1: Introductory data-science courses used in my analysis
The only common criteria for choosing these courses was that they needed to focus on a novice audience; apart from this, each of the courses differ considerably from each other in setting (e.g. college course vs. MOOC), target age group (e.g. college undergraduates v.s. professionals), prior programming experience, etc. (Table 2.1). The following table below shows the mapping of the different topics taught in these courses to the structure of data science as a discipline (Table 2.2).
I further unpack each of the foundational areas into topic areas - e.g. Computer Science can be broken down into topic areas of Constructing Data, Processing Data, and Rep-resenting Data. I describe these topic areas in detail in the section following the table. In addition, apart from the foundational areas described in the previous definitions, an
CHAPTER 2. DATA SCIENCE
extra foundational area is added in this table, and the foundational area of "substantive knowledge" is missing - I discuss this addition and the omission later in this chapter.
Foundational Area Topic Area Topics
Computer Science Constructing Data
Processing Data
Representing Data
Databases and relational algebra, Read-ing/writing live data, What is Data Wrangling?, Acquiring Data, Common Data Formats, Introduction to Databases Schemas, APIs, Data in JSON Format, How to Access an API efficiently, Miss-ing Values
Parallel databases, parallel query processing, in-database analytics, MapReduce, Hadoop, relationship to databases, algorithms, extensions, lan-guages, traversals, PageRank, Key-value stores and NoSQL, Iteration, Comput-ing averages, ComparComput-ing sequences, Random walks, Clustering algorithms, Knapsack problem, Curve fitting, Monte Carlo simulations, Graphs and graph optimization, Basics of MapReduce, Mapper, Reducer, Pandas
Visualization, Simple plotting, Multiple plots, Visualizing text, Plotting with the pylab package, Effective Information Vi-sualization, Visual Encodings, Percep-tion of Visual Cues, Plotting in Python, Data Scales, Visualizing Time Series Data
Statistics and Mathematics
Research with Data experiment design, Correlational Ap-proach, Experimental ApAp-proach, Quasi-experimental, Naturalistic Observation, Hypothesis testing, Causation, Correla-tion, Control Groups
CHAPTER 2. DATA SCIENCE
Foundational Area Topic Area
Exploring Data
Inferring from Data
Topics
Descriptive Statistics, Assumptions of distributions: Uniform and normal, Ran-dom distributions, standard deviation, Distributions, Introduction to Normal Distribution
supervised learning (rules, trees, forests, nearest neighbor, regression), unsuper-vised learning, Compute correlations, t-tests, ANOVA, Regression, Curve fit-ting, Probability, Impute using Linear Regression, T Test, Welch T Test, Non-Parametric Tests, Non-Normal Data, Pre-diction with Regression, Coefficients of Determination
Social Sciences and Society and Data Provenance, privacy, ethics, governance Humanities
Table 2.2: Topics in introductory data science
foundational areas that constitute the discipline
syllabi, mapped to topic areas within the
2.3 Unpacking the foundational areas
As can be seen from table 2.2, I divide the foundational areas into specific topic areas -however, I should offer a caveat here that the division is not perfect, and there are overlaps between the topic areas. In this section I describe in some detail what these topics are.
2.3.1 Topics areas within Computer Science
This categorization is based on work done in my masters thesis [41]; I provide three broad topics that cover computational exploration and analysis of data.
Constructing Data
Processes in this topic typically constitute the first stage in any data science activity.
A large chunk of this topic is about collecting data, which can happen in many ways.
For example, data may be available from a website over an Application Programming
CHAPTER 2. DATA SCIENCE
Interface (API), or it may be downloadable as Comma Seperated Value (CSV) files from a goverment agency's website. In some cases, a more "brute-force" tactic may be required to collect the data - an example of this would be scraping a public website for specific content (such as user comments, or rental listings). However, data collection is not the only element in this topic - a second important element is the ability to understand relationships within the data. If the data under consideration is about bike trips in a bike-sharing programming, it may also include information about the riders (e.g. demographic information such as gender and age). Being able to connect trips to riders (and vice versa) is an important part of constructing datasets. Another important aspect of constructing data is the clean-up process. Missing and
invalid values need to be accounted for, records need to validated to ensure that all fields are present, and so on. Depending on the methods used in the earlier stages of construction, this may require considerable effort. For example, data that is scraped from websites often have to be cleaned up thoroughly before meaningful analysis can be done.
Processing Data
An important part of data processing includes choosing the right internal repre-sentation, and then transforming the data into that representation. This involves
data abstraction, which, as described in the Structure and Interpretation of Computer Programs is a strategy that "enables us to isolate how a compound data object is
used from the details of how it is constructed from more primitive data objects" [42]. An example of this activity is the use of a graph in a computation system -if a data scientist wants to model ties between members of a social network, she would typically transform the "raw" data she has into a graph data-structure. Once this is done, she will not necessarily have to worry about how the graph is actually constructed in the computer's memory - she will have procedures that hide away the details of implementation and let her compute the most connected person in the social network, or find the average number of ties between all pairs in the network. This step of data abstraction usually involves two distinct tasks - one, an application
of the know-how of which underlying data-structure or low-level representation (e.g. a relational database, or a key-value data store) is the most appropriate for the problem at-hand, and second, the process of transforming the available data into
CHAPTER 2. DATA SCIENCE
the data-structure or internal representation of choice.
The other major category where data processing is necessary is, of course, when we want insights out of the data, when we want to know what the data really represents and what it can tell us about the problem at hand. In these situations, we move into the space of algorithms of various complexities (e.g. graph traversal, sequence comparison, curve fitting). However, even in this scenario, if we drill down further, a lot of these algorithms can be decomposed into a combination of a few basic operations. An instance of this in the real world was demonstrated in 1979 by Richard Waters in with an analysis of a number of FORTRAN programs from the IBM Scientific Subroutines Package, where he found that a significant percentage of the program loops could be represented by a combination of three low-level operations [43].
" a map operation where a function is applied to each element in the dataset.
(e.g. squaring all the elements of a list of numbers)
- a reduce or a fold operation where a function is applied cumulatively to the elements in a dataset, to produce a single value in the end. (e.g. adding all elements of a list of numbers)
- a filter operation where a function is applied to each element in a dataset, and the result is a new dataset which has all the elements for which the function returns true. (e.g. checking if a given element of a list of numbers is positive, and creating a new list with only the positive numbers)
Representing Data
The third and final topic is representing data - not internally for manipulation by computer programs, but as public entities that can be inspected and understood. A common method for data representation is visualization. Visualization has a long history that predates the era of computers significantly; notable examples include Dr John Snow's 1854 map-based visualization of cholera outbreak around a specific public water pump in London, and Charles Joseph Minard's 1869 visualization of the disastrous Russian campaign by Napoleon. However, computational methods, combined with computational power, enable us to visualize data that has many dimensions and is orders of magnitude larger than what we could visualize before. Moreover, affordances of digital media like interactivity enable new possibilities for

![Figure 2-2: Data science Venn diagram by Drew Conway [39]. Reproduced under a Creative Commons Attribution-NonCommercial license.](https://thumb-eu.123doks.com/thumbv2/123doknet/14290134.492642/33.918.252.626.406.764/figure-science-diagram-reproduced-creative-commons-attribution-noncommercial.webp)

![Figure 3-6: Design space of persistent variables in Scratch - showing the position of standard Scratch variables, shariables, and Cloud variables [41].](https://thumb-eu.123doks.com/thumbv2/123doknet/14290134.492642/54.918.128.751.464.941/persistent-variables-scratch-position-standard-variables-shariables-variables.webp)