Cobalt Demand: Past, Present, and Future
by
Alexandra A. Zele
Submitted to the Department of Materials Science and Engineering in partial
fulfillment of the requirements for the degree of Bachelor of Science in
Materials Science and Engineering
at the
MASSACHUSETTS INSTITUTE OF TECHNOLOGY
June 2018
Massachusetts Institute of Technology 2018. All rights reserved.
Author
Signature redacted
Department 0fMaterials Science and Engineering
May 18, 2017
Signature redacted
C ertified by...
Elsa A. Olivetti
Atlantic Richfield Assistant Professor of Energy Studies
Thesis Supervisor
Accepted by
Signature redacted
..
MA S CH.E T...
NST...
...
T....UTE.
O .- ---MASSACHETS ILNSTITUTE OF TECHNOLOGJUN 2
6
2018
LIBRARIES
ARCHIVES
Juejun Hu
Associate Professor
Chairman, Undergraduate Committee
MITLibraries
77 Massachusetts Avenue
Cambridge, MA 02139 http://Iibraries.mit.edu/ask
DISCLAIMER NOTICE
Due to the condition of the original material, there are unavoidable
flaws in this reproduction. We have made every effort possible to
provide you with the best copy available.
Thank you.
The images contained in this document are of the
best quality available.
Cobalt Demand: Past, Present, and Future
by
Alexandra A. Zele
Submitted to the Department of Materials Science and Engineering on May 04, 2018, in partial fulfillment of the requirements for the degree of
Bachelor of Science in Materials Science and Engineering
Abstract
Cobalt has become more and more popular in the realms of academia, industry, and media due to its integral role in many of the most commonly-used lithium-ion battery cathodes today. Many issues have been evaluated regarding the controversial labor and volatile sociopolitical
environments associated with cobalt mining and concerns over the ability of cobalt supply to continue to meet demand, especially the increasing demand due to the electric vehicle revolution. Cobalt is a critical element in a variety of products outside of the battery industry, including: superalloys, hard-facing metals, cutting tools, magnets, chemical catalysts, and pigments. In this thesis, I assessed the criticality of cobalt demand in non-battery sectors with the intention of assessing whether demand of cobalt in its traditional, inelastic sectors will supply be a limiting factor of technological progress by 2030 and by 2050.
In order to do so, data was collected on the past and present demands of cobalt in its four primary sectors, outside of batteries: superalloys, cutting tools and hard-facing metals, magnets, and chemical catalysts. Future demand projections were made based on the historic data as well as via a bottom-up approach from industry projections for future product demand and cobalt intensity of products. Substitutes for cobalt in these applications were also investigated and are discussed below. The prices at which substitutes become more favorable than cobalt were also evaluated.
Thesis Supervisor: Elsa A. Olivetti
Title: Atlantic Richfield Assistant Professor of Energy Studies
Acknowledgments
I would first and foremost like to thank my thesis advisor, Professor Elsa Olivetti, for her guidance, patience, kindness, and support throughout the development of this work. Professor Olivetti conceptualized this work and influenced my interest and passion in this topic. She also provided insightful questions and helpful commentary throughout the development, research, and writing of this work. I really appreciated how hands-on she was throughout this past semester and how involved she was with checking in on the progress of the work and helping to improve its quality. Professor Olivetti is an inspiration to all who interact with her due to her hard work, positivity, and the emphasis she places on the "real-world" impacts of her work. Thank you for everything that you have taught me and allowed me to learn for myself!
I also owe many thanks and praise to Xinkai Fu. Xinkai was the primary lead on the supply-side research that is mentioned later on in this work. He was also my main point of contact in the Olivetti Group during the course of my thesis work this semester. Xinkai was always thoughtful enough to send me new articles or direct me towards databases with helpful information and never failed to make time to meet with me regularly to provide feedback on the progress of the work and brainstorm ideas for next steps. Xinkai's work ethic, kindness, and guidance were instrumental in the completion of this work and I will always be grateful to him for that.
I also must add MIT Materials Science and Engineering Department to this list of gratitude. The faculty, staff, and fellow students that have been a part of my Course 3 experience have taught me so much, both inside and outside of the realm of academia. I would not have learned so much, been so passionate about what I've learned, or enjoyed my time at the Institute as much as I have without them. The department has been an incredible source of support and knowledge the past 3 years that I have been a part of it.
And, lastly, I would like to thank my family and friends for their endless support and encouragement.
Table of Contents
Introduction ... 9
Cobalt Basics: ... 9
Uses and Sectors: ... 9
Social Justice and Supply Concerns: ... 12
Overall concerns and im portance of work: ... 13
Cobalt Dem and Analysis ... 15
Historic and Present Dem and ... 15
Historic Dem and ... 15
Present Dem and ... 19
Future Demand Projections ... 20
Future Superalloy Dem and ... 21
Future Cutting Tool and Hard M etals Dem and ... 29
Future Chem ical Catalyst Dem and ... 36
Future M agnet Dem and ... 41
Supply Projections vs. Demand Projections ... 49
Cobalt Alternatives ... 53
Viable Substitutions ... 53
Superalloys ... 54
Cutting Tools and Hard-facing M etals ... 55
M agnets ... 58
Chem ical Catalysts ... 59
Sum m ary ... 60
Conclusion ... 63
List of Figures
Figure 1: Global and U.S. cobalt demand between 1999 and 2015 ... 15
Figure 2: Cobalt demand between 1975 and 2015 in the U.S. by end-use sector ... 17
Figure 3: Global cobalt demand by end-use sector between 2005 and 2015 ... 18
Figure 4: Global cobalt demand by end-use sector in 2017... 19
Figure 5: Historic data for global and U.S. cobalt consumption in superalloys ... 21
Figure 6: CAGR-based demand projection for cobalt in the superalloy sector ... 22
Figure 7: Historic data for cobalt consumption in cutting tools and hard-facing metals ... 29
Figure 8: CAGR-based demand projection for cobalt in U.S. cutting tool and hard-facing metals ... 30
Figure 9: CAGR-based demand projection for cobalt in global cutting tool and hard-facing metals ... 30
Figure 10: Historic data for global and U.S. cobalt consumption in the chemical catalysts ... 36
Figure 11: CAGR-based demand projection for cobalt in chemical catalysts ... 37
Figure 12: Historic data for global and U.S. cobalt consumption in the magnets ... 42
Figure 13: CAGR-based demand projection for cobalt in the U.S. magnet sector ...
43-Figure 14: CAGR-based global demand projection for cobalt magnet sector ... 43
List of Tables
Table 1: Global and U.S. cobalt demand between 1999 and 2015 ... 16
Table 2: Tabulated cobalt demand projections in the superalloy sector ... 22
Table 3: List of industries included in the bottom-up approach for projecting cobalt demand in
superalloys and their respective share of the sector ... 23
Table 4: List of industries included in the bottom-up approach for projecting cobalt demand in
superalloys and the product that will represent the industry's cobalt consumption ... 24
Table 5: List of the dominant products evaluated in the bottom-up approach, the alloy(s) they commonly
consist of, and their alloys' cobalt intensity ... . . ... 24
Table 6: The main engine-producing companies, the total weight of differently-sized engines for each
company, and the percentages of each alloy that the company uses to make its engines ... 25
Table 7: Projected demand of cobalt in 2035 and 2050 due to superalloy applications in the aerospace and
defense industries ... 25
Table 8: Table of the two different wind turbine sizes, their corresponding weights, and their alloys'
cobalt intensities that are used in the bottom-up demand projections ... 26
Table 9: : Projected demand of cobalt in 2035 and 2050 due to superalloy applications in the energy
industry ... . . .. 26
Table 10: Projected demand of cobalt in 2035 and 2050 due to superalloy applications in the medical
field ... 2 7
Table 11: Projected demand of cobalt in 2035 and 2050 due to superalloy applications in "other"
in du stries ... 2 8
Table 12: Bottom-up projected demand of cobalt in 2035 and 2050 due to cumulative superalloy
applications ... . . 28
Table 13: Projected cobalt demand in the cutting tool and hard-facing metals sector ... 31
Table 14: Price-based projected demand of cobalt in 2035 and 2050 due to cumulative cutting tool and
hard-facing m etals applications ... 33
Table 15: Price-based projected demand of cobalt in 2035 and 2050 due to cumulative cutting tool and
hard-facing m etals applications ... 34 Table 16: List of dominant industrial products, their cost, and the amount of their mass made of a
cobalt-containing alloy ... 34
Table 17: Bottom-up projected demand of cobalt in 2035 and 2050 due to cumulative cutting tool and
hard-facing m etals applications ... 35
Table 18: Bottom-up projected demand of cobalt in 2035 and 2050 due to cumulative cutting tool and
hard-facing metals applications when cobalt-containing materials represent 30% of the sector ... 35
Table 19: Tabulated cobalt demand projections in the chemical catalyst sector ... 37
Table 20: Bottom-up projected demand of cobalt in 2035 and 2050 due to gas-to-liquid industry ... 39
Table 21: Bottom-up projected demand of cobalt in 2035 and 2050 due to industrial PET production ... 40
Table 22: Bottom-up projected demand of cobalt in 2035 and 2050 due to cumulative chemical catalyst
applications ... . 40
Table 23: Tabulated cobalt demand projections in the magnet sector ... 44
Table 24: List of dominant industries, their representative products, and the metric by which the number
of 'units' of each product will be determined in the bottom-up projection for magnets ... 45
Table 25: List of common magnet alloys containing cobalt and their cobalt compositions ... 45
Table 26: Bottom-up projected demand of cobalt in 2035 and 2050 due to magnetic applications in
aircrafts ... . . 46
Table 27: Bottom-up projected demand of cobalt in 2035 and 2050 due to magnetic applications in
satellites ... 47 Table 28: : Bottom-up projected demand of cobalt in 2035 and 2050 due to magnetic applications in
Table 29: Bottom-up projected demand of cobalt in 2035 and 2050 due to magnetic applications in cell
ph ones ... 4 8
Table 30: Bottom-up projected cumulative demand of cobalt in 2035 and 2050 due to industrial magnetic
applications ... . . 49
Table 31: CAGR- projected total demand of cobalt in 2025, 2030, and 2050 ... 50
Table 32: Bottom-up- projected total demand of refined cobalt in 2035 and 2050 ... 51
Table 33: Tabulated values for total global cobalt supply in 2017 and 2023 ... 51
Table 34: Total demand projections from both approaches compared to the supply projection ... 52
Table 35: Summary table of the most viable discussed alternatives to/substitutes for cobalt in this section. Implementation time, degree of substitution, and costs of candidates included to help visualize and consider the viability of the options ... 61
Introduction
Cobalt Basics:
Cobalt is a hard, lustrous, ferromagnetic metal. Considered rare, even though its concentration on Earth is of medium abundance, cobalt is often only economically viable to acquire as a by-product. In other words, 94% of the time [Petersen, 2016] cobalt is obtained most commonly by the mining and smelting of (and later separation from) other metals; the other metals are most often with copper or nickel. Studies have determined that about 55% of cobalt extraction is a result of nickel mining, 35% comes from copper mining, and the other 10% mostly comes from other platinum group metals; only 2.2% of extracted cobalt was found to come from primary cobalt mining [Sverdrup et. al., 2017].
Cobalt's unique magnetic and metallic properties have resulted in its use in a variety of applications spanning a plethora of industries. These industries include, but are not limited to, aerospace, defense, energy, oil and gas, plastics, art and jewelry, cutting tools, medicine, automobile, and music. Cobalt demand is inflexible in these non-battery sectors due to the critical nature of cobalt in these applications, the difficulty in finding viable alternatives for cobalt (in terms of properties), and the lower price sensitivity of the large industries involved.
Uses and Sectors:
Cobalt was first used in glasses, glazes, and ceramics for centuries in order to impart blue and purple colors to jewelry, works of art, and functional household items. Differing concentrations of cobalt, varying additional additives, and changing bases (i.e. ceramic versus
are commonly still used by artists in order to electroplate porcelain elements and improve hardness, oxidation-resistance, and aesthetic properties.
Cobalt's unique magnetic and thermal properties were later discovered and cobalt became a common component in high-performance alloys - ranging from superalloys to medical implant alloys to high-speed steels to permanent magnets. In superalloys, cobalt is used either as an alloying element or as a base. Cobalt-based superalloys consume most of the cobalt produced, outside of lithium-ion batteries [USGS, 2015]. Cobalt is an ideal component of superalloys because it creates superalloys with high-temperature stability and improved corrosion- and wear-resistance. Similarly, cobalt is used in high-speed steels and other cutting tool alloys - for heat- and wear-resistance. And in orthopedic and dental implants, cobalt is used to improve alloy corrosion- and wear-resistance. In permanent magnets, the addition of cobalt improves coercivity and curie temperature values; the most common permanent magnets on the markets are samarium-cobalt and aluminum-nickel-cobalt. Cobalt can also be used as an alloying agent for platinum jewelry, as it helps to make the metal suitable for casting, slightly magnetic, and it is hypoallergenic (unlike nickel).
Cobalt was the first cathode material used for commercial Li-ion batteries and remains a key element to the most common lithium-ion cathodes on the market currently. Lithium-ion batteries containing cobalt tend to have higher charge densities, cycling capacities, and power-to-weight ratios, as well as shorter recharge times than lead-acid and nickel-metal hydride batteries [BMO Capital Markets, 2017]. Cobalt is essential for batteries due to its stabilizing capacity, which maintains battery strength and lifespan; nickel is an extremely energy dense element but is not chemically or structurally stable enough on its own, which is where cobalt comes in. Therefore, cobalt improves the cycle life of lithium-ion batteries. The most common battery cathode
compositions are lithium-cobalt oxide (LCO) and nickel-manganese-cobalt (NMC), of varying component compositions. The percentage of cobalt in commercial lithium-ion batteries ranges from 6-60 wt. % [BMO Capital Markets, 2017]. Batteries only accounted for 16% of total cobalt consumption globally in 2000; however, in 2017 they accounted for 55% of the total global cobalt consumption [BMO Capital Markets, 2017].
The last major use of cobalt, both globally and in the United States, is as a catalyst in chemical processes. Cobalt compounds are often used as oxidation catalysts and precursors in the bulk production of polyethylene terephthalate (PET), a common plastic used to make various bottles, protective equipment, and much more. Cobalt carboxylates are used as drying agents in paints, varnishes, resins, and inks - the cobalt compounds are used to induce oxidation of the drying oils. Cobalt carboxylates are also used to improve the adhesion between steel and rubber in applications in which they must be held together; for example, in steel-belted tires or manufacturing applications. Catalysts with cobalt components are used for steam reformation during the production of hydrogen, for the hydrogenation of carbon monoxide into liquid fuels (gas-to-liquid or GTL processes), and for the hydroformation of alkenes. Hydrodesulfurization of petroleum requires the use of a catalyst derived from cobalt (or molybdenum); the majority of cobalt catalyst usage is due to the petroleum industry [Cobalt Institute, 2018].
Cobalt is considered to be highly value additive to superalloys and magnets, moderately value additive to cutting tools and batteries, and of low additional value to chemical catalysis, pigments, resins, and other applications [Sverdrup et. al., 2017]. However, substitution of cobalt with other elements is possible in many cases, with and without changes in performance. In batteries, manganese, nickel, or other rare-earth metals be replace cobalt, but all of these options result in inferior functioning and heavier batteries [Sverdrup et. al., 2017]. The substitution options
in the various applications this work focuses on - superalloys, hard metals and cutting tools, magnets, and chemical catalysts - will be discussed in more detail in a later section.
Social Justice and Supply Concerns:
Two of the primary issues with the use of cobalt in commercial products relate social justice and supply concerns. In regards to social justice, a January 2016 Amnesty International report sparked public concern regarding child labor and unsafe mining conditions in the artisanal mining of cobalt in the DRC [Darton Commodities Limited, 2018]. Further public outrage and social condemnation of companies, including Apple, for using artisanal cobalt from the DRC in their cell phones and laptops was instigated by a Washington Post article tracking cobalt flows from unsuitable environments to consumer products in the U.S. [Frankel, 2016]. Since the DRC supplied 60% of the globally produced cobalt in 2015, corporation movement away from DRC cobalt will significantly affect the available cobalt for commercial applications [USGS, 2015].
Governments have been recently been creating new policies banning the sale of traditional, petroleum-fueled vehicles and setting goals for the number of electric vehicles in their countries. For instance, fossil fuel cars will no longer be sold in Norway by 2025, India by 2030, and Great Britain and France by 2040. Germany, China, and eight other countries have all expressed similar goals, but have not set official target or enforcement dates yet [Petroff, 2017]. Additionally, many automakers, including Tesla, Ford, General Motors, and others have invested large amounts of money in the research and production electric vehicles in order to help countries meet their target goals. Furthermore, as populations become more aware of and accepting of the effects of climate change on the environment, they educate themselves and become more aware of the ways in which they can reduce their carbon footprint. As a result of governments, companies, and individuals,
the demand for electric vehicles is rapidly increasing. The growth of the electric vehicle sector directly corresponds to a growing demand for lithium-ion batteries, which in turn directly corresponds to an increasing demand for cobalt. One of the most common lithium-ion battery compositions is that of lithium-cobalt oxide (LCO), which is well-known to be around 60 wt.% cobalt.
To keep up with demand growth, the global supply of refined cobalt has doubled since 2004 [BMO Capital Markets, 2017] and the United States Geological Survey (USGS) estimates the world's cobalt reserves to be around 7,100,000 metric tons [USGS, 2015]. Nevertheless, articles and journals, knowing cobalt's media presence for social justice issues have began promoting the idea that cobalt supply is significantly at risk and will soon run out or will constrain battery production and therefore the electric vehicle sector. For instance, one commodities report contends, "cobalt looks to be the main constraint on battery market growth. Even without a rise in EV demand, we foresee a tight market, while overreliance on the DRC on the supply side cannot be avoided" [BMO Capital Markets, 2017]. These accounts attribute cobalt supply risks to either current extraction capabilities and/or natural reserve levels. Modem technology in a range of industries is heavily dependent upon a single supply country that is geopolitically unstable, produces cobalt as a byproduct of the mining of other metals, and has a complex and controversial supply chain. These reasons, along with large increases in demand for cobalt due to a rapidly-growing battery sector, have fueled fears of cobalt supply shortages.
Overall concerns and importance of work:
(CAGR) of about 6%. Such a large annual growth rate indicates that there are reasonable concerns
that individuals, companies, and governments have regarding the future supply and demand of
cobalt. Consequently, this thesis work aims to assess how demand will change in the four primary
non-battery sectors of cobalt consumption and then evaluate whether or not demand will out-pace
supply by 2030 and/or by 2050. Furthermore, this work will analyze at what prices viable cobalt
substitutes and alternatives will become economically preferential to cobalt and how they will
resultantly affect short-term cobalt demand.
Cobalt Demand Analysis
Historic and Present Demand
Historic Demand
The historic cobalt demand was derived from the publicly reported cobalt consumption
data from the USGS Minerals Yearbook reports on cobalt, for United States-specific consumption,
and from the Cobalt Development Institute's (CDI) Cobalt Facts reports, for global consumption.
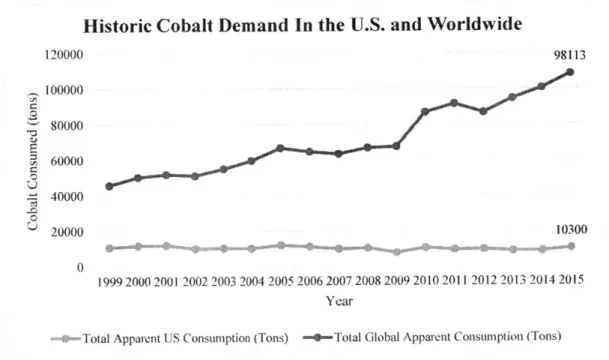
The total consumption of cobalt at both a national (U.S.) and a global level from 1999-2015 was
found to be:
Historic Cobalt Demand In the U.S. and Worldwide
120000 98113 100000 8000 60000 40000 20000 10300 0 1999 2000 2001 2002 2003 2004 2005 2006 2007 2008 2009 2010 2011 2012 2013 2014 2015 Year
-- Total Apparent US Consumption (Tons) -- Total Global Apparent Consumption (Tons)
Figure 1: Graphic representation of the cobalt demand between 1999 and 2015, both in
the US and globally, according to data from the USGS and CDI The graph demonstrates how
the trendfor cobalt consumption in the U.S. is more stagnant than the trend for cobalt
consumption around the world.
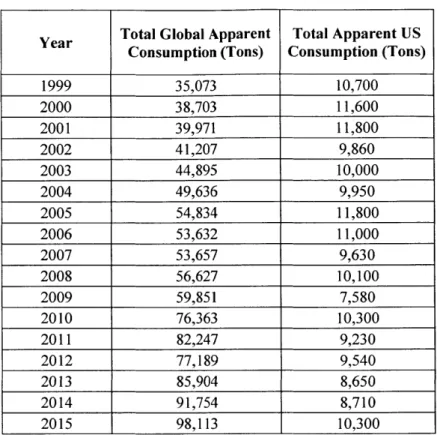
Total Global Apparent Total Apparent US Year Consumption (Tons) Consumption (Tons)
1999 35,073 10,700 2000 38,703 11,600 2001 39,971 11,800 2002 41,207 9,860 2003 44,895 10,000 2004 49,636 9,950 2005 54,834 11,800 2006 53,632 11,000 2007 53,657 9,630 2008 56,627 10,100 2009 59,851 7,580 2010 76,363 10,300 2011 82,247 9,230 2012 77,189 9,540 2013 85,904 8,650 2014 91,754 8,710 2015 98,113 10,300
Table 1: Tabulated cobalt demand between 1999 and 2015, both in the US and globally, according to data
from
the USGS and CDI. The table above corresponds to the data representedin Figure 1.
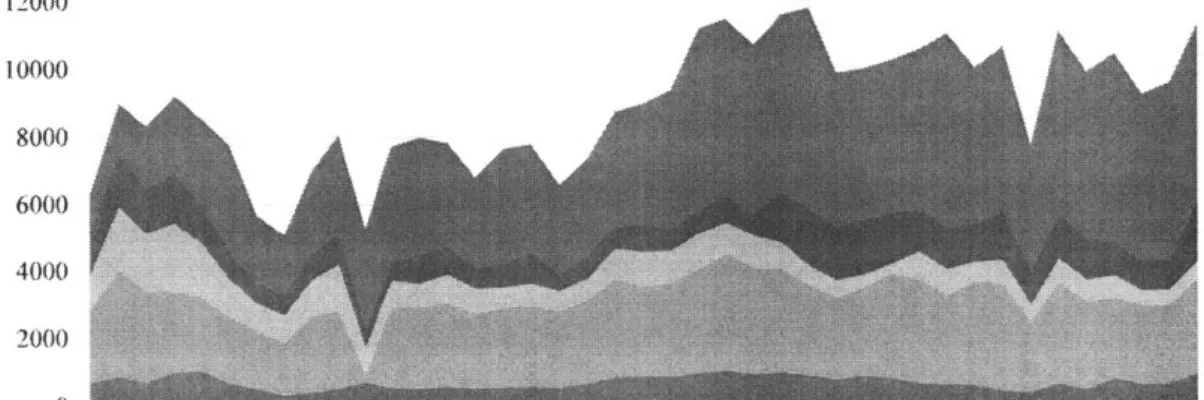
The historic breakdown of cobalt consumption by end-use sector in the U.S, based on
USGS reported cobalt consumption data is:
Historic Cobalt Consumption in the U.S. By End-Use
14000 0 Q 0 12000 10000 8000 6000 4000 2000 1975 1977 1979 1981 1983 1985
a Cemented Chemicals and
Carbides Ceramics
1987 1989 1991 1993 1995 1997 1999 20ol 20U3 2005 2007 2009 2011 2013 2015 Year
Magnetic Alloys 2 Steels. Other Alloys.
and Other Metallic Uses
Figure 2: Cobalt demand between 1975 and 2015 in the U.S. by end-use sector. Data provided by the USGS Minerals Summary reports.
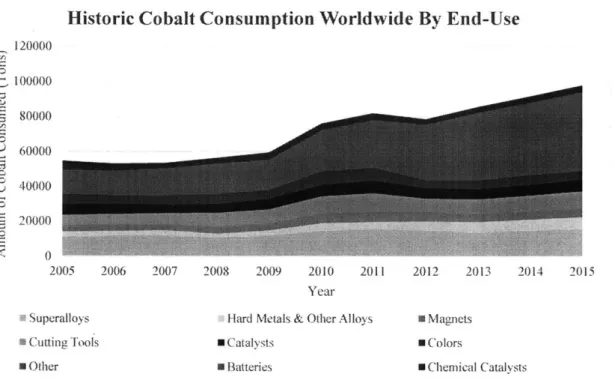
The historic breakdown of cobalt consumption by end-use sector worldwide, based on CDI
reported global cobalt consumption data is:
Historic Cobalt Consumption Worldwide By End-Use
1 20000 100000 80000 '~60000) '-) 100 ? 0000 0 2005 2006 2007 2008 2009 2010 2011 2012 2013 2014 2015 Year
Hard Metals & Other Alloys
M Catalysts
SFBatteries
" Magnets
* Colors
M Chemical Catalysts
Figure 3: Global cobalt demand by end-use sector between 2005 and 2015. Data provided by the CDI's Cobalt Facts reports.
18
- Superalloys * Cutting Tools * Other
Present Demand
According to the Darton Commodities 2017 Cobalt Market Review, the total refined cobalt consumption globally was 103,900 metric tons; this provided for an 8.1% year-on-year increase from 2016 global consumption [Darton Commodities Limited, 2018]. The 2017 end-use breakdown is illustrated in Figure 4.
Global Total Refined Cobalt Consumption By End-Use Sector (2017)
a Baries Speaoys Hard-mebAs and Cing tools Catarasft am nicsad Pigments * Tiee and Paint d&i * Manets *O
Figure 4: Global cobalt demand by end-use sector in 2017. Data provided by the Darton Commodities 2017 Cobalt Market Review.
Future Demand Projections
Two types of demand projections were made for each end-use sector: (1)
history-based projections and (2) bottom-up projections. History-history-based projections were calculated history-based
on the calculated compound annual growth rate (CAGR) of the available past, reported
consumption data. Bottom-up projections were calculated using the industry sales projections of
products using cobalt within each industry along with the average cobalt intensity of products.
Demand projections were made to both 2030 and 2050. The compound annual growth rate
(CAGR) of the two sets of data was calculated using the standard formula:
CAGR = (final value/initial value)('/#
of years) _ IFuture Superalloy Demand
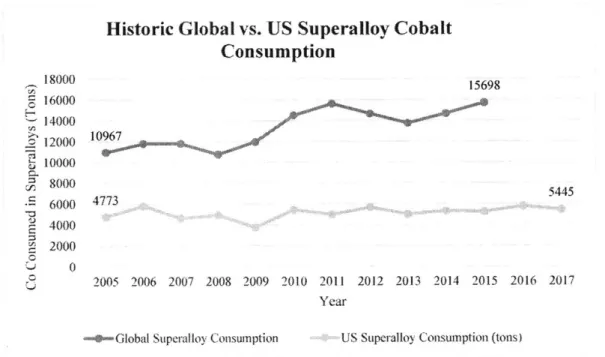
The historic data that was used to calculate the CAGR of the global and U.S. cobalt consumption in superalloys came from the CDI and USGS, respectively.
Historic Global vs. US Superalloy Cobalt
Consumption
15698 10967 5445 4773 2005 2006 2007 2008 2009 2010 2011 2012 2013 2014 2015 2016 2017 Year--- Global Superalloy Consumption -US Superalloy Consumption (tons)
Figure 5: Historic datafor the global and U.S. cobalt consumption in the superalloy sector.
Data provided by the CDI and USGS, respectively.
H 18000 16000 14000 12000 10000 8000 6000 4000 2000 0
The global CAGR was found to be 3.65% and the U.S. CAGR was found to be 1.10%. The
CAGR values were then used to estimate cobalt demand to the years 2030 and 2050.
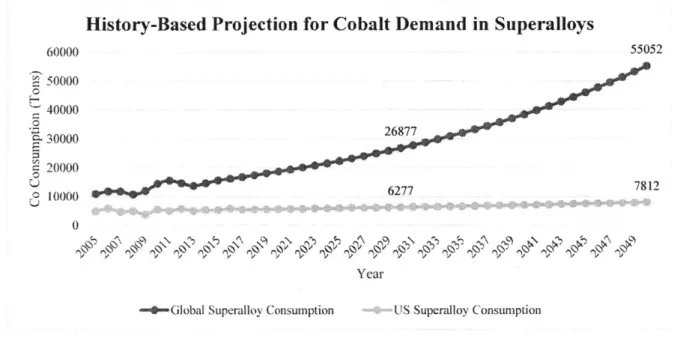
History-Based Projection for Cobalt Demand in Superalloys
55052 6000 5000 4000 3000 2000 1000 0 0 0 26877 0 0 6277 7811 0 Year'
--- Global Superalloy Consumption -0-US Superaljoy Consumption
Figure 6: History-based demand projections for cobalt in the superalloy sector.
The history-based, or in other words the CAGR-based, projections for cobalt demand from
superalloys concluded:
Predicted Global Predicted US
Year Superalloy Superalloy
Consumption (Tons) Consumption (Tons)
2025 22,467 5,943
2030 26,877 6,277
2050 55,052 7,812
Table 2: Tabulated cobalt demand projections in the superalloy sector, both in the US and
globally, according to datafrom the USGS and CDI The table above corresponds to the data
represented in Figure 6.
22
A second approach was taken to approximate the future U.S. and global demand needs for
refined cobalt in the superalloy sector. The projections were made using a bottom-up approach by using future product demand projections combined with materials intensity information. The remaining part of this section will cover the assumptions that this methodology is founded upon and the resulting estimations.
Within the superalloy industry alloys that are cobalt-based or have cobalt additives are used to make turbines and frames for power generation, engines in the aerospace, military, and defense industries, medical implants and imaging devices, and much more. The sectors evaluated and their size in terms of the entire superalloy industry demand are detailed in Table 3.
Industry Percentage of Overall Superalloy Demand
Aerospace/Defense 55
Energy/Power 30
Medical 8
Other 7
Table 3.List of industries included in the bottom-up approachfor projecting cobalt demand in superalloys and their respective share of the sector [INSG, 2013].
For this approach, the superalloy demand was calculated using the primary product in which cobalt is consumed per each of the main industries within the sector. The aerospace and defense industry projected demand was based on jet and aircraft engine demand projections; the energy/power sector demand was estimated using added nuclear and natural gas power projections; the medical and other sectors, as they are small percentages of the superalloy industry and demand information is difficult to track, were estimated using their relative demand in comparison to the other, larger industries.
Industry Dominant Product
Aerospace/Defense Engines
Energy/Power Turbines
Medical Implants (Orthopedic and Dental)
Other Automobiles
Table 4:List of industries included in the bottom-up approach for projecting cobalt demand in superalloys and the product that will represent the industry's cobalt consumption.
The common alloys and their cobalt intensity for each of these dominant products was determined and is summarized in Table 5.
Component Common Alloy Name Cobalt Intensity of Alloy (wt. %)
Engine Inconel 718 1 Engine Astroloy 17 Engine Wasaploy 13.5 Engine Rene 41 11 Turbine Inconel 718 1 Turbine Inconel 706 1
Table 5: List of the dominant products evaluated in the bottom-up approach, the alloy(s) they commonly consist of; and their alloys' cobalt intensity [USGS, 2015].
From 2012-2031 it is estimated that 149,000 engines will be requested/required by the market globally [INSG, 2013]. Constant demand was assumed per year in order to extrapolate that
engine demand will be 180,368 engines from 2012 to 2035 and 298,000 engines from 2012-2050.
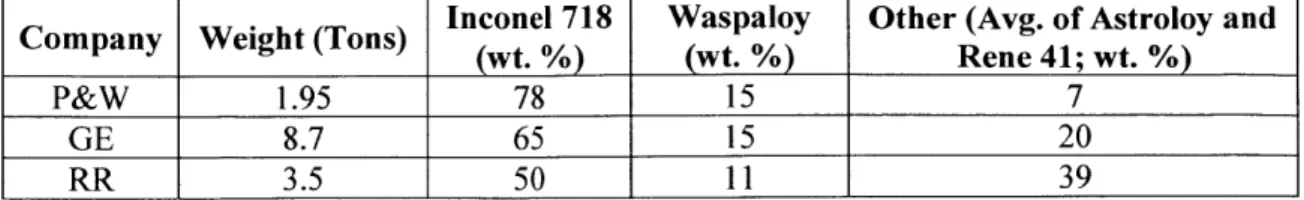
Engines come in different sizes and so an even-number of small, medium, and large engines was assumed. There are three main companies that produce engines for aerospace and defense applications: Pratt & Whitney, General Electric, and Rolls Royce; in order to account for their different component compositions, each engine size was paired with a different producer. The small engines were considered to be made by Pratt and Whitney, the medium engines by Rolls Royce, and the large engines by General Electric.
Inconel 718 Waspaloy Other (Avg. of Astroloy and
Company Weight (Tons) wt. %) (wt. %) Rene 41; wt. %)
P&W 1.95 78 15 7
GE 8.7 65 15 20
RR 3.5 50 11 39
Table 6: The main engine-producing companies, the total weight of differently-sized engines for each company, and the percentages of each alloy that the company uses to make its engines
[INSG, 2008].
Engines are approximately composed of 40-50% superalloy [INSG, 2013]. The number of engines, weight per engine, and then the total associated weight of superalloy (for an engine consisting of both 40% and 50% superalloy) was calculated. The material intensity of cobalt per alloy and the amount of each alloy used by the three different companies was then used in order to determine the amount of cobalt needed in order to meet engine demand by both 2035 and 2050, with the above assumptions. Manufacturers must melt ten times the component weight [INSG, 2008] and so the amount of cobalt required for engines was multiplied by ten in order to ultimately
obtain the value for the demand for refined cobalt for the aerospace/defense industry.
Global Projected Refined Cobalt Demand for Aerospace and Defense (Tons)
Year Upper Demand Estimate Lower Demand Estimate
2035 229,065 154,381
2050 402,653 322,123
Table 7: Projected demand ofcobalt in 2035 and 2050 due to superalloy applications in the aerospace and defense industries.
From 2008-2035 it is estimated that 312 MW of nuclear power will be installed globally [INSG, 2013]. The global gas-fired power generation capability of OECD countries in 2015 was
2,803 TWh (or 1,279,909 MW) [INSG, 2013]. The number of turbines needed to fill both the nuclear projection to 2035 (and also to 2050; constant demand was assumed per year in order to
capacity remain constant and that one full renewal of capability will occur in the time period to 2035 and once again to 2050). Turbines for nuclear power generation come in different sizes and
so an even-number of 15 MW and 30 MW turbines was assumed. Turbines for natural gas power generation come in a variety of sizes; an equal number of 250 MW and 450 MW turbines was assumed. The weights of all turbines are based off of Siemens publicly-available data. All turbines were assumed to consist completely (100%) of superalloys. The material intensity of cobalt per alloy and the amount of each alloy used by the three different companies was then used in order to determine the amount of cobalt needed in order to meet turbine demand up through 2035 and 2050, with the above assumptions. Manufacturers must melt ten times the component weight
[INSG, 2008] and so the amount of cobalt required for turbines was multiplied by ten in order to
ultimately obtain the value for the demand for refined cobalt for the power/energy industry.
Turbine Size Weight (Tons) Inconel 718 (wt. %) Inconel 706 (wt. %)
15 MW 44.25 1 1
30 MW 88.5 1 1
Table 8: Table of the two different wind turbine sizes, their corresponding weights, and their alloys' cobalt intensities that are used in the bottom-up demand projections.
Global Projected Refined Cobalt Demand for Energy and Power (Tons)
Year Demand Estimate
2035 133,668
2050 134,819
Table 9: Projected demand of cobalt in 2035 and 2050 due to superalloy applications in the energy industry.
Research states that the aerospace and defense industries provide 55% of the superalloy sector and the energy and power industries comprise another 30% [[NSG, 2013]. This information
can be used to check how the projections found above compare. According to the aerospace and defense industry demand projections, the energy and power industry demand should be between 84,208 - 124,944 tons of refined cobalt in 2035 and between 175,703 - 219,629 tons of refined cobalt in 2050. The bottom-up projections for the energy and power industries give similar values, providing confidence in the results of the bottom-up projections.
It was found to be very difficult to collect data on the consumption and demand for superalloys in the medical field. The composition of alloys used was readily available, but the weight of implants varies widely based on patient size and type of implant. Since there was little confidence in an accurate bottom-up approach, projections were made using the aforementioned bottom-up projections and the assumption that the medical industry represents 8% of the superalloy sector [USGS, 2015].
Global Projected Refined Cobalt Demand for Medicine (Tons)
Year Upper Demand Estimate Lower Demand Estimate
2035 35,645 22,455
2050 58,568 35,952
Table 10: Projected demand of cobalt in 2035 and 2050 due to superalloy applications in the medicalfield. Minimum and maximum values determined by the minimum and maximum
values derivedfrom engine and turbine demand projections via the bottom-up approach.
The "other" industries that contribute to the superalloy sector were also found to be widely varying and with a lack of available documentation in order to accurately calculate projected demand via a bottom-up approach. Consequently, projections were made using the aforementioned bottom-up projections and the assumption that the "other" industry represents 7% of the superalloy
Global Projected Refined Cobalt Demand for Other Industries (Tons)
Year Upper Demand Estimate Lower Demand Estimate
2035 31,189 19,648
2050 51,247 31,458
Table 11: Projected demand of cobalt in 2035 and 2050 due to superalloy applications in "other" industries. Minimum and maximum values determined by the minimum and maximum
values derived from engine and turbine demand projections via the bottom-up approach.
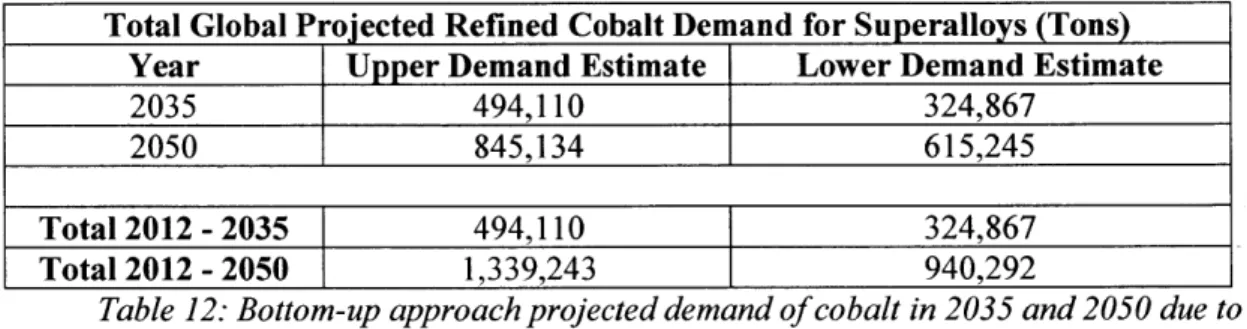
Overall, the total projected demand for refined cobalt in the superalloy sector is summarized in Table 12.
Total Global Projected Refined Cobalt Demand for Superalloys (Tons)
Year Upper Demand Estimate Lower Demand Estimate
2035 494,110 324,867
2050 845,134 615,245
Total 2012 - 2035
[
494,110 324,867Total 2012 -2050 1,339,243 940,292
Table 12: Bottom-up approach projected demand of cobalt in 2035 and 2050 due to cumulative superalloy applications. Total demand up to both years also listed.
The bottom-up approach produces significantly higher demand projections than the CAGR-based projections. The CAGR model predicts a global superalloy demand of 526,088 tons total from 2012- 2035, compared to the bottom-up model's total demand to 2035 value of 494,110 tons. Similarly, the CAGR-calculated demand through 2050 is for 1,176,331 tons, while the product-based approach yielded an estimate of 615,245 tons. The two models produce relatively close demand forecasts for the superalloy sector. It follows that a bottom-up approach yields an overestimate, however the difference in order of magnitude in the 2050 projections may be, at least, partially attributed to the fact that not all products made from cobalt-containing superalloys were accounted for in the bottom-up approach.
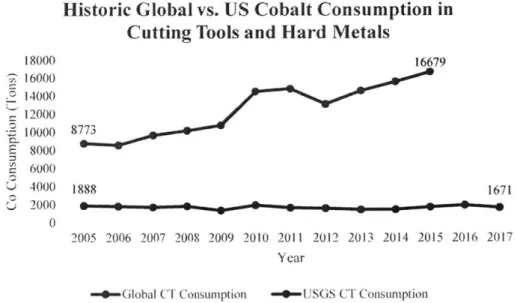
Future Cutting Tool and Hard Metals Demand
The historic data that was used to calculate the CAGR of the global and U.S. cobalt consumption in cutting tools, which includes cemented carbides and diamond cutting tools, and hard-facing metals, which include high-speed steels and cobalt used for surface-hardening of metals, came from the CDI and USGS, respectively.
Historic Global vs. US Cobalt Consumption in
Cutting Tools and Hard Metals
18000 16679 16000 14000 12000 -2 10000 8773 8000 6000 - 4000 1888 1671 0 2000 0 0 2005 2006 2007 2008 2009 2010 2011 2012 2013 2014 2015 2016 2017 Year
-- O-Global CT Consumption --- 1.SGS CT Consumption
Figure 7: Historic data for the global and U.S. cobalt consumption in the cutting tools and hard-facing metals sector. Data provided by the CDI and USGS, respectively.
The global CAGR was found to be 6.64% and the U.S. CAGR was found to be -1.01%. The CAGR values were then used to estimate cobalt demand to the years 2030 and 2050. Due to
the large CAGR value difference, the global and U.S. demand projections for this sector were
Projected Cobalt Demand in Cutting Tools and
Hard-facing Metals in the U.S.
2500 2000 1888 1465 1500 1000 0 500 0 Year
Figure 8: History-based demand projection for cobalt in the U.S. cutting tool and hard-facing
metals sector.
Projected Global Cobalt Demand in Cutting Tools
and Hard-facing Metals
180000 158004 160000 140000 120000 C S100000 E 80000 60000 40000 43719 20000 0 Year
Figure 9: History-based demand projection for cobalt in the global cutting tool and hard-facing
metals sector.
The history-based, or in other words the CAGR-based, projections for cobalt demand from cutting tools and hard-facing metals concluded:
Predicted Global Predicted US Year Cutting Tools and Cutting Tools and
Hard Metals Hard Metals
Consumption (Tons) Consumption (Tons)
2025 31,708 1,541
2030 43,719 1,465
2050 158,004 1,195
Table 13: Projected cobalt demand in the cutting tool and hard-facing metals sector, both in the
US and globally, according to data
from
the USGS and CDL The table above corresponds to the data represented in Figures 8 and 9.The projections made using a bottom-up approach were intended to do so using future product demand projections combined with materials intensity information. No data was able to be found by the author regarding future demand for specific products in this sector; the only available historic and future product demand information was in monetary values. So, the bottom-up approach for this section was performed from two different angles: (1) using cobalt prices and (2) using projected sales revenue and product cost and weight approximations. The remaining part of this section will cover the assumptions that this methodology is founded upon and the resulting estimations.
Within the cutting tool and hard-facing metals industries, alloys that are cobalt-based or have cobalt additives are used in the automotive, aerospace, defense, electronics, construction, ship-building, and other heavy-equipment industries [Grand View Research, 2017]. Cobalt is used to make a variety of products, including but not limited to, bits for lathes and mills, saw blades, turning tools, and high-speed steels. The majority of containing cutting tools are
cobalt-ideal binder because it adheres well to the carbide is thought to reduce void percentage and to improve the material's overall toughness, wear-resistance, and strength at high temperatures [Cobalt Institute, 2018].
One of the main producers of cutting tools is a Swedish company, Sandvik. Sandvik provides annual reports, but no specific information regarding cutting tools sales, total part production, specific part production, specific alloys or alloy compositions used, etc. However, the company emphasizes that the demand drivers for cutting tools are global industrial production and primary metals consumption [Sandvik, 2017]. The U.S Cutting Tool Institute (USCTI) and the Association for Manufacturing Technology (AMT) also produce regular (annual and monthly) reports, which proved more helpful to a bottom-up approach to demand projections. Cutting tool sales, in U.S. dollars (USD) , are reported in the USCTI-ATM reports; cutting tool sales represent cutting tool consumption for ~80% of the U.S. cutting tool industry. Monthly cutting tool consumption from January 2014 through January 2018 was collected and summed in order to get total annual consumption for the time period. The reports also contain yearly growth rates, which were used to determine an average growth rate. The average growth rate was found to be 1.72% and was used to predict cutting cool demand out to 2035 and 2050.
Total U.S. cutting tool demand, in USD, was therefore estimated and needed to be converted into a quantity for cobalt demand. This was accomplished by using industrial per-pound prices for tungsten-containing carbide. The minimum price used was $15.21 (USD/lb.) for a 8 wt.% Co steel alloy [Hudson Tool Steep Corporation]. The maximum price used was $73.43
(USD/lb.) for a 15-17 wt.% Co-bound tungsten carbide [Atlantic Equipment Engineers]. Next, the
projected annual cutting tool demand values (USD) were divided by both the minimum and maximum prices for cutting tools (USD/ton) in order to obtain minimum and maximum quantities
for cutting tools (in tons). Then, the projected minimum and maximum tonnages of cutting tools were converted into refined cobalt demand by multiplying by the minimum and maximum weight-percentages of cobalt assumed in cutting tools - for this analysis it was assumed that the most common industry compositions used fall between 6-10% cobalt.
Total Global Projected Refined Cobalt Demand for Cutting Tools (Tons)
Year Upper Demand Estimate Lower Demand Estimate
2035 93,196 11,583
2050 120,434 14,968
Total 2014 - 2035 1,714,278 213,053
Total 2014 - 2050 3,321,439 412,794
Table 14: Price-based projected demand of cobalt in 2035 and 2050 due to cumulative cutting tool and hard-facing metals applications. Total demand up to both years also listed
The 2014-2035 total demand projected from the CAGR modelling was found to be 733,006 tons, which falls squarely between the upper and lower demand estimates in this approach. The 2014-2050 total demand was estimated to be 2,303,587 tons, which also lies between the upper and lower approximations of this methodology. However, not all cutting tools and hard-facing metals used in industry use cobalt-there are many applications of ceramics, nitrides, aluminum-based alloys, and non-cobalt-containing carbides and steels. If the cobalt-containing cutting tools and hard-facing materials are instead only assumed to represent 30% of the cutting tool industry, the new demand values projected are closer to, but now lower than, the CAGR projected values.
Total Global Projected Refined Cobalt Demand for Cutting Tools (Tons)
Year Upper Demand Estimate Lower Demand Estimate
2035 27,959 3,475
2050 36,130 4,490
Total 2014 -2035 514,283 63,916
Total 2014 - 2050 996,432 123,838
Table 15: Price-based projected demand of cobalt in 2035 and 2050 due to cumulative cutting tool and hard-facing metals applications when cobalt-containing materials represent
30% of the sector. Total demand up to both years also listed.
For the next attempt to a bottoms-up methodology, the cutting tool and hard-facing metals demand was calculated using four of the most common products used in industry in which cobalt is consumed. The cost of each product was found from different industrial retailers and used to covert the total cutting tools demand (USD), from the USCTI-AMT reports, into a number of "units" of each product. The total weight of the product composed of a cobalt-containing alloy (high-strength steel or carbide) was approximated from product specifications (i.e. the turning tool bits total weight for a drill).
Industrial Products Cost of Product (USD) Total Weight of Cobalt Alloy in Product (kg)
Lathe $8,000-$30,000 5
Mill $1,400-$9,500 8.4
Band Saw (blades) $100-$755 5-14
Drills $9,000-$2,300 5
Table 16: List of dominant industrial products, their cost, and the amount of their mass made of a cobalt-containing alloy. Information usedfor bottom-up approach. [U.S. Industrial
Machinery]
It was assumed that each product would represent an equal (25%) of the total cutting tool revenue. The same alloy composition range as in the first bottom-up projection approach (6-10 wt. % Co) was assumed in order to calculate total cobalt demand to correspond with product demand
[ASM International]. Manufacturers must melt ten times the component weight [INSG, 2008] and
so the amount of cobalt required for tools was multiplied by ten in order to ultimately obtain the value for the demand for refined cobalt for the cutting tool and hard-facing metals industry.
Total Global Projected Refined Cobalt Demand for Cutting Tools (Tons)
Year Upper Demand Estimate Lower Demand Estimate
2035 109,493 7,154
2050 141,494 9,245
Total 2014 - 2035 2,014,058 131,599
Total 2014 - 2050 3,902,266 254,975
Table 17: Bottom-up approach projected demand ofcobalt in 2035 and 2050 due to cumulative cutting tool and hard-facing metals applications. Total demand up to both years also
listed.
The demand quantities found through this methodology once again prove that bottom-up approaches are prone to overestimation. In order to mitigate the order-of-magnitude differences in demand projections (compared to the CAGR- and price-based approaches), the cutting tools using cobalt-containing materials were once again assumed to comprise 30% of the entire industry.
Total Global Projected Refined Cobalt Demand for Cutting Tools (Tons)
Year Upper Demand Estimate Lower Demand Estimate
2035 32,848 2,146
2050 42,448 2,774
Total 2014 - 2035 604,217 39,480
Total 2014 - 2050 1,170,680 76,492
Table 18: Bottom-up approach projected demand ofcobalt in 2035 and 2050 due to cumulative cutting tool and hard-facing metals applications when cobalt-containing materials
The 2014-2035 total demand projected from the CAGR modelling was found to be 733,006
tons, which is now larger than the projected value via this approach. The 2014-2050 total demand
was estimated to be 2,303,587 tons, which is also larger than the approximation of this
methodology. The discrepancy in projected values should be attributed to the large errors
associated with both approach methodologies.
Future Chemical Catalyst Demand
The historic data that was used to calculate the CAGR of the global and U.S. cobalt
consumption in chemical catalysts, which include cobalt compounds used in the hydroformylation
of plastics, hydrodesulfurization of petroleum, to catalyze gas-to-liquid fuel processes, and as an
oxidizer in various other applications, came from the CDI and USGS, respectively.
Historic Global vs. U.S. Cobalt Consumption in
Chemical Catalysts
2000( 17273 1500() c 1. 0000) E S50()() 3068 04 0 2005 2006 2007 2008 2009 2010 2011 2012 2013 2014 2015 2016 2017 Year-Global Catalyst Consumption US Catalyst Consumption
Figure 10: Historic data for the global and U.S. cobalt consumption in the chemical catalyst
sector. Data provided by the CDI and USGS, respectively.
The global CAGR was found to be
-0.95%
and the U.S. CAGR was found to be -0.06%.
The CAGR values were then used to estimate cobalt demand to the years 2030 and 2050.
Projected Cobalt Demand in Chemical Catalysts
25000 20000 1 l5000 10000 Sow0{) Year
US Catalyst Consumption U Global Catalyst Consumption
Figure 11: History-based demand projections for cobalt in the chemical catalyst sector.
The CAGR-based demand projections from chemical catalysts are shown in Table 19.
Predicted Global Predicted US Year Chemical Catalyst Chemical Catalyst
Consumption Consumption
(Tons) (Tons)
2025 14,269 3,033
2030 13,604 3,024
2050 11,240 2,988
Table 19: Tabulated cobalt demand projections in the chemical catalyst sector, both in the US
and globally, according to data
from
the USGS and CDI. The table above corresponds to the
A second approach was also taken to approximate the future global demand needs for
refined cobalt in chemical catalysts. The projections were made using a bottom-up approach via future product demand projections combined with materials intensity information. The remaining part of this section will cover the assumptions that this methodology is founded upon and the resulting estimations.
Within the chemical catalyst industry, compounds that contain cobalt are used for a range of applications: to synthesize pre-cursors for polyethylene terephthalate (PET), which is the plastic used to make polyester and bottles/containers for a number of applications; in gas-to-liquid (GTL) processes that turn carbon monoxide and hydrogen gases into liquid fuel; as a drying agent in paints, inks, and varnishes; to remove sulfur from petroleum; and to adhere rubbers and metals to each other for manufacturing purposes. The sectors evaluated and accounted for in this bottom-up approach are GTL processing and plastic synthesis.
For this sector, total refined cobalt demand was calculated by first assessing the future demand of the primary products in which cobalt is consumed per each of the main industries within the sector. The GTL industry projected demand was based on production of current facilities and additional installed capacity demand projections. The plastic industry demand was estimated using future global polyester production estimates.
The common alloys and their cobalt intensity for each of these dominant products was determined. Since there are many different cobalt-containing compounds that can be used for both GTL and plastic processes, a range of cobalt intensity determined by academic literature and
industry reporting will be used for both applications. The GTL catalysts generally contain 5-20 wt. % cobalt [A Sainna and MK, 2016]. The catalysts used in PET production appear to range
from 21-72 wt. % cobalt [Huayou Cobalt]. The minimum and maximum values of these composition ranges will be used in the findings of upper and lower demand projection values.
In 2017, the U.S. Energy Information Administration estimated that 230,000 barrels per
day (bpd) of fuel is produced globally via the Fischer-Tropsch GTL process [eia.gov, 2017]. The
EIA states that this production will remain constant through 2020; however, from 2021-2024
output of GTL-created fuel will rise to 275,000 bpd [eia.gov, 2017]. From 2025-2035, it is
estimated that 405,000 bpd will be produced globally and that by 2040 the production will reach
425,000 bpd [eia.gov, 2017]. A constant demand of 425,000 bpd was assumed from 2040-2050 in
order to project demand out to 2050. Annual production was determined and then summed to provide cumulative total production from 2017-2035 and 2017-2050.
According to Shell, one of the companies with GTL facilities worldwide, 1.6 billion cubic feet per day (bcf) of natural gas feed results in 140 kilobarrels/day of GTL fuel [Shell Global, 2012]. This factor was used to determine the total amount of input needed for the calculated projected production. Research was performed to attempt to discern what amount of catalyst is required per reaction, day, kilobarrel of fuel, or any other relevant reaction quantity. Unfortunately, no data was found to be available regarding relative needed amount of catalyst for this process. So, it was assumed that 1-5% of the total input feed will equal the tonnage of catalyst needed. Total demand for refined cobalt from GTL processing was then able to be determined.
Total Global Projected Refined Cobalt Demand for GTL Cobalt (Tons)
Year Upper Demand Estimate Lower Demand Estimate
Total 2017 - 2035 2,701 135
Total 2017 - 2050 5,538 277
Table 20: Bottom-up approach projected demand of cobalt in 2035 and 2050 due to gas-to-liquid industrial activity. Total demand up to both years also listed.
Next, the cobalt demand from the plastics industry was evaluated. Global polyester production was purported to be approximately 56 million tons in 2010 and was estimated to reach 100 million tons per year by 2020 [NPTEL, 2012]. So, steady and equal growth between 2010-2020 until 100 million tons was reached. 100 million tons was kept constant as the PET demand from 2020-2035; at 2036, it was assumed that the PET demand doubled and then stayed constant at 200 million tons of consumption until 2050. Within the plastics industry, it can be assumed that 60% of PET is used to make textiles (polyester fibers) and 31% is used to make resin for bottles.
It was also assumed that 1% of the final amount of PET produced was equivalent to the weight of pre-cursor necessary for processing. Manufacturers must melt ten times the component weight
[INSG, 2008] and so the amount of cobalt required for tools was multiplied by ten in order to
ultimately obtain the value for the demand for refined cobalt for the cutting tool and hard-facing metals industry.
Total Global Projected Refined Cobalt Demand for PET Cobalt (Tons)
Year Upper Demand Estimate Lower Demand Estimate
Total 2017 - 2035 2.83E10 82,530,000
Total 2017 - 2050 6.43E10 187,530,000
Table 21: Bottom-up approach projected demand ofcobalt in 2035 and 2050 due to industrial PET production. Total demand up to both years also listed.
Total Global Projected Refined Cobalt Demand for Cobalt in Chemical Catalyts (Tons)
Year Upper Demand Estimate Lower Demand Estimate
Total 2017 - 2035 282,96,002,701 82,530,135
Total 2017 - 2050 64,296,005,538 187,530,277
Table 22: Bottom-up approach projected demand of cobalt in 2035 and 2050 due to cumulative chemical catalyst applications. Total demand up to both years also listed
It is apparent that the bottom-up approach for the sector produced a gross overestimate of demand. The overestimation seems to mostly be in the PET-centered calculations. Assumptions in this case may have been too generous; it is hard to know exact values for how much catalyst is required and the material intensity of cobalt in the pre-cursor components used industrially. The 2010-2035 total demand projected from the CAGR modelling was found to be 381,488 tons, which
is significantly smaller than the projected value via this approach. The 2010-2050 total demand was estimated to be 561,887 tons, which is also much smaller than the approximation of this methodology. The discrepancy in projected values should be attributed to the large errors associated with the PET bottom-up approach projection. If the amount of catalyst needed per ton of produced PET becomes 0.1%, then the 2010-2035 total demand projected from the bottom-up approach becomes 28,296,000 (upper) to 8,253,000 (lower) tons and the 2010-2050 total demand projection becomes tons. This is still much too high and more research should be done regarding the underlying issues with the methodology in this case, especially including what percentage of PET production is done with cobalt-containing catalysts.
Future Magnet Demand
The historic data that was used to calculate the CAGR of the global and U.S. cobalt consumption in magnets came from the CDI and USGS, respectively. Two of the four most commonly-used permanent magnets partially consist of cobalt. These types of magnets are used in applications including computer hard drives, wind turbines, speakers, magnetic resonance imaging (MRI) machines, and high-performance servos.
Historic Co Demand in Magnets
7000 6000 406 5000)2
3838
40 .3000 , 2000 826 1000 492 0 2005 2006 2007 2008 2009 2010 2011 2012 2013 2014 2015 2016 2017 Year-0-Global Magnet Consumption -- US Magnet Consumption
Figure 12: Historic data for the global and U.S. cobalt consumption in the magnet sector. Data provided by the CDI and USGS, respectively.
The global CAGR was found to be 2.48% and the U.S. CAGR was found to be -4.23%.
The CAGR values were then used to estimate cobalt demand to the years 2030 and 2050. Due to
the large CAGR value difference, the global and U.S. demand projections for this sector were
graphed separately.
Projected Cobalt Demand in Magnets in the U.S.
900 826 800 700 600 .2 500 9 400 280 o 300 S200118 100 0 nl\ A YearFigure 13: History-based demand projection for cobalt in the U.S. magnet sector.
Projected Global Cobalt Demand in Magnets
14000 11579 12000 10000 8000 7088 6000A 3838 4000 2000 0 - M - 1I r-~ 0'. roll of) '. r~- 0 Year
![Table 5: List of the dominant products evaluated in the bottom-up approach, the alloy(s) they commonly consist of; and their alloys' cobalt intensity [USGS, 2015].](https://thumb-eu.123doks.com/thumbv2/123doknet/14349360.500628/25.918.147.798.443.588/table-dominant-products-evaluated-approach-commonly-consist-intensity.webp)