THE CONSTRUCTION INDUSTRY AND ECONOMIC DEVELOPMENT: THE CASE OF SRI LANKA
by
CAROLINE L. CLARKE
B.A. University of Washington, Seattle (1981)
Submitted to the Department of Urban Studies and Planning in Partial Fulfillment of the Requirement of the Degree of
MASTER OF CITY PLANNING at the
MASSACHUSETTS INSTITUTE OF TECHNOLOGY June 1984
Caroline L. Clarke
1984The author hereby grants to M.I.T. permission to reproduce to
distribute copies of this thesis document in whole or in part.
Signature of Author:
Certified by:
Accepted by:
Department of Urban Studies and Planning May 28,1984
Pro r R- 0 hesis A ervisor
rofessor Ralph Gakenheimer
MASSAC i rgpal Graduate Committee
OF rNLOGYV
AUG1 0 1984
L.R '-\IE3 oEcTHE CONSTRUCTION INDUSTRY AND ECONOMIC DEVELOPMENT: THE CASE OF SRI LANKA
by
CAROLINE L. CLARKE
Submitted to the Department of Urban Studies and Planning on May 28, 1984 in partial fulfillment of the
requirements for the Degree of Master of City Planning. ABSTRACT
The intent of the thesis is to explore systematically many of the notions of the construction industry's role in national economic development in the context of Sri Lanka. Since 1978, Sri Lanka's national development strategy has emphasized three "lead" projects, two of which are construction-intensive. As a consequence, the construction industry's performance is of vital
importance to the attainment of the country's development objectives.
Sri Lanka's construction sector will be scrutinized within Lauchlin Currie's framework of "leading sector" economic growth with the use of general input-output logic. This will allow some
comparisons to be made between other sectors in the economy, thereby addressing the oft ignored question of the sector's relative performance vis-a-vis other candidates for "leading" sector.
Thesis Supervisor: Dr. Ranko Bon
Title: Assistant Professor of Architecture
Acknowledgements:
I would like to thank my supervisor, Professor Ranko Bon, for his intellectual encouragement and guidance throughout the writing of thesis. And many thanks to Professor Lisa Peattie for her critical comments on my work.
TABLE OF CONTENTS
page
1. Introduction... 5
2. Sri Lanka country background... 12
3. National Economic Development: storical Perspective post-independence... 19
4. Construction Industry as Tool for "Leading Sector" Development Strategy...29
5. Sri Lanka's Development Strategy Lead Projects... 36
Liberalization Policies... 43
6. Macro-economic Effects of Sri Lanka's strategy... 46
Construction sector impacts... 55
---7. Method for Evaluation of "Leading Sector" Strategy Preconditions... 63
8. Sri Lanka and Preconditions for "Leading Sector" Strategy's Large sector with high internal multiplier... 75
Growth can be stimulated exogenously... .... 82
Low import component... 87
Large unskilled labor component... 99
Large latent demand... 109
9. Conclusion... 111
10. Bibliography... 121
INTRODUCTION
Since Duccio Turin popularized the notion in the early 70s, interest in the construction industry's role in national economic development has been steadily growing. Construction's
proponents are quick to point out its many attractive charac-teristics. For starters: The industry produces what countries
- especially those at lower levels of development - want most:
infrastructure of all sorts, industrial and commercial build-ings, and housing. It also provides transitional employment for rural immigrants coming to the cities in the process of
industrialization. Moreover, through its substantial multi-plier effects the industry stimulates output, income, and em-ployment in other sectors of the economy.
Many of these ideas surrounding the role of the construction industry are now under discussion in Sri Lanka. Since 1977, the government of Sri Lanka has pursued a two-pronged develop-ment strategy. On the one hand, the governdevelop-ment has introduced
the liberalization policies whose intent has been to promote both foreign and domestic investment. On the other, the
government has committed over 50% of their budget to three "lead" projects that include a huge dam and irrigation scheme, an ambitious housing program, and an investment promotion zone. The first two of these lead projects are construction-intensive; and consequently, the construction industry's performance is of
vital importance to the attainment of the country's development objectives.
strategy and of the ideas about the sector's characteristics mentioned above, construction-led economic growth has become a theme among a certain cadre of Sri Lankan development
people.(1) Shortly after the strategy's initiation, they promulgated the idea that the construction industry not only serviced the lead projects, but also was, itself, a tool for economic development. For example, the Country Monograph, prepared for the ESCAP Project Review and Study of the Human Settlements Situation in the ESCAP Region, notes that,
In relation to the recent past, housing has never been so prioritized, and hence, has never dominated the scene as it does now....While the importance of housing was acknowl-edged [in the past], it was not perceived as an engine of growth, a development resource. (emphasis mine)
Susil Sirivardene (NHDA), p. 7, 1982
This discussion in Sri Lanka has an important precedent in the case of another developing country, Colombia. Lauchlin Currie, in the late 1960s and early 1970s, articulated the
"Leading Sector" strategy which gave the urban housing and development sector the leading role in national development. Currie's strategy was operationalized in the 1971-1974 Colombian National Plan (2) and in 1976, Lisa Parsons Fox evaluated the Plan in her Ph.D. thesis in Economics. (3) She uses static input-output analysis to look at the potential of the housing sector in Colombia to meet the requirements placed upon it by the Plan as well as the strategy's overall perform-ance in development.
The intent of the present paper is to utilize Currie's development theory and Fox's general input-output methodology
as the leading sector in economic growth within the country's present development strategy. In doing so, the construction sector will be scrutinized within an explicit framework of economic growth. This will allow this paper to make some comparisons between other sectors in the economy, thereby addressing the oft ignored question of the sector's relative performance vis-a-vis other candidates for "leading" sector.
The paper will begin with a brief country background, followed by a description of Currie's "leading sector" develop-ment strategy. Next, Sri Lanka's national development strategy will be outlined and its macro-economic impacts will be
summarized. Input-output analysis is presented as the most ap-propriate tool for evaluating Currie's "leading" sector theory. And finally, using the basic input-output model as well as material from authors who incorporate input-output logic (both specifically for Sri Lanka and more generally), the country's construction sector is formally reviewed.
SCHULTZ
LEADING SECTOR DEVELOP-4ENT STRATEGY:
CURRIE
SRI LANKA
DEVELOP-MENT STRATEGY:
LIBERALIZATION AND
LEAD PROJECTS
SRI LANKA'S EXPERIENCE POST-1977
MACRO IMPACTS
AND MICRO IMPACTS
INPUT-OUTPUT ANALYSIS EVALUATION TOOL REVIEW OF THE CONSTRUCTION SECTOR CURRIE FOX
Footnotes: Introduction
(1) The Ministry of Local Government, Housing, and
Construc-tion, in particular, adopted and promoted the idea. (2) Because of the short time during which the 1971-1974 National Plan was actually operating, it is difficult to draw solid conclusions regarding the performance of the "leading sector" strategy in the Colombian case.
ali t i ft A. J4j A 1a
j
-alA
Manr10 8 642 0 10 201 *Viavuniya "~Tricomuualee
Anuradhapura Kantalo Kaipltlya a PutiLj&M Kekirawai lOlllalatd Eravlur a CGalewala7N
Ialejf Skuaji ChILaw at l Callaptlyma K uniregala3~i P0aatp MsttAlo Kaintsuual
N& Arat- *Wattegamva ,amnzasrm
Wennappuwai DOOiabstlttia . le(A* aay
Koctachtlaade 0 ei et
SeeInst 1 RWarlanwel.a
Nuwarsl, £ly l0tttiatgala
a pliliea
Moratl tuta lapa l
Keew*t £ itt'a
Pa sad em an~ Bin a ag m Ru Ratn&Paur Krs I~dul
wadduw 0 lLaallky lit 1 .MaeagI
K AIU&A~~~r& I ttartaK lwclaIL lsaaw
blorawwa L 0 llatiulal
K Beratte a Mh rg onaR kw Paadapts a andaragam
WAduwa * aonPdr
a Plmadullat
Aluaam Rntota11 0A IIAnt a
u--- c- 4
sJ
-,f ti 4 .4I -. - - -. .4.i.n /% Tv-4-
to
2
- - * --- - - P-11Sri Lanka Country Background
Sri Lanka is the island nation off the southern tip of
India. It has total area of 25,332 square miles. Colombo is the
capital city with close to one million inhabitants.
The country has two geographic regions: a flat plain
-making up 4/5ths of the country
-
encompassing the entire north
half continuing around the coastal regions in the southern
half. The south-central part of the country is hilly and
mountainous.
Population
The total population was estimated to be 14,720,000 in 1980
with an annual rate of growth of 1.7%.
The density is greatest
in the southwest portion of the island with 22% of the
popula-tion living in Colombo district. The country is overwhelmingly
rural with the urban component estimated to be 27% (with an
annual growth rate of 3.7%).
Four cities have populations
greater than 100,000, four between 50,000-99,000, and nine
between 25,000-49,000.
Because welfare, health, education and development
expendi-tures are widely spread throughout the country, the rural to
urban migration is considerably less than in other developing
countries of similar income level.
The urban populaton is
currently 21.5% of the total population with a growth rate of
approximately 2.5% per annum which is low by comparison with
other countries in the region.
The ethnic majority of the country are the Sinhalese
consti-tuting over 70% of the total population.
On the basis of
geog-raphy and culture, the Sinhalese can further be classified into two groups - the low country Sinhalese (along the plains of the south and west of the island) and the Kandyan Sinhalese (in the interior highlands). The second most numerous group - the
Ceylon Tamils with the Indian Tamils (who are of much more recent orign to the island and are now primarily plantation workers in the Kandyan highland) - suffer from minority status and have never been fully assimilated into the social and cultural mainstream. They populate the Northern Province with their heaviest concentration on the Jaffna Peninsula and along the east coast; a significant population is also found in the City of Colombo. Table 1 ETHNIC COMPOSITION (1971) (000) (%) Low-Country Sinhalese 5,446 42.8 Kandyan Sinhalese 3,701 29.1
Sri Lankan Tamils 1,416 11.1
Indian Tamils 1,195 9.4
Sri Lanka Moors 824 6.5
Indian Moors 29 0.2
Burghers and Eurasian 44 0.3
Malays 42 0.3
Others 14 0.1
*no information available since 1971
These ethnic groups are referred to as "communities" - a term frequently used in South Asia to mean a people sharing in a common self-identity and thinking of themselves as a unique group on the basis of a separate religion, language, social organization or ancestral origin. The Sinhalese are Buddhist and their language - Sinhala - is of Aryan origin; the Tamils, on the other hand, are Hindu and speak Tamil, the oldest and
most prominent Dravidian language of South India.(4)
Despite numerous integrative pressures, the "communities" have remained separate and have been the most important source of division and disruption in Sri Lankan politics. Since inde-pendence in 1948, the most serious conflict between the two groups was over the official language question. Much blood was shed over the decision in which Sinhala was proclamed the
official language of the country with the "reasonable use" of Tamil permitted in the northern and eastern provinces.(5) Education and administration is carryed out in both languages, with English as the second language in all cases.
Political Parties
Since independence, political power has alternated between the two principal parties, the United National Party (UNP) and the Sri Lanka Freedom Party (SLFP). In 1977, the UNP retook power; they are right-of-center party holding strong constit-uents in the middle class and non-communal groups. Its econ-omic policies are conservative and its foreign-policy Western-oriented. From 1960 to 1965 and again from 1970 to 1977, Mrs. Bandaranaike was in power. The first time she led only the
SLFP - a left-of-center, non-marxist party whose primary appeal is with the lower-middle class, Buddhist groups, and Sinhalese intellectuals and professionals. They support a non-aligned (Afro-Asian-oriented) foreign policy; the nationalization of banks, publishing, heavy industry, import trade, and
plantations; and Sinhala and Sinhalese supremacy. The second term, Mrs. Bandaranaike led the United Front (UF) - an alliance
of the SLFP, the Lanka Sama Samaja Party, and the Communist Party. There are six other legal opposition parties - Ceylon Democratic Party, Tamil United Liberation Front, Lanka Sama Smaja Party, the Mahajana Eksath Permuna, Sri Lanka Communist Party, Jatika Vimukthi Peramuna, Sri Lanka Freedom Socialist Party.
The 1972 constitution of Sri Lanka was replaced by a new one in 1978:
The new constitution promulgated in September 1978 embodies three major amendments to the 1972 constitution. Its main feature is the presidential system of government, which brought to an end almost half a century of Westminster style parliamentary government. Until 1978 the president was the constitutional head of state while the real power lay with
the cabinet. Under the new system, the president is the head of state, head of the executive, head of government and commander in chief of the armed forces. The powers of the prime minister and his cabinet have been drastically reduced. Perhaps the most significant feature of the new constitution is the introduction of proportional representation, and the elimination of by-elections (vacancies will be filled by the next man on the party list at the time of the last general election).
Quarterly Economic Review of Sri Lanka, Annual Supplement 1983. pg.3.
Economy Table 2
Main Origins of Gross Domestic Product, 1982
(% of total)
Agriculture, forestry & fisheries 27.4
Mining & manufacturing 17.3
Construction, trade, transport & utilities 36.7
Banking, public administration 18.6
Total 100.0 ($4, 403.8 mn at current
prices)
Source: QEROSL The economy of Sri Lanka is based in agriculture. Tea(6),
the major food crop. Of the total cutivated land, the export
crops occupy nearly 50% and paddy 40%. The remaining area is planted with cocoa, citronella, cardamon, tobacco, maize, manioc, chillies, peppers, and tropical fruits.
The mining sector produces a fair amount of precious and semi-precious stones. The setting up of a Gem Corporation in the early 1970s captured the previously unofficial foreign exchange earnings from the smuggling activities. Besides the gems, the mining sector is inactive as the country has no coal or oil.
Manufacturing industry has been gaining in importance vis-a-vis agriculture in the economy. In 1982, it contributed nearly 16% to the GDP (current prices) against 27% contributed
by the agriculture, forestry, and fishing sector. Primarily
concentrated in and around Colombo, industrial activity pro-duces mostly consumer goods although more recently a small steel plant, an oil refinery, and textile and garment
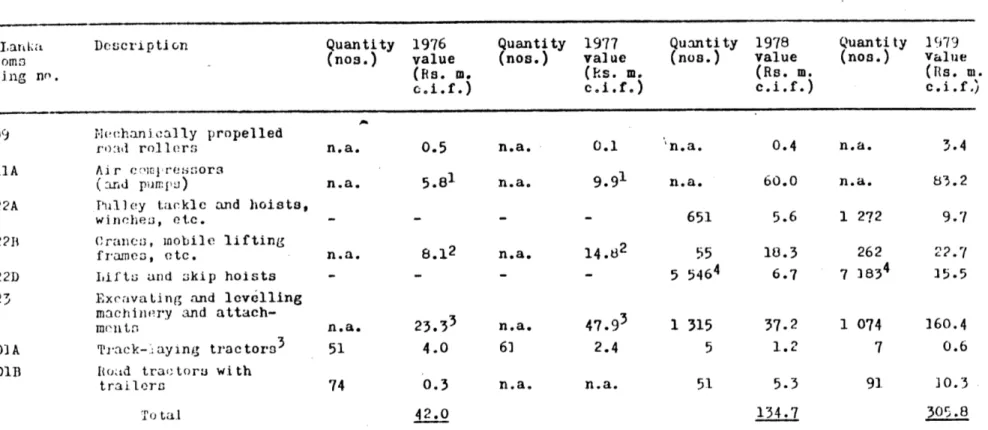
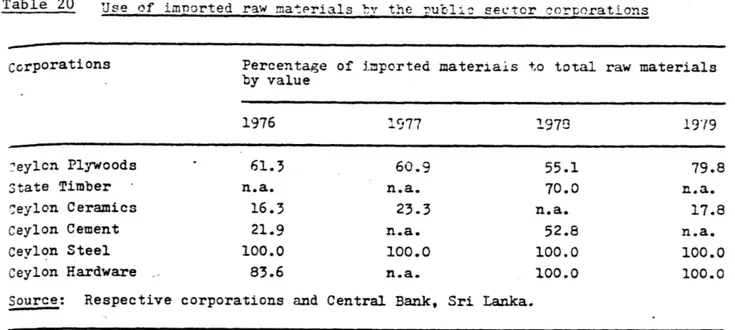
produc-tion have also entered the scene. Industrial activities depend heavily on the imports of raw materials and components for production. Industry contributes 31% (23% when manufacturing
is considered separately) to the GNP, employs 15% of the labor force, and its annual growth rate for the period 1970-77 was 3.2% (1.2% for manufacturing). Reliable employment and wage statistics do not exist. According to the Quarterly Economic Review of Sri Lanka (page 5), however, in 1971 the total labor force totaled 4.5 million people of whom 3.6 million were
fishing.(7) The unemployment problem was severe throughout the 1970s.
History:
1505 - 1656 Portugese occupation of coastal areas 1656 - 1796 Dutch occupation of coastal areas
1796 - 1802 Dutch possession administered by British East India Company.
1802 British Crown Colony established in coastal areas 1815 Kandyan convention establishes united Ceylon under
British rule.
1948 Ceylon independence.
1970 Mrs. Bandaranaike's coalition government: SLFP, LSSP, and Communists
Business Acquisition Act 1972 Land Reform Act
1977 UNP wins election (President Jayawardene)
Footnotes: Sri Lanka Country Background
(5) Again last summer violence erupted over the language issue/
community issue. (4) Kearney, 1967.
(6) Not counting China, Sri Lanka ranks second in the world
after India in tea production.
(7) 2.4 million were employees, the rest were self-employed.
National Economic Development: Historical Perspective (post-independence)
For develoment economists, Sri Lanka has been an interest-ing case to study because of its strong emphasis on social welfare while at the same time maintaining a relatively high
growth rate. The indicator often quoted in this regard is the so-called physical quality of life index (PQLI); Sri Lanka ranked the highest of any other country in its income range. Income distribution is another indicator of social welfare. Sri Lanka's Gini coefficient has improved dramatically since inde-pendence (at least until 1978).(8)
Table 3
Size Distribution of Income
1953 1963 1973 1979/79
Gini coefficient 0.46 0.45 0.35 0.44
Income shares of:
lowest quintile 5.07 3.87 4.97 3.76
highest quintile 56.65 55.25 45.89 54.30
Source: Statistics Department, Central Bank of Ceylon. Report on Consumer Finances and Socio-Economic Survey 1978/79: Sri Lanka. Colombo, March 1983.
Some additional social welfare indicators are included in Table 4, ranging from pre-independence to 1980.
Table 4
celect -d Social Indicators Source: Stern
Item Adult literacy:
School enrollnen
Life expectancy Infant mortality Crude birth rate Crude death rate
Rate of natural popula-tion increase Unit 1946 1953 (ercent) 58 65 (e rc :ent of!-ags 5-14) 41 58 (years) 43 56 (per '000) 141 71 (ner '000) 37.8 38.7 (per '000) 20.2 10.9 (percent) 1963 1970 1977 72 78- 86 65 63 56 34.3 8.6 99 66i/ 48 29.4 7.5 8 0 69 42 27.9 7.4 1.7 2.8 2.6 2.2 2.1 2.2
Notes: -for 1971; - for 1976; -1for 1978.
Source: Central Bank of Ceylon and World Bank, World
i982.
Develooment Report,
In addition, by looking at the Lorenz curve for household income (9) shows the positive effect of government social wel-fare intervention on the income distribution. See Table 5.(10) Table 5
Percent of in omne
Percent of households
Primary Income --- - - - Psax in. iom
- - - - - - - - - - - -I . o"it. .4f f Juluf "ru-
sirst v MA.dI . ( 197A IM),
fill Source: de Melo 1. 2. 3. 4. 5. 6. 7. 1980 9 4S/ 66 44 27.8 6.1
Since Sri Lanka's independence, political power has
alter-nated between the two
major parties. Generally, it can be
argued that the two parties together have managed to complement
each other's development policies - the SLFP redistributes
assets and the UNP concentrated on the agricultural and
con-struction sectors - with the result of the "good" development
record mentioned above.
According to D. M. Snodgrass(11), after 1948 the economy
shifted from export-led growth toward what he calls
"transitional" growth, characterized by an emphasis on
protec-tion and industrializaprotec-tion. However, rather than stressing
economic growth and diversification, the
new
administration
stressed immediate increases in social welfare spending over
public investment. Beginning in the mid-1950s, welfare
expen-ditures ranged between 35% and 45% of governments current
expenditures continuing for 20 years.(12) During these early
years government resources grew
-
partly because of higher
estate taxes and partly because of increased borrowing -and
were spent on food subsidies, education and health care.
However as the 1950s progressed, the terms of trade for
Sri Lanka declined vis-a-vis the rest of the world. The
government, in an effort to compensate for low private sector
activity increased its participation in industrial development
and encouraged industries that used domestic resources in order
to decrease the balance of payments pressures. In agriculture,
the government pushed for the increase in food production
-primarily rice - to decrease reliance on food imports.
1970s contr-ibuted to the stagnation of overall production and decreased paddy harvest.
The administration in power from 1970 to 1977 - Mrs.
Bandaranaike's Sri Lanka Freedom Party (SLFP) - was socialist in nature with a functioning parliamentary democracy. In alliance with the Lanka Sama Samaja Party (LSSP) and Communist Parties,(13) the SLFP administration emphasized the redis-tribution of income and wealth through policies of economic nationalism. Mrs. Bandaranaike's administration also favored import substitution through the use of quotas and licences.
During this period, two major policy pushes - the Business Acquisition Act of 1970 and the Land Reform Act of 1972 - set
the momentum for the implementation of the "Mrs.
Bandaranaike's" platform. The Business Acquisition Act allowed the government to nationalize existing businesses. In 1972, the Land Reform Act placed a ceiling of 25 acres of paddy land or 50 acres of other land on all holdings. Over the next two years 550,000 acres were taken over and converted to coopera-tive settlements. The second phase of the Land Reform saw all plantations nationalized. At its completion in 1975, the Land Reform Act had given the government 63% of all tea lands, 32% of all rubber lands and 10% of the coconut producing acres.(14)
During the 1970s, the country's growth rate decreased dramatically; some argue that too much emphasis was placed on equity at the expense of growth. The extent to which welfare expenditures contributed to the decrease in investment, the in-crease in unemployment and slower growth in overall income has
been a point of great contention.
Also at this time, Sri Lanka was facing a number of serious economic problems -- not the least of which was an increasing international indebtedness made especially acute by the increasing cost of fuel (Sri Lanka has no oil or natural gas reserves). After 1973, there was general world inflation which affected Sri Lanka to the extent they were dependent on
imports.
For the housing sector, the legislation during this period centered around the continunation and strengthening of the prior rent control act, although now all houses were to be
included.(15) In addition, the Ceiling on Housing Property Law was introduced in 1973 which granted the government power to acquire all housing units not required by the owner for his/her
family's use. The intent of the above legislation (coupled with several other acts to prevent the exploitation of
low-income tenants) was to promote "as broad-based an ownership of housing property as possible aimed ultilmately at a 'more equal' distribution of wealth and the removal of glaring
disparition in incomes".(16) The result, however, was a severe restriction of private sector housing development in general, with the small exception of luxury home building which
continued because of particular exemptions that were provided under rent restriction. Although tax incentives to encourage private construction had been in place during the 1970s, relatively little housing was built by the private sector because of the lack of long-term finance and the disincentives outlined above.
Instead,, the administration sought to increase the housing stock through the expansion of public sector production of housing. At this time the Direct Construction and the Aided Self-help programmes were introduced - the former to provide rental units for lower and middle income urban families, the latter program to provide building materials and some services for low-income rural families. The idea of slum and shanty upgrading was also included in the housing program for the first time. Under the Aided Self-Help Programme, only 1,300 units were completed during 1972 and 1976 and less than 2800 under low-cost direct construction.(17) Loans to private home builders (from the National Housing Fund) however did amount to 20,000 loans.
In 1977, the UNP won the election by a wide margin, promis-ing new policies aimed at stimuatpromis-ing economic growth and
creating a large number of jobs. Immediately, the new govern-ment introduced a major economic liberalization campaign (in the classical IMF style) aimed at reversing the past admini-stration's policies and creating the conditions that they
argued would be necessary for sustained faster economic growth. The rupee was devalued and domestic price and import controls were eliminated in order to stimulate the economy in the short-run. High priority was given to attracting foreign investment. At the same time, increased emphasis was placed on higher food production; in this effort to shift resources from consumption to investment food subsidies were cut drastically.(18) In addition to the liberalization policies, the government's
medium term strategy was to create new jobs - on the order of one million. The Public Investment Program (PIP) designated three "lead projects" - the Accelerated Mahaweli Project, the Investment Promotion Zone, and the Housing, Water, and Urban Development Project - to meet these employment targets as well as to "release the economy from the 'vicious circle' of low
investment and growth".(19)
In the realm of distribution of the benefits of growth
throughout the population, the UNP's emphasis on social welfare is primarily of the "trickle down" variety rather than asset redistributive as were the prior administration's. The Public Investment Plan for 1983-1987 focuses on increasing employment through the stimulation of the private sector to expand its opportunities and the quality of life for the majority of the
country's people who live in rural areas through the develop-ment of the agrucultural sector. The PIP also emphasizes the
improvement of the provision of human settlements and social sevices such as health an education. And for the urban poor, the intent is to provide basic services and opportunities of increased income and employment. These distribution efforts notwithstanding, Sri Lanka's current development strategy can best be characterized as one of unbalanced growth.
Sri Lanka's economy and planning environment encompasses four levels: the national economy, the different sectors of the economy, a collection of programs, and a series of projects. In the small island economy, the relationships between the four levels are direct and immediate. So that when the Housing, Water, and Urban Development Project was initiated, demands
were immediately put on the construction sector for a wide range of products in both urban and rural areas. In turn, demands were placed on national economic resources. Because of its small size, Sri Lanka's national economic development
strategy truly is led by the three projects. And given the
highly construction-intensive nature of two out of the three
public projects, there have also been a number of people in Sri Lanka characterizing this development strategy as
"construction-led" economic growth.(20)
Many developing countries have recognized that the products of the construction sector - infrastructure,
commercial and industrial buildings, civil engineerng works, and so on - are important for the attainment of national objectives. However, the case is being made that Sri Lanka's development strategy utilizes the construction sector itself as a means for economic development. This argument for the con-struction sector as the means or "engine for growth" in the national economy has been made by Lauchlin Currie (late 1960s early 1970s) in his "leading sector" strategy for economic development.
Footnotes: National Economic Development: Historical Perspective (post-independence)
(8) It is not the intent of this paper to explore the problems
in the use of Gini Coefficients.
(9) P.J. Alailima (1978) "Fiscal Indices i Sri Lanka,"
Provisional Draft WEP 2-23/WP69. Geneva: International Labour Organization, as cited by de Melo, p. 146.
(10) Lorenz curve shows the percent of total income accruing to households ranked from poorest to richest along the y-axis. The degree of inequality in the income distribution is
illustrated by the ration of the area between the 45o line and the Lorenz Curve to the total area beneath the 45o line.
(11) Snodgrass, 1966.
(12) See Pyatt, Roe, et al., 1978.
(13) LSSP, a Trotskeite party that advocates nationalization of
the economy but opposes communalism; SL Communist Party is essentially pro-Moscow; an interesting aside: The communists
have always been incorporated into the existing political structure.
(14) According to the critique of the present government, both were poorly executed resulting in decreased efficiency levels on agricultureal estates and decreased capacity utilization in industry.
(15) See USAID, 1981, p. 62, for summary of legislaton 1942 to present.
(16) ibid., p.63. quoting Marga Institution housing study. (17) ibid., p.64.
(18) Since World War II, food subsidies have been an important feature of the welfare economy. Just before the 1977 election, the subsidy program accounted for 1/5 of the government's
current expenditures. Prior to 1977, nearly every Sri Lankan received one pound of rice free and three pounds at a subsi-dized price; wheat flour, sugar, and infant milk were also subsidized. Post 1977, the rice ration was limited to the poorer half of the population (7 million). The sugar ration was only given to children under 12 years old of familes still elegible for rice ration. Other foods continue to be rationed.
(19) PIP, p.14. There was also a fourth lead project - the New Administrative Capital at Kotte. However, this project was scaled back drastically - only one parliamentary building was built - and thus, assumes very little importance in the
development scheme and will not be dealt with in any detail. (20)Ganesan, Vedagiri, Sirivardana, for example.
Construction Industry as Tool for Development
Currie's theoretical approach to economic development focuses on the interrelationships between the growth rates of specific sectors and the over-all growth rate of the economy. Keynes' focus was more generalized; he looked at the impact of increased demand on the economy as a whole. However, Currie, in the Sayian tradition, looks at real (physical) output of a particular sector and its requirements for additional output of other sectors of the economy. For Currie the development
dilemma can be posed in terms of an "interlocked circle"
-Liebenstein's "low level equilibrium trap". An increase in overall demand is the result of an increased rate of output in a particular sector. This increased rate of sectoral output is a function of aggregate demand which is, itself, a function of
the overall growth rate. To break this interlocked circle, Currie proposes the leading sector whose growth can be
stimulated exogenously so that the circle is broken separately from an increase in aggregate demand.
The "leading sector" approach to economic growth
represented a substantial break from the supply-side theories and approaches to the interlocked circle dilemma put forward by Currie's contemporaries. For example, to break out of the "interlocked circle," the supply-siders wish to overcome par-ticular constraints on the supply-side. That is, in many sectors, monopoly conditions lead to decreased production
further resulting in the underutilization of capital and equip-ment; market uncertainties exist - especially for export
sectors; labor disputes; political considerations and
uncertainties; and in some areas, prices are controlled below costs. For Currie, on the other hand, the constraints on the demand side far outweigh the above supply-side factors in
explaining and providing avenues for addressing the need to en-courage investment.
...the most effective way to raise the overall rate of growth in both output and employment is... to remove barriers or provide incentives to investment in sectors in which there is actually a large latent demand that can be exploited, so that an increase in investment and subsequent output can find a market without resulting in a depression in prices and incomes in the sector. Such sectors would generate a rise in the overall rate of growth.
Journal of Economic Studies, 1974.
According to Currie, the constraints on demand result from factors which impede mobility of resources and the labor force, create a grossly unequal dualist economy and thereby result in underutilization of labor and capital. Institutional factors such as obstacles to the channeling of savings to urban con-struction, particular controls that impact production
capabilities, and legislation which tends to decrease demand for labor, are a few examples that result in a deficiency of demand. As long as these and other constraints on the demand side exist, any increase in monetary demand - in the Keynesian
tradition - will simply increase prices rather than produce higher physical production - the objective in the Sayian tradition.
This emphasis on the demand constraints is not to say that Currie does not anticipate that critical supply constraints will arise. However, he sees supply constraints playing a role
only in the context of particular sectors and usually after the growth is underway rather than as the major constraint on
exogenous sector stimulation altogether. Thus, Currie fully expects that bottlenecks may halt expansion of the leading sector, for example, and will have to be broken in order for growth to continue.
This strategy is meant to benefit those countries experienc-ing a high rate of population growth with a large proportion of the population in agriculture resulting in disguised mass rural unemployment and excessive competition in agriculture. Insuf-ficient labor mobility exists along side of large degree of underutilization of capital equipment in many of the important industrial sectors. These countries must also have a strong entreprenuerial class, basic public services, a "reasonable" industrial base and the potential for agricultural technifica-tion; and finally, have sufficient resources that, if
effeciently exploited, would permit a good standard of living.(21)
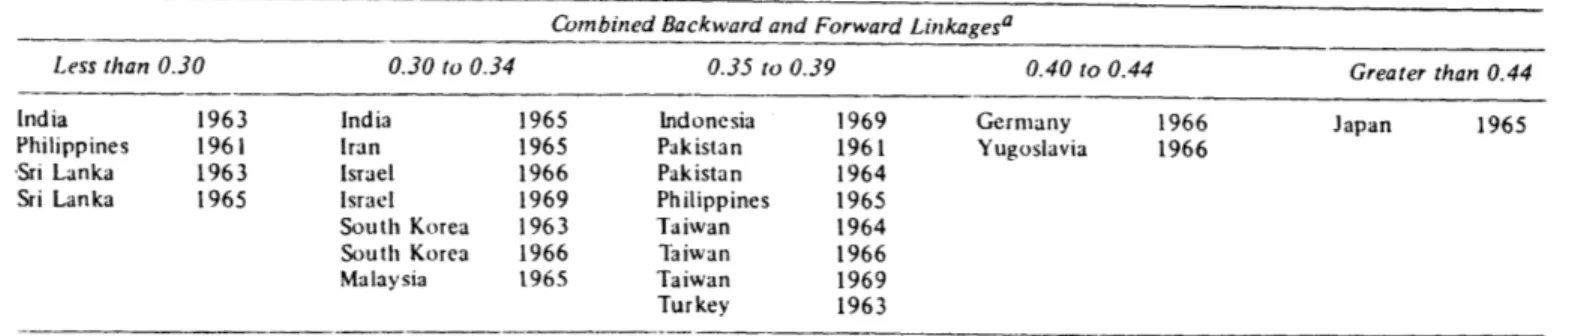
Currie outlines the specific preconditions necessary for a sector to act as the leading sector. 1) The sector must have a high internal multiplier and be large enough to have a substan-tial impact on other sectors of the domestic economy; 2) its growth must be able to be stimulated exogenously. 3) The sector must have a low import component, 4) a fairly high component of unskilled labor, and 5) represent a large latent demand to be actualized (or a high income or price elasticity of demand).
straight-forward. The first two come directly from the above discussion concerning the Sayian approaches to growth which requires sec-toral linkages for real output stimulation. In addition to direct purchases of the industry, an increase in final demand for the construction industry will also result in indirect increases in the output of all the industries as additional goods and services are, in turn, required by the construction industry's direct input industries. The third precondition for the low import component is necessary - perhaps crucial - in order for the leading sector to be, in effect, leading some-thing at all. To the extent that leading sector utilizes domestic resources, increased demand in the leading sector will then be "pulling" the rest of the domestic economy rather than the economy of exporting countries. Obviously, the greater the integration of the national economy, the greater the total -direct and in-direct - output stimulated by an exogenous growth in the leading sector. Imports represent leakages that, when they cannot be offset, weaken this pull effect on the rest of the economy.
A large latent demand that can be actualized is the key for
sustained growth of the leading sector. This change from latent to effective demand is unleashed through the removal of demand barriers.(22) In addition, this latent demand concept relates to income and price elasticities in the following ways:
... the larger the leading sector in relation to the total,
the less rapid need be its rate of growth to maintain the high overall rate. On the other hand, the larger the sector, the less the "latent" demand and the more dependent we become on income and/or price elasticity of demand for
more rapid must be its growth to make a significant impact.
...
the greater the elasticity of demand for the
products of the leading sector, the greater the
estent and the longer the period the "latent"
mar-ket can be exploited. The concepts are
supplement-ary and complementsupplement-ary.
Journal of Economic Studies, 1974, pp. 6,7.
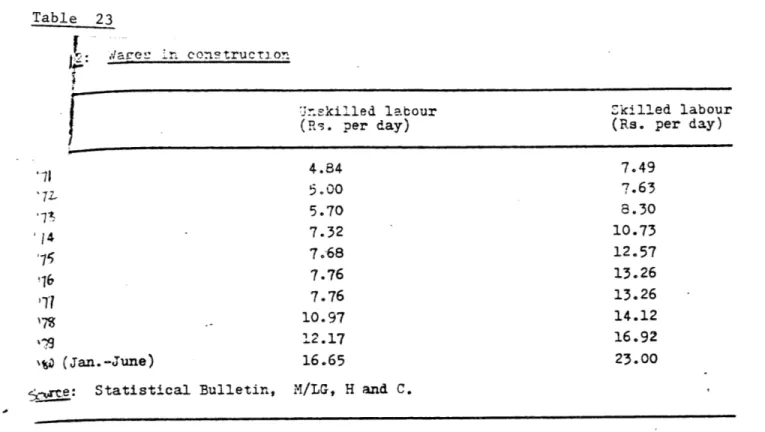
The relatively high component of unskilled labor is not a
primary precondition for a leading sector but does, however,
play a role. The unskilled nature relieves, to some degree,
the mobility problem because little skill or education is
required thereby allowing for easier and faster labor
absorp-tion of what Currie sees as primarily rural labor into the
sector. In addition, the higher unskilled component generally
means that productivity can be improved fairly quickly and
easily by upgrading the labor force.(23)
When the above preconditions are met, the leading sector
development strategy is theoretically quite simple.
Currie had
in mind the urban housing and development for the leading
sector. Thus, with reorganizing the consumer financing process
and institutions, latent demand would be actualized.
The
sub-sequent housing boom would provide dwelling units, create jobs,
generate incomes and savings, as well as encourage spending in
other sectors - foodstuffs and clothing (what Currie calls
"mass consumer goods"), plus related industries such as
house-hold furnishings and plumbing equipment. The effective demand
would also allow producers of these basic consumer goods to
expand their current operations without large infusions of
capital or foreign exchange (because they are primarily
domestic industries). Thus, through the mobilization of savings
into the urban housing sector the development strategy aimed to
"jolt" the overall economy (through direct and indirect inter-industry linkages) into a higher level of activity and growth.
The next section will describe the Sri Lankan post-1977 Development Strategy. An assessment of the strategy's impact on the general economy (24) and more specifically, on the construction (and housing) sector will follow. The last sec-tion will use Fox's and others' input-output methodology to evaluate the performance of Sri Lanka's construction sector relative to Currie's preconditions for the leading sector.
Footnotes: Construction Industry as Tool for Development
(21) Taken from Fox, 1976, page 25.
(22) The importance of the form it takes will be discussed later.
(23) The mobility problem as dicussed by Currie refers to
labor's ability to move into increasingly better-paying jobs; this subject will be discussed later.
(24) Please note that this must be a preliminary assessment as these are relatively recent policy directions.
Sri Lanka's Devleopment Strategy Lead Projects
The national economic and social development objectives are formulated in The Public Investment Program (PIP) prepared by the National Planning Division of the Ministry of Finance and Planning.(25) The Program covers a five year period and is designed as a "rolling plan"; that is, it is revised and moved forward each year. The current Program, for example, is the fifth in a series of the present government and covers the years 1983 to 1987; the next Program will cover the years 1984
to 1988. (26)
The total resources available for public investment equals 57% of the total investible resources. In 1978, the government initiated several new projects (the Accelerated Mahaweli
Project being one and in 1983 it still represented 34% of total public investment). However, in 1981, because of resource scarcities, the government declared that no new projects would proceed until the ongoing projects reached "a satisfactory stage of completion". Some of these ongoing programs them-selves have been rephased or deferred. From 1978 the PIP has been largely dominated by the Mahaweli Development and the Housing, Water, and Urban Development Projects (HWUD), both of which are expected to reach "satisfactory stages of completion"
by 1985 and therefore to allow for the inclusion of new
projects.(27)
Beginning in 1977, the Plan focused on building up infra-structure it felt to be necesary for "rapid modernization".
The largest infrastructure scheme - the Mahewli Development Project - aims to use the Mahaweli River for irrigation and power. The portion of the river used by the project is capable of irrigating 360,000 hectars, 270,000 hectars of which would constitute new agricultural land. The power potential of the Project was estimated to be over 500 MW. In addition, the Mahaweli Master Plan also includes a major agricultural settle-ment scheme to resettle over 140,000 families. Originally, the
project was allowed 30 years for its full implementation through phases I, II, and III of the Mahaweli Master Plan. Work began under Phase I in 1970 and included the construction of the Polgolla dam, tunnel, and power plant and the Bowatana dam, tunnel and power plant. Some of the work was still on-going in 1978. The new government in 1977/78, in effect,
attempted to complete this 30 year project (minus the completed work) in 6 years; the Accelerated Mahaweli Project was
initiated at this time.
However, the government soon began scaling back the size of the project because of two related circumstances: one, because of escalating costs, and two, because of criticism levied by the IMF, the World Bank, and the aid-dispensing countries concerning the unequal resource investment in the construction-intensive projects, in general.(28) The project was to be financed by foreign grants and low-interest loans. In 1978, the total estimate for the project was Rs.11 billion; in 1980 (February) the cost had increased to Rs.20 billion.(29) Because of these cost escallations and the donors' criticisms, the government decided to limit the project to three instead of
five reservoirs. Total investment allocated was Rs.18 billion from 1980-84 according to the PIP for that period. However, from looking at Table 9.1 for the years 1983-87, the PIP has allocated Rs.29.9 billion to the Project; this figure repre-sents 24% of total public investment for these years. This is roughly the same percentage of total investment that was allo-cated for the project during 1970 to 1977.(30)
By increasing the output and productivity of the agri-cultural sector, the Mahaweli Project is also intended to directly improve the export outlook for the country. The
government relies heavily upon agricultural products for export earnings. Approximately 55% of Sri Lanka's total land area is under cultivation. Agriculture employs approximately 50% of the labor force, contributes 30% of the GDP and its annual rate of growth between 1970 and 1977 was 2.3%. (31) Tea, rubber, coconut have been the major export crops. The relative posi-tion of these three major export crops dropped from 94% of total export earnings in 1971 to less than 50% in 1982;(32) also according to page 23, the value of agriculture is now
equivelant to 34% of the foreign exchange earnings. This a result of both an absolute decline in these exports as well as the relative increase in the export of other products.
Agriculture - a traditionally productive sector - was suffer-ing due to the shortage of public investment beginnsuffer-ing in Mrs. Bandaraneike's administration; tea, rubber and coconut produc-tion continued to decline during 1977-1980.(33) All
construc-Table 9.1
ALLOCATION OF GOVERNMENT CAPITAL EXPENDITURE 1983-1987 (A) Summary - All Sectors
1983 1984 1985 1986 1987
T FA T FA 7 FA T FA T FA F L T FA
1 To-tal Publc Investmea ... 21917 - 22895 - 25093
2 Add adjust iom for Capital Transfers 694 - 587 - 509
3. Total Capital E'perAture
(Publi Sector) of which ... 22611 - 23432 - 25602
i Extra Bdgetary Resources 4663 - 4800 - 4950
i)j Non urcansonry Resources
avilablei to Govt Budget ... 16587 - 18782 - 20818 (m) Supplnu.ntwry financing
re-aired for mvistment programme 1361 - -100 - -166
4 Ioial BuIrmitdv Prov.ion ... 17S48 - 18682 - 20652 5 Total [Budaetarv Provis-on grosa
of uniir enavoirtore
(1) Mahawh Development (2) Othor Irriition
(3) Frld & Minor Export Crops
(4) Foriestry & Lands ... (5) Parritions ... (6) Animal Husbandry ... (7) Fisheries - 27363 - 27738 - 519 - 512 - 27882 - 28250 - 5100 - 5250 - 22982 - 23249 - -200 - -249 - 22782 - 23000 19914 - 20307 - 21900 - 24200 - 24450 9234 6233 10619 6412 9827 5096 10100 3181 10188 6773 4886 618 339 634 325 237 89 758 493 81 38 133 63 7271 4779 5788 3444 4753 1940 5315 831 505 982 531 1280 518 1174 955 358 1206 399 1678 317 1502 270 107 320 106 381 88 406 969 540 1081 465 1468 200 1214 147 81 248 130 318 118 330 176 42 202 21 222 - 247 - - -125006 - - -- 2821 - -- - 127827 - - -- 24763 - - -- 102413 - - - 646 S- -- - 103064 - - -- 1lu, I 1688 24450 25518 49968 22b10 936 17574 12326 29900 15985 210 1803 3082 4885 2103 255 1850 4125 5975 1654 97 464 1150 1614 487 77 1590 3900 5490 1775 113 644 480 1124 480 - 525 455 980 126 ... 103 59 177 88 505 27 732 - 734
(iii) Housing. Water Supply and
Urban Development ... 2432 884
(1) Housig ... 648 2
(2) Other Construction ... 366 78 (3) Water Supply ... 1380 804 (4) Urban Development ... 38
-(iv) Economic Overheads ... 4458 2425 (1) Transport ... 1162 601
(2) Power ... ... 789 715
(3) Telecomrmunicarions ... 560 280 4) Administrative and Others 1947 829
(v) Soiol Overheads (1 Education (2) Health ... (3) Others . (vi) Miscellaneous 6. (i) 1 ds % of G.D.P. (il 4 as % of G.D.P. 1302 765 424 24 830 715 48 26 2887 796 2232 347 2398 78 2396 674 3 590 6 628 9 668 498 90 483 48 479 - 472 1282 703 1159 293 1291 69 1256 433 - - - - - -- 1141 1110 32 5627 6718 11 678 2530 -- C46 1652 21 4003 23f5 - 300 171 4369 2058 5467 2126 7010 2034 7218 1816 18129 10393 880 260 1100 17 1391 - 1509 - 4110 1932 897 605 1406 900 2196 862 2269 704 6424 1113 698 305 955 365 1138 120 1042 70 3333 10600 1894 888 2006 844 2285 1052 2398 1042 4262 626S 1255 194 2369 243 2460 171 2414 59 3705 6(i95 826 80 1451 175 1344 100 1112 17 1490 3t67 369 89 860 44 1069 57 1246 26 2094 2280 60 25 58 24 47 14 56 16 121 148 ... 2385 - 1000 - 1500 - 1500 - 1500 ... 17.6 ... 14.4 15.5 12.7 14.6 11.9 13.8 11.5 2251 12345 2137 3208 31 2298 216 6368 1890 471 --28522 10459 6042 878 7557 3786 4293 1140 10530 4655 9000 1432 6157 396 4374 931 269 105 - -- 7285 7885 12.3 10.2 Source: PIP
T -Total Cost FA .Foreign Aid F -Foreign Cost L .Local Cost
1983--1987
174
tion was taking up 60-65% of total public sector investment; the construction-intensive projects (Mahaweli and the Housing, Water, and Urban Development), alone accounted for 40-50% of the public sector investment capacity.(34)
In the overall list of investment priorities, agriculture has always ranked first, commanding the largest share of total capital expenditure. According to PIP 1982-87 an estimated Rs.49.968 billion is allocated for the sector; this represents 40% of total Public Investment for the period. Large expendi-ture items since 1977 result from the heavy emphasis on the Mahaweli Project which falls under this heading of agriculture. Irrigation alone absorbs 25% of the total public investment for
1983-87; its share in the total resources allocated to the
agricultural ector for 1983-87 rises to as much as 60%.(35) The second "lead project" is the Investment Promotion Zone
- the free trade zone north of Colombo - developed in order to
encourage foreign investment-oriented industries.(36) The in-tent was to promote foreign and domestic collaboration thereby "promoting the acquisition of better technology, management skills, greater access to foreign markets, and to create em-ployment and (most importantly) to enhance the country's ex-change earnings."(37) The relative share of industrial and other products of total export earnings has increased from 3.4%
in 1971 to approximately 50% in 1982. The growth is primarily because of petroleum products, textiles and garments (together accounting for about 80% of additional export earnings between
1977 and 1980). However, because both these items have high import requirements the net effect on the balance of payments
is low. (38)
The Housing, Water and Urban Development Project (HWUD) is the third lead sector and includes a number of different pro-jects: Urban Housing, Urban Redevelopment, Rural Houses, Slum and Shanty Upgrading, Housing Loans, and major water supply and sewerage projects. The support of Prime Minister Premadasa for this ambitious program has elevated the improvement of the housing stock to the level of a national priority. As the other construction-intensive project, the HWUD also captured a large percent of the total capital expenditures - close to 10% according to my calculations from Tables 3a and 3b.
Footnotes: Lead Projects
(25) In addition to the PIP, there is an annual budget both capital and recurrent for the government.
(26) For further explanation of the process of the design and
adoption of the PIP see short summary in USAID, 1981, pg. 65.
(27) The HWUD Project was to be kept within 4% of the total
investment.
(28) The relationship between heavy investment in the
construction-intensive projects and rising costs will be discussed in later chapters of this paper.
(29) By 1981, the cost of the project was estimated at Rs. 40
billion. Although international inflation contributed to the price escallation, a large part of the increase was due to the fact that better estimates were being prepared.
(30) Elsewhere in the Program, the Mahaweli Project is said to
capture 35% of the total budget in any one year. (31) This has declined since 1977.
(32) PIP 1983-87, p.118.
(33) All the major crops declined except rice - because of push
for self-sufficency in basic foods and import substitution effort.
(34) Stern quoted 42%.
(35) This figure also includes other irrigation projects: the
Gal-Oya Project and the Uda-Walawe Project.
(36) catered primarily to the factory-type industry - see PIP
pages 12-13 for performance summary.
(37) PIP, p.111.
(38) See Ganesan (1982a) for an explanation of the export
The Liberalization Policies
As mentioned earlier, the liberalization policies
con-sisted of devaluing the rupee, eliminating domestic price and
import controls and cutting the food subsidies program
dramatically. The intent, of course, was to attract foreign
investment as well as to direct domestic resources away from
consumption into investment. Following is a brief description
of the import-export policies.
Imports were liberalized in 1977 under the new
administra-tion. This came after seven years of tight control under Mrs.
Bandaranaike's administration.
The new liberalization scheme
divided imports into two groups: (1)
those requiring a licence
-
less than 150 goods fall under this heading; and (2)
all
other goods that are freely importable
-
under the second
heading come the inputs of the construction sector - machinery,
raw materials, spares and a large range of manufactured goods.
(39) In
addition, the import duty structure has been
restructured into six "bands": duty free, 5 percent, 12.5
percent, 25 percent, 50 percent, and 100 percent.(40)
As one
would expect, luxury goods fall at the higher end of the scale,
with essential goods at the lower end.
The overall result of
the new tariff structure is a lower average burden than
previously.
On the export side, permits
- issued by
the controller of
exchange - are required for all exports.
Some export items are
banned, others require special licences.
All major export
proceeds - from both visible and invisible exports - must be surrendered.(41)
And finally, with the introduction of the Import Promotion Zone, foreign investment is seen as an essential element of the national development strategy. Tax concessions are offered to the foreign firms to locate in the zone; concessions are also granted outside the zone for export oriented and new techology introducing projects. Approved investors (42) are completly exempt from "exchange controls, transfer of capital and pro-ceeds of liquidation, transfer of shares and payments of divi-dends (to non-resident shareholders)."(43)
Footnotes: Liberalization Policies
(39) Consignments exceeding Rs 700,000, however, are subject to
approval by the Investment Advisory Committee
(40) Duty rates have been increased above 100% for certain luxury goods since 1977.
(41) Invisible exports = some aspects of the tourism trade and remmittances from abroad.
(42) Must be approved by the Foreign Investment Advisory Committee - FIAC.
Macro-economic effects of Sri Lanka's strategy
The Public Investment Program of 1978 channelled investment
into projects that had long gestation periods and low
produc-tivities.
In addiiton, they turned out to be very capital- and
import-intensive. Because of their first two characteristics,
the projects had to be financed through an increase in the
national deficit.
Table 4
Value of Foreign Trade (R s mn)
Exports
incl re-exports, fob Imports, cif Balance (adjusted) Indices (1978=100) Terms of trade Volume of exports Volume of imports 1978 13,206 14,687 -1,480 100 100 100 1979 15,279 22, 541 -7, 262 1980 17,595 33, 942 -16, 347 1981 21.043 36, 582 -15, 539 1982 21,454 41, 946 -20,492 72 58 46 38 101 99 102 112 123 140 145 148
Sources: Review of the Economy, Central Bank of Ceylon; Customs
Source: QEROSL
Although the pace of economic activity slowed and the develop-ment program was limited by 1981, the deficit continued to grow because of poor import performance, continuing recession in de-veloped countries, and adverse terms of trade.
The balance of payments deficit also widened enormously. (See table 5) However, the financing of the deficit has been relatively easy for President Jayawardene.(44) The IMF support has been generous as has other aid and grant increases; in addition, a larger surplus on invisible earnings such as
tourism.
Table 5 of Pavments Exports, fob Imports, cif Trade balance Invisible transactions
& private transfer payments
Current account balance
Capital payments
Current account & capital
payments (financing requirementsb) Financed from
Transactions that do not affect debt position:
official grants
direct investment SDR allocations
Borrowings & use of resources: long term loans
short term credits suppliers' credit bilateral balances commercial borrowings (private sector) 1979 15,282 22, 57 0 -7, 288 1, 493 -5, 795 -1, 759 2, 239 769 -242 2, 903 41 609 413 1930 17,603 33. 915 -16, 312 3, 119 -13. 193 -5. 193 2,281 753 258 4, 4, 1981 20,507 36, 123 -15, 616 4.156 -11,460 -13, 767 3,118 1, 003 252 143 454 441 732 5, 10, 1, 350 518 233 1, 546
Balance of Payments (continued)
(R s mn) 1979 1980 1981 1982a bank borrowings - 361 - 1, 595 IMF drawings 1,592 828 4,528 1,369 other 120 147 142 1, 071 reservesc -2,175 2,886 -2,456 -1,734
errors & valuation adjustmentc 802 1,102 -7 759
a Provisional.. b External resources gap. Source: Central Bank of Ceylon.
Source:QEROSL c - indicates increase. 1982a 21,434 41, 90 2 -20, 468 5, 296 -15.172 -14, 026 3, 379 1, 080 5,663 9,940 '1, 160 4,916 n) e Balanc (REs m -7, 554 -18, 386 -25, 227 -29, 198