HAL Id: inserm-01122331
https://www.hal.inserm.fr/inserm-01122331
Submitted on 3 Mar 2015
HAL is a multi-disciplinary open access
archive for the deposit and dissemination of
sci-entific research documents, whether they are
pub-lished or not. The documents may come from
teaching and research institutions in France or
abroad, or from public or private research centers.
L’archive ouverte pluridisciplinaire HAL, est
destinée au dépôt et à la diffusion de documents
scientifiques de niveau recherche, publiés ou non,
émanant des établissements d’enseignement et de
recherche français ou étrangers, des laboratoires
publics ou privés.
Monocyte-derived dendritic cells from HLA-B27+ axial
spondyloarthritis (SpA) patients display altered
functional capacity and deregulated gene expression
Alice Talpin, Félicie Costantino, Nelly Bonilla, Ariane Leboime, Franck
Letourneur, Sébastien Jacques, Florent Dumont, Sonia Amraoui,
Charles-Antoine Dutertre, Henri-Jean Garchon, et al.
To cite this version:
Alice Talpin, Félicie Costantino, Nelly Bonilla, Ariane Leboime, Franck Letourneur, et al..
Monocyte-derived dendritic cells from HLA-B27+ axial spondyloarthritis (SpA) patients display altered
func-tional capacity and deregulated gene expression. Arthritis Research and Therapy, BioMed Central,
2014, 16 (4), pp.417. �10.4049/jimmunol.177.3.1932�. �inserm-01122331�
R E S E A R C H A R T I C L E
Open Access
Monocyte-derived dendritic cells from HLA-B27
+
axial spondyloarthritis (SpA) patients display
altered functional capacity and deregulated
gene expression
Alice Talpin
1,2, Félicie Costantino
1,2,3, Nelly Bonilla
4, Ariane Leboime
3, Franck Letourneur
4, Sébastien Jacques
4,
Florent Dumont
4, Sonia Amraoui
4,5, Charles-Antoine Dutertre
6, Henri-Jean Garchon
1,2,3,7, Maxime Breban
1,2,3and Gilles Chiocchia
1,2*Abstract
Introduction: This study aimed to compare the functional capacity and gene expression profile of monocyte-derived dendritic cells (MD-DCs) in HLA-B27+axial spondyloarthritis (SpA) patients and healthy controls.
Methods: MD-DCs were differentiated with interleukin 4 (IL-4) and granulocyte-macrophage colony-stimulating factor (GM-CSF) for seven days, starting from purified CD14+monocytes and stimulated with lipopolysaccharide (LPS) for six and twenty four hours. Their capacity to stimulate allogeneic CD4+T cells from unrelated healthy donor was tested. Transcriptomic study was performed with Affymetrix HuGene 1.0 ST microarrays. Gene expression levels were compared between patients and controls using a multivariate design under a linear model (LIMMA). Real-time quantitative PCR (qRT-PCR) was performed for validation of the most striking gene expression differences.
Results: The stimulatory capacity of allogeneic CD4+T cells by MD-DCs from SpA patients was decreased. Transcriptomic analysis revealed 81 genes differentially expressed in MD-DCs between SpA patients and controls (P <0.01 and fold-change <0.66 or >1.5). Four selected genes were validated by qRT-PCR: ADAMTS15, CITED2, F13A1 and SELL. Expression levels of ADAMTS15 and CITED2, encoding a metallopeptidase and a transcription factor, respectively, were inversely correlated with each other (R = 0.75, P = 0.0003). Furthermore, in silico analysis identified several genes of the Wnt signaling pathway having expression co-regulated with CITED2.
Conclusion: This study revealed altered function and gene expression pattern in MD-DCs from HLA-B27+axial SpA. Co-expression study showed an inverse correlation between ADAMTS15 and CITED2. Moreover, the Wnt signaling pathway appeared as deregulated in SpA MD-DCs, a finding which may be connected to Th17-driven inflammatory responses.
Introduction
Spondyloarthritis (SpA) is a chronic inflammatory rheumatic disorder, with a prevalence of around 0.42% in Caucasian populations [1]. Joint inflammation is re-sponsible for pain and stiffness but long-term outcome is mainly determined by new bone formation, which can lead to complete ankylosis. Effective treatments such as
TNF blockers can temporarily suppress inflammation, but none has yet proven to affect long-term disease out-come. Therefore, there is a need to better understand pathological mechanisms controlling both initiation and progression of SpA.
Genome-wide gene expression analysis is a powerful ap-proach to identify molecular mechanisms responsible for a disease. Microarray studies have already been conducted in SpA, most of them focusing on the ankylosing spondyl-itis (AS) subtype [2-7]. Each of those studies identified sev-eral genes differentially expressed between patients and
* Correspondence:gilles.chiocchia@inserm.fr
1
INSERM U987, Laboratoire d’excellence INFLAMEX, Université Versailles-Saint-Quentin, Versailles 78000, France
2
UFR des Sciences de la Santé, Simone Veil, Versailles Saint Quentin en Yvelines Université, Montigny-Le-Bretonneux 78180, France
Full list of author information is available at the end of the article
© 2014 Talpin et al.; licensee BioMed Central Ltd. This is an Open Access article distributed under the terms of the Creative Commons Attribution License (http://creativecommons.org/licenses/by/4.0), which permits unrestricted use, distribution, and reproduction in any medium, provided the original work is properly cited. The Creative Commons Public Domain Dedication waiver (http://creativecommons.org/publicdomain/zero/1.0/) applies to the data made available in this article, unless otherwise stated.
controls but there was very little overlap between their re-sults, maybe due to the variety of protocols.
Several studies support an important role of dendritic cells (DCs) in the pathogenesis of SpA. Indeed, aberrant functions of DCs have been demonstrated in an HLA-B27/humanβ2-microglobulin transgenic rat model of SpA [8]. First, DCs from these rats have a decreased capacity to stimulate primary allogeneic or syngeneic T cell responses [9]. Furthermore, the proportion of conjugates formed be-tween HLA-B27 DCs and naïve CD4+ T cells is reduced. Moreover, mature HLA-B27 molecules expressed by DCs appear to impair the formation of an antigen-independent immunologic synapse with naïve CD4+T cells by interfer-ing with the engagement of co-stimulatory molecules [10]. Finally, B27 transgenic rat DCs were shown to favor Th17 expansion [11,12] and to alter regulatory T cell function, resulting in decreased 10 and enhanced IL-17 production [13].
On this basis, we hypothesized that DCs also play an im-portant role in human disease, as proposed in the HLA-B27 transgenic rat model. The aim of the current study was to compare functional capacity and the gene expres-sion profile of monocyte-derived DCs (MD-DCs) in pa-tients with HLA-B27+axial SpA and healthy controls.
Methods
Patients and controls
We studied three different groups of patients and controls: 10 patients and 5 controls for monocyte subset characterization by flow cytometry, 19 patients and 24 controls for mixed lymphocyte reaction and 9 patients and 10 controls for the MD-DC transcriptomic study (6 patients and 4 controls were investigated for the two latter). All the patients were HLA-B27+and fulfilled the Assessment of SpondyloArthritis International Society classification criteria for axial SpA [14]. Controls were healthy blood donors.
Patients’ and healthy controls’ characteristics are sum-marized in the Additional files (see Additional file 1: Table S1 and Additional file 2: Table S2, respectively). All partici-pants in the study gave written informed consent and the study was approved by local ethics committee of Ile-de-France XI (Saint-Germaine-en-Laye Ile-de-France).
Cell isolation, culture and stimulation
Peripheral blood mononuclear cells (PBMCs) were isolated from 50 mL of blood by gradient separation on Ficoll density gradient centrifugation (STEMCELL Technologies, Grenoble, France). Monocytes used to generate MD-DCs were purified by magnetic cell sorting using anti-CD14 monoclonal antibody (mAb)-coated beads (BD IMag, Le Pont de Claix, France). Sorted monocytes were morpho-logically homogeneous with 99% of CD14+ cells, as deter-mined by flow cytometry.
Monocytes were further cultured for 6 days in 24-well plates (400,000 cells/500 μL) in Roswell Park Memorial Institute (RPMI) 1640 medium supplemented with 10% heat-inactivated fetal calf serum, 100 U/mL penicillin, 100 μg/mL streptomycin, 500 U/mL recombinant hu-man granulocyte-macrophage colony stimulating factor (rhGM-CSF) and 500 U/mL rhIL-4 (AbCys, Paris, France). Then, the MD-DCs were stimulated or not with lipopoly-saccharide (LPS) fromEscherichia coli (LPS, Sigma-Aldrich, St Louis, MO, USA) at a concentration of 100 ng/mL for the last 6 or 24 hours of culture (further referred to as time points H0, H6 and H24).
CD4+T cells were purified from PBMCs from two un-related healthy donors by magnetic cell sorting using anti-CD4 monoclonal antibody (mAb)-coated beads (BD IMag), and stored frozen until used for mixed lympho-cyte reaction (MLR).
Flow cytometry
To characterize monocyte subsets, freshly purified PBMCs were analyzed by six-color flow cytometry on FACS LSRII apparatus. The gating strategy was based on a previous report [15]. Monocytes were subdivided into three major subsets: classical CD14++CD16−, intermediate CD14++ CD16+ and non-classical CD14+CD16++ monocytes. The following anti-human mAbs were used: CD45-Amcyan (BD Biosciences), HLA-DR-PerCP (BD Biosciences), CD19-ECD (Beckman Coulter), CD14-QDot655 (Invitrogen), CD16-APC-H7 (Beckman Coulter, Villepinte, France). The Live/ Dead blue Dye (Invitrogen) was used to exclude dead cells.
Samples of the purified monocytes used to generate MD-DCs and of the resulting MD-DCs were routinely stained with the following anti-human mAbs: CD14-FITC, CD11c-APC, CD40-PE, HLA-I-FITC, HLA-DR-PerCP, CD80-PE, CD83-APC and CD86-FITC (all from BD Bio-science) and analyzed by flow cytometry on FACS canto II apparatus (BD Biosciences).
Mixed lymphocyte reaction (MLR)
Purified allogeneic CD4+T cells (105cells per well) from healthy donors were cultured with unstimulated (H0) or LPS-stimulated (H6, H24) MD-DCs (104cells per well), in 96-well flat-bottomed culture dishes in a final volume of 200 μL. Proliferation of T cells was assayed by measuring incorporation of 3H-deoxythymidine added (0.5 μCi per well) after 6 days of culture, using a Microbeta scintillation counter (Wallac, Turku, Finland). Data are expressed as the mean counts per minute (CPM) in triplicate wells. An MLR index (ratio of CPM of MLR on CPM of CD4+T cells only) was used to represent CD4+T cell proliferation. Two stored CD4+ T cell batches from different healthy donors were sequentially used for MLR in two sets of experiments, each including equivalent numbers of patient and control MD-DC samples. As there was no statistically significant
Talpinet al. Arthritis Research & Therapy 2014, 16:417 Page 2 of 9 http://arthritis-research.com/content/16/4/417
difference in the results between both sets of experiments, we pooled them. The Wilcoxon test was used to compare MLR indices between patients and controls at each stimula-tion time point.
Transcriptomic study RNA isolation
MD-DCs were disrupted and homogenized using RLT buf-fer (Qiagen, Valencia, CA, USA). Total RNA was isolated using RNeasy Mini Kit (Qiagen). RNA quantity and quality were assessed using Agilent 2100 Bioanalyzer (Agilent, Santa Clara, CA, USA). Only samples with an RNA integ-rity number (RIN) above 8 were further processed.
Microarray hybridization
RNA was reverse-transcribed, converted to biotinylated complementary RNA using standard Affymetrix protocol (Affymetrix, Santa Clara, CA, USA) and hybridized to the Affymetrix GeneChip Human Gene 1.0 ST Array by the genomic platform of the Cochin Institute.
Differential gene expression validation by qRT-PCR
For validation, the relative gene expression levels of candidate genes identified through the foregoing microarray study were further quantified using qRT-PCR. Briefly, RNA treated with DNase I (Invitrogen) was reverse-transcribed using SuperscriptII (Invitrogen) and then quan-tified using the SYBR green PCR Master Mix (Applied Bio-systems) and the 7300 Real-Time PCR System (Applied Biosystems). Primers were purchased from Eurofins MWG (nucleotide sequences of the PCR primers are available in Additional file 3: Table S3). The experiment design in-cluded three technical replicates.
Statistical analysis
Raw Affymetrix data (.cel files) from 57 arrays (correspond-ing to H0, H6 and H24 time points of stimulation by LPS for 19 subjects) were transformed by the Robust Multichip Analysis (RMA) method using Bioconductor in R software (library Affy) [16]. This transformation included back-ground correction, normalization and summarization of ex-pression values using Brainarray version 15 custom chip definition (cdf) files generated with the Ensembl annotation set [17]. Before analysis, genes were filtered on annotation and expression level mean with a cut off at 6.11 (corre-sponding to the mean of expression level of both anti-genomic and intronic probes of housekeeping genes). Gene expression levels were then fitted to a bivariate linear model including disease status and time point after stimulation, using the LInear Models for Microarray data (LIMMA) package of Bioconductor in R environment to determine differentially expressed genes [18]. The threshold for differ-ential gene expression between patients and controls was
set to a global fold change above or below 1.5 with a nom-inalP-value below 0.01.
For qRT-PCR validation, gene expression data were computed with the ΔΔCq method, using three house-keeping genes: RPL30, β-ACT and GAPDH. Then, two-way analysis of variance (ANOVA) was used to test differential gene expression among samples from SpA and controls without (baseline; no treatment) and with LPS treatment for 6 and 24 hours. In case of statistical signifi-cance (P <0.05), post hoc t-tests with the Bonferroni cor-rection allowed us to perform pairwise comparisons.
Paired genes co-expression study and molecular pathway analysis
Pairwise correlations between gene expression levels were tested using the nonparametric Spearman test. We used the commercial software Genomatix Pathway System [19] to identify significantly enriched pathways and functional themes, among the list of the best correlated genes with genes of interest.
Results
Functional impairment of MD-DCs from SpA patients
To verify that MD-DCs were differentiated from com-parable monocyte populations between SpA patients and controls, we analyzed monocytes subsets in both groups. As shown in an additional file, the distribution of the classical, intermediate and non-classical circulating sub-sets among CD45+ PBMCs was similar in patients and controls (see Additional file 4: Figure S1).
The cells obtained after 7 days of differentiation in cul-ture in patients and controls were uniformly CD14−, CD11c+, CD40+, HLA-DR+, CD83dim and CD86+, con-sistent with a MD-DC phenotype. Moreover, HLA-DR, CD80 and CD86 expression increased and CD83 was in-duced on MD-DCs after LPS stimulation for 24 hours (Additional file 5: Figure S2).
In the rat model of SpA, HLA-B27 transgenic DCs have a decreased capacity to stimulate allogeneic T cells. Thus, we tested the capacity of MD-DCs from HLA-B27+ SpA patients to prime allogeneic CD4+T cells using anin vitro proliferation assay. A weaker proliferation of CD4+ T cells was observed with SpA MD-DCs as compared to controls, which was statistically significant before and after 6 hours of LPS exposure (P <0.05 and P <0.01, re-spectively; Figure 1).
Identification of differentially expressed genes in MD-DCs between patients and controls
To investigate the mechanisms underlying the functional defect of MD-DCs from SpA patients, we then compared gene expression levels in those cells between SpA and healthy donors upon stimulation with LPS. After filtering on gene expression level and gene annotation, 13,021 genes
(57.3% of the genes present in the microarray) were kept for further analysis. Expression data for MD-DCs either left unstimulated or stimulated with LPS for 6 or 24 hours were first globally compared between SpA patients and healthy subjects. Unsupervised hierarchical clustering showed that samples were perfectly grouped according to LPS stimula-tion time points (Addistimula-tional file 6: Figure S3) but not to the disease status. Linear modeling nevertheless identified 81 genes differentially expressed between patients and controls at any time point, with a nominalP-value <0.01 and a fold change below 0.66 or greater than 1.5 (Additional file 7:
Table S4). Of this set of genes, 61 were downregulated and 20 were upregulated in patients.
Using the extraction of the dataset corresponding to these 81 genes, LPS stimulation time points were per-fectly separated by unsupervised hierarchical clustering. Furthermore, patients and controls were now clearly dis-criminated, with only four misclassifications (one at H0, two at H6 and one at H24) (Figure 2).
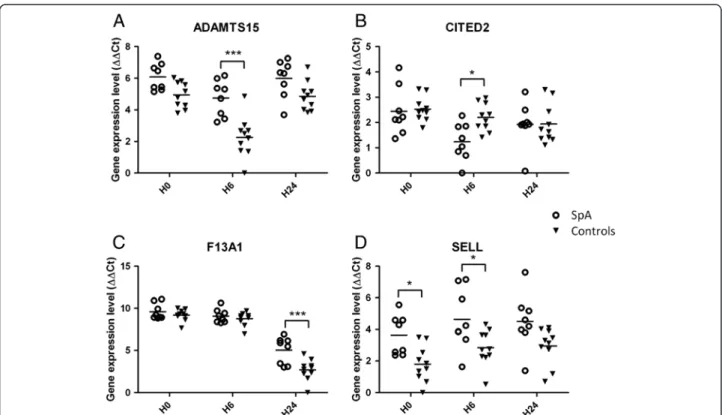
Four candidate genes were chosen for validation study on the basis of theirP-value, fold change and biological relevance: ADAMTS15, CITED2, F13A1 and SELL. For all four genes, the qRT-PCR data produced with the RNA samples used for the microarray study confirmed the significant differences in expression and the direc-tion of changes between SpA patients and controls (Table 1, Figure 3): ADAMTS15, F13A1 and SELL were significantly upregulated in SpA samples, whereasCITED2 was downregulated.
Co-regulated genes in SpA patients
Examination of gene expression data indicated that some of them displayed similarity in their expression profile, sug-gesting co-regulation. Indeed, we found a highly significant negative correlation betweenADAMTS15 and CITED2 ex-pression levels at H6 in both patient and control groups (combined data: rho =−0.75; P = 0.0003; Figure 4).
Considering the transcriptional co-activator function of CITED2 and its downregulation in SpA MD-DCs, we sought whether genes other than ADAMTS15 shared a similarly co-regulated expression pattern in patient MD-DCs. We tested the correlation of the genome-wide ex-pression matrix of patient MD-DCs withCITED2 expres-sion in a pairwise fashion. A set of 222 genes was found significantly correlated withCITED2 (P <0.01). They were
Figure 1 Impaired allogeneic T cell stimulatory capacity of monocyte-derived dendritic cells (MD-DCs) from spondyloarthritis (SpA) patients. MD-DCs from SpA patients and healthy controls that were left unstimulated at baseline (H0), or were stimulated with lipopolysaccharide (LPS) for 6 h or 24 h (H6 and H24, respectively) were tested for their capacity to stimulate in vitro allogeneic CD4+T cells. Results are expressed as3H-deoxythymidine incorporation after 6 days of mixed lymphocyte reaction, in counts per minute (CPM) ratio. Bars represent the mean proliferation index and standard error of the mean induced by MD-DCs from 19 SpA patients and 24 healthy controls. The Wilcoxon test showed significant differences at H0 (*P <0.05) and H6 (**P <0.01). MLR, mixed lymphocyte reaction.
Figure 2 Unsupervised hierarchical clustering of 57 samples based on microarray expression levels of the 81 differentially expressed genes between spondyloarthritis (SpA) patients and controls. Each time point is color-coded (baseline (H0): blue, 6 h (H6): red, 24 h (H24): green). Samples are clustered on the horizontal axis (top row: SpA patients, bottom row: healthy controls), with the length on the vertical axis representing the degree of correlation between samples.
Talpinet al. Arthritis Research & Therapy 2014, 16:417 Page 4 of 9 http://arthritis-research.com/content/16/4/417
analyzed with the Genomatix web platform in order to in-terrogate their biological relevance. This revealed a signifi-cant enrichment of genes belonging to the Wnt signaling pathway (P = 2.48 × 10⁻⁴
) in the SpA group. In the con-trols, there was no significant correlation between expres-sion levels ofCITED2 and the four genes identified in the Wnt pathway (that is,WNT1, WNT10B, FZD4 and ROR2) (Figure 5). This co-regulation pattern involving four genes of the Wnt signaling pathway was therefore specifically as-sociated with the disease.
Discussion
Starting from the hypothesis that aberrant DCs function could play a critical role in the development of SpA, we showed here for the first time that the capacity of MD-DCs to stimulate allogeneic CD4+ T cell response was impaired in SpA patients compared to controls. The genome-wide transcriptome of these MD-DCs elicited by LPS stimulation revealed 81 genes differentially expressed, 4 of which have been validated by RT-qPCR. Finally, we identified the Wnt signaling pathway as dysregulated in patients.
Our choice to study in vitro-differentiated DCs rather than DCs purified from peripheral blood had the advan-tage to remove those cells fromin vivo influences, such as non-specific acute inflammation and drug therapy. There-fore, the differences that we observed between DCs from SpA and controls were more likely to be intrinsic to the DC and could be involved in the disease mechanism.
First, we demonstrated that MD-DCs differentiated from similar monocyte populations in both groups. Then, we observed that the ability of SpA MD-DCs to stimulate allogeneic CD4+ T cell proliferation was markedly defect-ive, as compared to controls, as previously shown in SpA-prone HLA-B27 transgenic rats. The molecular basis for this impaired DC function has yet to be elucidated.
Table 1 qRT-PCR expression analysis of four selected genes in monocyte-derived dendritic cells from spondyloarthritis patients, as compared to controls
Gene Microarray qRT-PCR
P-value P-value Fold change
Disease Disease/time H0 H6 H24
ADAMTS15 0.0003 0.0005 0.04 2.2 5.63 2.2
CITED2 0.0007 0.21 0.031 0.94 0.51 0.99
F13A1 0.00006 0.019 0.001 1.32 1.25 5.05
SELL 0.006 0.012 0.8 3.57 3.47 2.97
P-value is reported considering the global effect, the effect of the disease status only or the effect of the disease status adjusted for time. Bold text indicates significantP-values and at what time the modulation of gene expression was significantly different between patients and controls.
Figure 3 Scatter plots showing qRT-PCR expression levels in spondyloarthritis (SpA) and controls of the 4 selected genes: ADAMTS15 (A), CITED2 (B), F13A1 (C) and SELL (D). The x-axis of the plots represents the three lipopolysaccharide-stimulation time points (baseline (H0), 6 h (H6) and 24 h (H24)) and the y-axis shows the log2 of gene expression level normalized with housekeeping genes (ΔΔCt). *P <0.05, ***P <0.0005, for SpA versus controls.
To investigate this impairment, we have studied the time-dependent global transcriptome of MD-DCs in re-sponse to LPS stimulation. A number of microarray-based studies have previously been undertaken in AS, on whole blood cells [3-5], PBMCs [6,7] or macrophages [2]. How-ever, no transcriptomic analysis had been conducted on DCs. Of note, as we worked on a homogeneous cell popu-lation rather than on cell mixture, our results were not confounded by variations in the composition of the cell populations [20]. The time-dependency of our gene profil-ing is also a novel aspect, rarely investigated in humans.
Our analysis revealed 81 genes differentially expressed in resting and/or LPS-stimulated MD-DCs between SpA patients and controls. Of note, we did not identify a reverse interferon signature, such as in HLA-B27 trans-genic rat splenic DCs [21] or in SpA patients monocyte-derived macrophages [2]. Such a discrepancy could be explained by differences in culture conditions. Here, we used IL-4 to differentiate MD-DCs, a cytokine that op-poses interferon and interferon-induced gene expression
and this might have blunted interferon-related differences between groups. Based on the magnitude of their variation between patients and controls, the level of statistical sig-nificance, and their biological relevance, we selected four of these genes that we validated using qRT-PCR.
We found an increased expression of ADAMTS15 (A Disintegrin And Metalloproteinase with ThromboSpon-din motif) in SpA. Although the ADAMTS family has not yet been implicated in this disorder, numerous studies have identified a role for metalloproteinases (MMPs) in SpA sus-ceptibility and severity [22-24]. Of note, ADAMTS15 was shown to be expressed in the joint with decreased expres-sion in osteoarthritis [25]. Thus, ADAMTS15 could be im-plicated in the cartilage and/or bone turnover that takes place during joint inflammation, such as in SpA.
CITED2 functions as a context-dependent transcrip-tional modulator to up- or downregulate the expression of specific genes [26-28]. Here, the expression of CITED2 was downregulated in SpA MD-DCs. We further showed an inverse correlation between CITED2 and ADAMTS15 expression after 6 hours of LPS treatment. Interestingly, similar inverse correlation has previously been reported be-tweenCITED2 and several MMP family members [29,30]. MMPs constitute a very important group of proteolytic en-zymes in joint tissues. Thus, it has been suggested that CITED2 exerted chondroprotective effects through MMP downregulation [31]. The downregulation ofCITED2 and the inverse correlation between CITED2 and ADAMTS15 expression that we observed here suggest that DCs or other phagocytic mononuclear cells, such as macrophages and osteoclasts, could be implicated in SpA joint resorption through heightened metallopeptidase activity.
In silico pathway analysis conducted on CITED2 co-expressed genes highlighted downregulation of several fac-tors belonging to the canonical (that is,WNT1, WNT10B and FRZL4) and non-canonical (ROR2) Wnt signaling pathways, of potential relevance for SpA pathogenesis. First, factors of the canonical Wnt pathway were shown to play a crucial role either in bone formation or destruction in inflammatory arthritis [32,33], such as WNT10b
Figure 4 Correlation of qRT-PCR expression levels between CITED2 and ADAMTS15. Expression is shown for H6 time-point in mixed spondyloarthritis (open circles) and control (black triangles) samples. P-value (P) and nonparametric Spearman correlation coefficient value (rho) are shown.
Figure 5 Co-expression of the Wnt signaling pathway with CITED2 in spondyloarthritis (SpA). Graphical view of the Wnt pathway identified by studying genes co-expressed at 6 h (H6) with CITED2 in the whole microarray dataset in patients (A) and in controls (B). Numbers and color code (scale on the right side) indicate nonparametric Spearman correlation coefficient of the network's gene with CITED2.
Talpinet al. Arthritis Research & Therapy 2014, 16:417 Page 6 of 9 http://arthritis-research.com/content/16/4/417
[34,35]. On the other hand, activation of canonical Wnt-β-catenin signaling in DCs was shown to concur to regulatory T cell differentiation and conversely to in-hibit Th17 differentiation [36]. Moreover, ROR2 is a sig-naling component of the non-canonical Wnt pathway acting on actin cytoskeleton to stimulate cell migration [37,38]. Interestingly, altered T cell stimulation was linked to defective cytoskeleton dynamics in HLA-B27 transgenic rat DCs [39].
F13A1 encodes the coagulation factor XIII A subunit, a transglutaminase enzyme. It has multiple extra- and intracellular functions, including a role in cartilage and bone development. Hence, increased factor XIII A ex-pression has previously been associated with cartilage ageing and degenerescence [40]. Fibrin crosslinking by factor XIII is of crucial importance not only for hemostasis, but also for inflammation. For instance, factor XIII A-subunit genotype was shown to influence C-reactive protein levels during inflammation in rheumatoid arthritis (RA) [41].
Finally,SELL encodes the lymphocyte homing recep-tor L-selectin/CD62L, one of the major adhesion mole-cules, which regulates entry of neutrophils and monocytes into inflamed tissues and contributes to the severity of joint inflammation in experimental arthritis [42]. Thus, upregulation of SELL, as shown here in DCs could well participate in joint inflammation in SpA. Interestingly, this gene was also found to be upregulated in splenic DCs from the HLA-B27/human β2-microglobulin transgenic rat [21].
Conclusions
Results of the present study reveal the defective func-tional capacity of DCs from SpA patients, as compared to controls. Furthermore, our results demonstrate sig-nificant changes in MD-DCs gene expression upon LPS stimulation that may be inherent to SpA patients. Some of them (that is, decreased Wnt signaling) could account for the altered DC function that provided a ra-tionale for the present study. Others (that is, upregula-tion ofADAMTS15, F13A1 and SELL) would concur to reinforce tissue inflammation and/or damage. Finally, the co-expression of CITED2 co-transcriptional factor with several of the foregoing genes (that is, the Wnt signaling pathway andADAMTS15) supports the hypothesis that a coordinated deregulation taking place in DCs may play an important role in SpA pathogenesis.
Additional files
Additional file 1: Table S1. Characteristics of the study patients.*SpA, spondyloarthritis; BASDAI, Bath Ankylosing Spondylitis Disease Activity Index; NSAID, non-steroidal anti-inflammatory drug; TNF, tumor necrosis factor. ND, not done. *The registered manifestations correspond to those
present at the time of examination, or retrieved from past-medical history. **Refers to radiographic sacroiliitis≥ grade II bilateral or grade III unilateral. ***Six patients are common to both studies. ****Data available for nine patients.
Additional file 2: Table S2. Characteristics of the study healthy controls. Additional file 3: Table S3. Nucleotide sequence of the PCR primers. Additional file 4: Figure S1. Comparison of monocyte subsets distribution among peripheral blood mononuclear cells (PBMCs) between spondyloarthritis (SpA) patients and healthy controls (Ctrl) by six-color flow cytometry. Distribution of monocyte subsets among CD45+PBMC
was studied in five healthy donors (clear boxes) and 10 HLA-B27+SpA
patients (gray boxes). Results are represented as boxes, bars indicate medians. The mean age of healthy donors was 42 years at the time of the study and 40% of them were men. Characteristics of the patients are shown in Additional file 1: Table S1.
Additional file 5: Figure S2. Phenotypic characterization of purified monocytes and monocyte-derived dendritic cells (MD-DCs) by flow cytometry. Results of one healthy donor representative of study subjects are shown. Monocytes (D0) were CD14+, CD11c+, CD40−, HLA-I+,
HLA-DR+, CD80−, CD83−and CD86−. MD-DCs (D7) were CD14−, CD11c+,
CD40+, HLA-I+, HLA-DR+, CD80−, CD83dim, and CD86+. HLA-DR, CD83
and CD86 expression increased, and CD80 was induced on MD-DCs after lipolpolysaccharide (LPS) stimulation for 24 h (H24). Clear plot represents control isotype and gray plot the tested antibody. Additional file 6: Figure S3. Unsupervised hierarchical clustering of 57 samples based on whole-genome gene expression levels. Each time point is represented by a color (baseline (H0): blue, 6 h (H6): red, 24 h (H24): green). Samples are clustered on the horizontal axis (top row: spondyloarthritis (SpA) patients, bottom row: healthy controls).
Additional file 7: Table S4. List of the genes differentially expressed in monocyte-derived dendritic cells (MD-DCs) between spondyloarthritis (SpA) and controls, ranked by fold change.**The criteria for the inclusion of genes in this table are described in Patients and Methods. Global values are LInear models for microarray data (LIMMA) values. The four genes selected for qRT-PCR validation are in bold text.
Abbreviations
AS:ankylosing spondylitis; CPM: counts per minute; DC: dendritic cell; EBV: Epstein-Barr virus; GM-CSF: granulocyte-macrophage colony-stimulating factor; IL: interleukin; LIMMA: LInear models for microarray data;
LPS: lipopolysaccharide; mAb: monoclonal antibody; MD-DC: monocyte-derived dendritic cell; MLR: mixed lymphocyte reaction; MMP: metalloproteinase; PBMC: peripheral blood mononuclear cell; qRT-PCR: real-time quantitative PCR; SpA: spondyloarthritis; TNF: tumor necrosis factor.
Competing interests
The authors declare that they have no competing interests. Authors’ contributions
All authors were involved in drafting the article or revising it critically for important intellectual content, and all authors read and approved the final manuscript. GC had full access to all of the data in the study and takes responsibility for the integrity of the data and the accuracy of the data analysis. Study conception and design: AT, FC, HJG, MB, and GC. Acquisition of data: AT, FC, NB, AL, SJ, and SA. Analysis and interpretation of data: AT, FC, NB, FL, FD, CAD, HJG, MB, and GC. The corresponding author confirms that all the individuals listed as authors fulfil the uniform authorship credit requirements for manuscripts submitted to medical journals, that is, that they all contributed to the manuscript based on (1) substantial contributions to conception and design, acquisition of data, or analysis and interpretation of data; (2) drafting the article or revising it critically for important intellectual content; and (3) final approval of the version to be published.
Acknowledgements
We gratefully acknowledge the contribution of Pr A Hosmalin (Director of Antigen presentation by Dendritic cell team), for fruitful scientific discussions and providing antibodies for monocyte subset characterization. This work was supported by a grant from Agence Nationale de la Recherche (grant ANR
2010 GEMISA) and the financial support of the Investissements d’Avenir programme ANR-11-IDEX-0005-02, Sorbonne Paris Cite, Laboratoire d’excellence INFLAMEX. Alice Talpin was supported by a grant from Arthritis Fondation Courtin. Félicie Costantino was supported by a grant from the Société Française de Rhumatologie (SFR). Charles-Antoine Dutertre was supported by the Agence Nationale de Recherche sur le SIDA et les Hépatites Virales (ANRS). Sonia Amraoui had a fellowship from Paris-Diderot University.
Author details
1
INSERM U987, Laboratoire d’excellence INFLAMEX, Université
Versailles-Saint-Quentin, Versailles 78000, France.2UFR des Sciences de la
Santé, Simone Veil, Versailles Saint Quentin en Yvelines Université, Montigny-Le-Bretonneux 78180, France.3Rheumatology Division, Ambroise
Paré Hospital (AP-HP), Boulogne-Billancourt 92100, France.4Institut Cochin, INSERM U1016, CNRS (UMR 8104), Université Paris-Descartes, Sorbonne Paris-Cité 75014, France.5Antigen Presentation by Dendritic Cell Team; Institut Cochin, INSERM U1016, CNRS (UMR 8104), Université Paris-Descartes, Sorbonne Paris-Cité 75014, France.6Duke-NUS Graduate Medical School, Program in Emerging Infectious Disease, Singapore, Singapore.7Genetics
Division, Ambroise Paré Hospital (AP-HP), Boulogne-Billancourt 92100, France.
Received: 1 April 2014 Accepted: 1 August 2014 Published: 21 August 2014
References
1. Costantino F, Talpin A, Said-Nahal R, Goldberg M, Henny J, Chiocchia G, Garchon H-J, Zins M, Breban M: Prevalence of spondyloarthritis in reference to HLA-B27 in the French population: results of the GAZEL cohort. Ann Rheum Dis 2013, doi:10.1136/annrheumdis-2013-204436. 2. Smith JA, Barnes MD, Hong D, DeLay ML, Inman RD, Colbert RA: Gene
expression analysis of macrophages derived from ankylosing spondylitis patients reveals interferon-gamma dysregulation. Arthritis Rheum 2008, 58:1640–1649.
3. Gu J, Wei Y-L, Wei JCC, Huang F, Jan M-S, Centola M, Frank MB, Yu D: Identification of RGS1 as a candidate biomarker for undifferentiated spondylarthritis by genome-wide expression profiling and real-time polymerase chain reaction. Arthritis Rheum 2009, 60:3269–3279. 4. Duan R, Leo P, Bradbury L, Brown MA, Thomas G: Gene expression profiling reveals a downregulation in immune-associated genes in patients with AS. Ann Rheum Dis 2010, 69:1724–1729.
5. Assassi S, Reveille JD, Arnett FC, Weisman MH, Ward MM, Agarwal SK, Gourh P, Bhula J, Sharif R, Sampat K, Mayes MD, Tan FK: Whole-blood gene expression profiling in ankylosing spondylitis shows upregulation of toll-like receptor 4 and 5. J Rheumatol 2011, 38:87–98.
6. Pimentel-Santos FM, Ligeiro D, Matos M, Mourão AF, Costa J, Santos H, Barcelos A, Godinho F, Pinto P, Cruz M, Fonseca JE, Guedes-Pinto H, Branco JC, Brown MA, Thomas GP: Whole blood transcriptional profiling in ankylosing spondylitis identifies novel candidate genes that might contribute to the inflammatory and tissue-destructive disease aspects. Arthritis Res Ther 2011, 13:R57. 7. Sharma SM, Choi D, Planck SR, Harrington CA, Austin CR, Lewis JA, Diebel
TN, Martin TM, Smith JR, Rosenbaum JT: Insights in to the pathogenesis of axial spondyloarthropathy based on gene expression profiles. Arthritis Res Ther 2009, 11:R168.
8. Breban M, Hacquard-Bouder C, Falgarone G: Animal models of HLA-B27-associated diseases. Curr Mol Med 2004, 4:31–40.
9. Hacquard-Bouder C, Falgarone G, Bosquet A, Smaoui F, Monnet D, Ittah M, Breban M: Defective costimulatory function is a striking feature of antigen-presenting cells in an HLA-B27-transgenic rat model of spondylarthropathy. Arthritis Rheum 2004, 50:1624–1635.
10. Hacquard-Bouder C, Chimenti M-S, Giquel B, Donnadieu E, Fert I, Schmitt A, André C, Breban M: Alteration of antigen-independent immunologic synapse formation between dendritic cells from HLA-B27-transgenic rats and CD4+ T cells: selective impairment of costimulatory molecule engagement by mature HLA-B27. Arthritis Rheum 2007, 56:1478–1489. 11. Glatigny S, Fert I, Blaton MA, Lories RJ, Araujo LM, Chiocchia G, Breban M:
Proinflammatory Th17 cells are expanded and induced by dendritic cells in spondylarthritis-prone HLA-B27-transgenic rats. Arthritis Rheum 2012, 64:110–120.
12. Utriainen L, Firmin D, Wright P, Cerovic V, Breban M, McInnes I, Milling S: Expression of HLA-B27 causes loss of migratory dendritic cells in a rat model of spondylarthritis. Arthritis Rheum 2012, 64:3199–3209.
13. Araujo L, Fert I, Jouhault Q, Labroquère K, Andrieu M, Chiocchia G, Breban M: Increased production of interleukin-17 over interleukin-10 by regulatory T cells implicates ICOS molecule in experimental spondyloarthritis. Arthritis Rheum 2014, doi:10.1002/art.38737.
14. Rudwaleit M, van der Heijde D, Landewé R, Listing J, Akkoc N, Brandt J, Braun J, Chou CT, Collantes-Estevez E, Dougados M, Huang F, Gu J, Khan MA, Kirazli Y, Maksymowych WP, Mielants H, Sørensen IJ, Ozgocmen S, Roussou E, Valle-Oñate R, Weber U, Wei J, Sieper J: The development of Assessment of SpondyloArthritis international Society classification criteria for axial spondyloarthritis (part II): validation and final selection. Ann Rheum Dis 2009, 68:777–783.
15. Dutertre C-A, Amraoui S, DeRosa A, Jourdain J-P, Vimeux L, Goguet M, Degrelle S, Feuillet V, Liovat A-S, Müller-Trutwin M, Decroix N, Deveau C, Meyer L, Goujard C, Loulergue P, Launay O, Richard Y, Hosmalin A: Pivotal role of M-DC8+monocytes from viremic HIV-infected patients in TNFα
overproduction in response to microbial products. Blood 2012, 120:2259–2268.
16. Gautier L, Cope L, Bolstad BM, Irizarry RA: affy–analysis of Affymetrix GeneChip data at the probe level. Bioinformatics 2004, 20:307–315. 17. Dai M, Wang P, Boyd AD, Kostov G, Athey B, Jones EG, Bunney WE, Myers
RM, Speed TP, Akil H, Watson SJ, Meng F: Evolving gene/transcript definitions significantly alter the interpretation of GeneChip data. Nucl Acids Res 2005, 33:e175–e175.
18. Smyth GK: Linear models and empirical bayes methods for assessing differential expression in microarray experiments. Stat Appl Genet Mol Biol 2004, 3:Article 3.
19. Genomatix - NGS Data Analysis & Personalized Medicine. [https://www. genomatix.de/]
20. Plessy C, Desbois L, Fujii T, Carninci P: Population transcriptomics with single-cell resolution: a new field made possible by microfluidics: a technology for high throughput transcript counting and data-driven definition of cell types. Bioessays 2013, 35:131–140.
21. Fert I, Cagnard N, Glatigny S, Letourneur F, Jacques S, Smith JA, Colbert RA, Taurog JD, Chiocchia G, Araujo LM, Breban M: Reverse interferon signature is characteristic of antigen-presenting cells in human and rat
spondyloarthritis. Arthritis Rheum 2014, 66:841–851. 22. Zhu J, Yu DTY: Matrix metalloproteinase expression in the
spondyloarthropathies. Curr Opin Rheumatol 2006, 18:364–368. 23. Maksymowych WP, Landewé R, Conner-Spady B, Dougados M, Mielants H,
van der Tempel H, Poole AR, Wang N, van der Heijde D: Serum matrix metalloproteinase 3 is an independent predictor of structural damage progression in patients with ankylosing spondylitis. Arthritis Rheum 2007, 56:1846–1853.
24. Mattey DL, Packham JC, Nixon NB, Coates L, Creamer P, Hailwood S, Taylor GJ, Bhalla AK: Association of cytokine and matrix metalloproteinase profiles with disease activity and function in ankylosing spondylitis. Arthritis Res Ther 2012, 14:R127.
25. Kevorkian L, Young DA, Darrah C, Donell ST, Shepstone L, Porter S, Brockbank SMV, Edwards DR, Parker AE, Clark IM: Expression profiling of metalloproteinases and their inhibitors in cartilage. Arthritis Rheum 2004, 50:131–141.
26. Bragança J, Swingler T, Marques FIR, Jones T, Eloranta JJ, Hurst HC, Shioda T, Bhattacharya S: Human CREB-binding protein/p300-interacting transactivator with ED-rich tail (CITED) 4, a new member of the CITED family, functions as a co-activator for transcription factor AP-2. J Biol Chem 2002, 277:8559–8565.
27. Lou X, Sun S, Chen W, Zhou Y, Huang Y, Liu X, Shan Y, Wang C: Negative feedback regulation of NF-κB action by CITED2 in the nucleus. J Immunol 2011, 186:539–548.
28. Goodman RH, Smolik S: CBP/p300 in cell growth, transformation, and development. Genes Dev 2000, 14:1553–1577.
29. Bai L, Merchant JL: A role for CITED2, a CBP/p300 interacting protein, in colon cancer cell invasion. FEBS Lett 2007, 581:5904–5910.
30. Lee JY, Taub PJ, Wang L, Clark A, Zhu LL, Maharam ER, Leong DJ, Ramcharan M, Li Z, Liu Z, Ma Y-Z, Sun L, Zaidi M, Majeska RJ, Sun HB: Identification of CITED2 as a negative regulator of fracture healing. Biochem Biophys Res Commun 2009, 387:641–645.
31. Leong DJ, Li YH, Gu XI, Sun L, Zhou Z, Nasser P, Laudier DM, Iqbal J, Majeska RJ, Schaffler MB, Goldring MB, Cardoso L, Zaidi M, Sun HB: Physiological loading of joints prevents cartilage degradation through CITED2. FASEB J 2011, 25:182–191.
Talpinet al. Arthritis Research & Therapy 2014, 16:417 Page 8 of 9 http://arthritis-research.com/content/16/4/417
32. Goldring SR, Goldring MB: Eating bone or adding it: the Wnt pathway decides. Nat Med 2007, 13:133–134.
33. Laine CM, Joeng KS, Campeau PM, Kiviranta R, Tarkkonen K, Grover M, Lu JT, Pekkinen M, Wessman M, Heino TJ, Nieminen-Pihala V, Aronen M, Laine T, Kröger H, Cole WG, Lehesjoki A-E, Nevarez L, Krakow D, Curry CJR, Cohn DH, Gibbs RA, Lee BH, Mäkitie O: WNT1 mutations in early-onset osteoporosis and osteogenesis imperfecta. N Engl J Med 2013, 368:1809–1816. 34. Bennett CN, Longo KA, Wright WS, Suva LJ, Lane TF, Hankenson KD,
MacDougald OA: Regulation of osteoblastogenesis and bone mass by Wnt10b. Proc Natl Acad Sci U S A 2005, 102:3324–3329.
35. Franck H, Meurer T, Hofbauer LC: Evaluation of bone mineral density, hormones, biochemical markers of bone metabolism, and osteoprotegerin serum levels in patients with ankylosing spondylitis. J Rheumatol 2004, 31:2236–2241.
36. Manicassamy S, Reizis B, Ravindran R, Nakaya H, Salazar-Gonzalez RM, Wang Y-C, Pulendran B: Activation of beta-catenin in dendritic cells regulates immunity versus tolerance in the intestine. Science 2010, 329:849–853. 37. Nishita M, Yoo SK, Nomachi A, Kani S, Sougawa N, Ohta Y, Takada S, Kikuchi A,
Minami Y: Filopodia formation mediated by receptor tyrosine kinase Ror2 is required for Wnt5a-induced cell migration. J Cell Biol 2006, 175:555–562. 38. Nomachi A, Nishita M, Inaba D, Enomoto M, Hamasaki M, Minami Y:
Receptor tyrosine kinase Ror2 mediates Wnt5a-induced polarized cell migration by activating c-Jun N-terminal kinase via actin-binding protein filamin A. J Biol Chem 2008, 283:27973–27981.
39. Dhaenens M, Fert I, Glatigny S, Haerinck S, Poulain C, Donnadieu E, Hacquard-Bouder C, André C, Elewaut D, Deforce D, Breban M: Dendritic cells from spondylarthritis-prone HLA-B27-transgenic rats display altered cytoskeletal dynamics, class II major histocompatibility complex expression, and viability. Arthritis Rheum 2009, 60:2622–2632. 40. Johnson K, Hashimoto S, Lotz M, Pritzker K, Terkeltaub R: Interleukin-1
induces pro-mineralizing activity of cartilage tissue transglutaminase and factor XIIIa. Am J Pathol 2001, 159:149–163.
41. Hoppe B, Häupl T, Skapenko A, Ziemer S, Tauber R, Salama A, Schulze-Koops H, Burmester G-R, Dörner T: Fibrinogen and factor XIII A-subunit genotypes interactively influence C-reactive protein levels during inflammation. Ann Rheum Dis 2012, 71:1163–1169.
42. Sarraj B, Ludányi K, Glant TT, Finnegan A, Mikecz K: Expression of CD44 and L-selectin in the innate immune system is required for severe joint inflammation in the proteoglycan-induced murine model of rheumatoid arthritis. J Immunol2006, 177:1932–1940.
doi:10.1186/s13075-014-0417-0
Cite this article as: Talpin et al.: Monocyte-derived dendritic cells from HLA-B27+axial spondyloarthritis (SpA) patients display
altered functional capacity and deregulated gene expression. Arthritis Re-search & Therapy 2014 16:417.
Submit your next manuscript to BioMed Central and take full advantage of:
• Convenient online submission
• Thorough peer review
• No space constraints or color figure charges
• Immediate publication on acceptance
• Inclusion in PubMed, CAS, Scopus and Google Scholar
• Research which is freely available for redistribution
Submit your manuscript at www.biomedcentral.com/submit