Publisher’s version / Version de l'éditeur:
Vous avez des questions? Nous pouvons vous aider. Pour communiquer directement avec un auteur, consultez la
première page de la revue dans laquelle son article a été publié afin de trouver ses coordonnées. Si vous n’arrivez pas à les repérer, communiquez avec nous à PublicationsArchive-ArchivesPublications@nrc-cnrc.gc.ca.
Questions? Contact the NRC Publications Archive team at
PublicationsArchive-ArchivesPublications@nrc-cnrc.gc.ca. If you wish to email the authors directly, please see the first page of the publication for their contact information.
https://publications-cnrc.canada.ca/fra/droits
L’accès à ce site Web et l’utilisation de son contenu sont assujettis aux conditions présentées dans le site LISEZ CES CONDITIONS ATTENTIVEMENT AVANT D’UTILISER CE SITE WEB.
Internal Report (National Research Council of Canada. Division of Building Research), 1961-06-01
READ THESE TERMS AND CONDITIONS CAREFULLY BEFORE USING THIS WEBSITE.
https://nrc-publications.canada.ca/eng/copyright
NRC Publications Archive Record / Notice des Archives des publications du CNRC : https://nrc-publications.canada.ca/eng/view/object/?id=3e664ddb-b3d8-42e6-949d-e78c0a22f9c3 https://publications-cnrc.canada.ca/fra/voir/objet/?id=3e664ddb-b3d8-42e6-949d-e78c0a22f9c3
NRC Publications Archive
Archives des publications du CNRC
For the publisher’s version, please access the DOI link below./ Pour consulter la version de l’éditeur, utilisez le lien DOI ci-dessous.
https://doi.org/10.4224/20338131
Access and use of this website and the material on it are subject to the Terms and Conditions set forth at
Energy balance at the surface of saturated peat moss
NATIONAL RESEARCH COUNCIL CANADA
D I V I S I O N OF B U I L D I N G RESEARCH
THE
EmERGY BALANCE AT THE SURFACE O F SATURATED PEAT MOSSby G.
P.
Williams Internal R e p o r t No. 223 o f the Division o f Building R e s e a r c h OT'PAWA June 1961PREFACE
S t u d i e s of t h e energy balance a t v a r i o u s n a t u r a l s u r f a c e s may seem f a r removed from b u i l d i n g r e s e a r c h , b u t many of t h e b u i l d i n g problems which a r e p e c u l i a r t o Canada a r i s e from t h e combination of t e r r a i n and c l i m a t e . Ground temperatures, which a r e determined by t h e s u r f a c e energy exchanges, o f t e n e n t e r i n t o problems i n v o l v i n g h e a t l o s s e s from b u r i e d s t r u c t u r e s , depth of annual f r o s t p e n e t r a t i o n under roads and s t r e e t s , changes i n a snow cover, and permafrost occurrence and degradation.
The p r e s e n t r e p o r t d e a l s with measurements of energy exchange a t t h e s u r f a c e of a wet moss cover. This i s of p a r t i c u l a r i n t e r e s t i n view of t h e a p p a r e n t h i g h i n s u l a t i n g value a t t r i b u t e d t o n a t u r a l moss covers
i n permafrost a r e a s . The a u t h o r , a r e s e a r c h o f f i c e r w i t h t h e Snow and I c e S e c t i o n , h a s a s p e c i a l i n t e r e s t
i n evaporative and o t h e r processes involved i n energy exchanges a t n a t u r a l ground, w a t e r , i c e and snow
s u r f a c e s .
Ottawa
THE ENERGY BALANCE AT THE SUlXFACE OF SATURATED PEAT MOSS
G.
P.
WilliamsThis r e p o r t i s concerned with measurement o f t h e d i f f e r e n t components of t h e energy balance equation a t t h e s u r f a c e o f s a t u r a t e d peat. F i e l d experiments were c a r r i e d out a t Ottawa during t h e summer of 1960 a t t h e r e q u e s t o f
t h e Northern Building Section of t h e Division o f Building Research. I t was considered t h a t t h i s s t u d y would provide experience with i n s t r u m e n t a t i o n which would prove valuable i n planning energy exchange s t u d i e s f o r t h e w i n t e r season a t Ottawa, and i n planning s i m i l a r experiments a t o t h e r s i t e s .
I n cooperation w i t h M r , Roger Brown of t h e Northern Building S e c t i o n , p e a t samples were obtained from t h e Mer Bleu p e a t bog l o c a t e d approximately 1 0 miles s o u t h e a s t of Ottawa, These samples were placed i n -hvo metal t a n k s ( 4 f t i n diameter, 1 f t i n d e p t h ) i n s t a l l e d i n t h e ground so t h a t t h e i r s u r f a c e s were l e v e l w i t h t h e surrounding n a t u r a l g r a s s cover. One t a n k was maintained i n a s a t u r a t e d c o n d i t i o n , whereas i n t h e second t a n k t h e water l e v e l was maintained
6 i n , below t h e surface. I n t h i s r e p o r t , Tank No. 1 w i l l r e f e r t o t h e s a t u r a t e d sample and Tank No. 2 t o t h e un-
s a t u r a t e d sample.
Because t h e r e was only one s u i t a b l e n e t radiometer a v a i l a b l e , a l l energy balance s t u d i e s were made w i t h t h e s a t u r a t e d sample. Although some comparisons o f evaporation r a t e s and thermal c o e f f i c i e n t s a r e made between t h e two t a n k s , t h i s r e p o r t i s p r i m a r i l y concerned w i t h t h e energy balance a t t h e surface of Tank No. 1. Some observations on t h e energy balance from a 1 0 - f t water t a n k a r e included i n o r d e r t o e v a l u a t e f u r t h e r t h e technique and i n s t r u m e n t a t i o n used i n t h i s t r i a l p r o j e c t .
The energy balance equation a t t h e evaporating s u r f a c e of t h e s a t u r a t e d p e a t sample, n e g l e c t i n g h e a t flow through t h e s i d e s of t h e t a n k , can be expressed a s :
where
Qn = n e t r a d i a t i o n , considered p o s i t i v e when n e t energy flows downward t o t h e s u r f a c e Qs = r a t e of change of h e a t s t o r a g e i n t h e sample,
considered p o s i t i v e when t h e s t o r e d h e a t i s decreasing and h e a t i s being supplied t o t h e evaporating s u r f a c e
Qb = h e a t flow through t h e bottom of t h e sample, considered p o s i t i v e when h e a t i s flowing upward t o t h e s u r f a c e
Qe = evaporative h e a t , negative when energy i s being used f o r evaporation
Qc = coavective h e a t , p o s i t i v e when h e a t i s
moving t o t h e s u r f a c e from t h e a i r ( a i r i s warmer t h a n s u r f a c e ) .
I n
t h e s e experiments, t h e components$,
Qs, Q b , Qe were measured. A s it i s m o s t d i f f i c u l t t o measure t h e convective h e a t component, Qc was obtained i n d i r e c t l y . The success of t h i s s t u d y depended on t h e accuracy w i t h which t h e s e components could be estimated and c o n s i d e r a b l e e f f o r t was expended i n c a l i b r a t i n g and checking t h e v a r i o u s instruments used.Figure 1 i s a diagram of t h e i n s t r u m e n t s and peat sample i n p l a c e ; Figure 2 c o n t a i n s two photographs of t h e f i n a l i n s t a l l a t i o n .
&,
-
Net r a d i a t i o n measurementPerhaps t h e most d i f f i c u l t p a r t of t h e program was t o measure t h e n e t r a d i a t i o n . Considerable d i f f i c u l t y had been experienced p r e v i o u s l y i n o b t a i n i n g c a l i b r a t i o n f a c t o r s f o r Schulze and f o r Beckman and Whitley n e t radiometers, t h e two instruments a v a i l a b l e f o r t h i s study.
The Beckman and Vilhitley radiometer was most s u i t a b l e f o r t h e f o l l o w i n g reasons:
(1) The Schulze radiometer c a s t a much l a r g e r shadow on t h e exposed s u r f a c e . This shadow e f f e c t must be consf dered f o r a r e a s t h e ' s i z e of t h e 4 - f t diameter tank.
( 2 ) P a r l e s s computation time i s r e q u i r e d t o o b t a i n t h e n e t r a d i a t i o n w i t h t h e Beckman and Whitley instrument.
( 3 ) During t h e summer months, t h e output of t h e Schulze sometimes exceeded t h e s c a l e of t h e r e c o r d e r used. The c a l i b r a t i o n c o n s t a n t of t h e Beclman and Whitley instrument was checked i n two ways: it was compared w i t h t h e Schulze which was used i n t h i s case a s t h e s t a n d a r d ; a f i e l d
method was developed and i s c a l l e d t h e "aluminum p l a t e technique". Dc-tails of t h i s second. method a r e given i n Appendix A. D e t a i l s
of t h e f i r s t method a r e presented i n a n unpublished r e p o r t by
M r . S. Tavares, a summer s t u d e n t w i t h t h e Snow and I c e S e c t i o n d u r i n g t h e summer of 1960.
For both methods of c a l i b r a t i o n one has t o choose a c l e a r day when t h e n e t r a d i a t i o n i s steady. Over t h e period J u l y t o September, 1960, t h e r e were v e r y few days i d e a l f o r c a l i b r a t i o n t e s t s . A s t h e most favourable c o n d i t i o n s occurred
4
August 1960, c a l i b r a t i o n r e s u l t s obtained on t h a t day a r e considered most r e l i a b l e . C a l i b r a t i o n f a c t o r s obtained a r e a s follows:Method I
-
Comparison w i t h Schulze= 9.4 mv/cal cm-2 min-I Method I1
-
Aluminum P l a t e TechniqueThe c a l i b r a t i o n f a c t o r f o r t h e Beckman and Whitley instrument used i n t h e a n a l y s i s was t h u s assumed t o be 9.5 rnv/cal cm-2 min-l, which a g r e e s w i t h i n 1 0 p e r c e n t with t h e manufacturer1 s c a l i b r a t i o n of 10.3 mv/cal-cm-2-min-1. The radiometer s u r f a c e was painted w i t h o p t i c a l b l a c k p a i n t i n June 1960 and might be one reason f o r t h i s d i f f e r e n c e . Q,
-
Rate of change of h e a t s t o r a g eThe r a t e of change of h e a t s t o r a g e i n t h e p e a t sample over a given period of time was obtained by using t h e following equation:
where
4
= s p e c i f i c h e a t c a l o r i e s / g m " ~p
= d e n s i t y-
-/ccT1 = mean temperature of peat sample a t beginning of period O C
T2 = mean temperature of peat sample a t end of period O C
V = volume of p e a t sample/sq cm ( c c )
The mean temperatures were obtained by averaging h o u r l y values from t h e t h r e e thermocouples i n s t a l l e d i n t h e
p e a t a s shown i n Fig. 1. The s p e c i f i c h e a t of s a t u r a t e d p e a t was assumed equal t o 1.0 cal/gm°C and t h e d e n s i t y of a t y p i c a l
sample o f s a t u r a t e d p e a t was measured a t 1.1 gm/cc. It was e s t i m a t e d t h a t t h e weight of f r e e o r g r a v i t a t i o n a l w a t e r was over 70 p e r c e n t of t h e t o t a l weight of t h e sample. It was considered t h a t Qs could be o b t a i n e d by t h i s method w i t h s u f f i c i e n t accuracy f o r t r i a l experiments.
Q,
-
Measurement of h e a t flow through bottom of t a n k Keat flow through t h e bottom of t h e t a n k s was measured u s i n g Beckman and Whitley h e a t meters f a s t e n e d t o t h e i r i n n e r s u r f a c e s . The h e a t meters were c a l i b r a t e d by comparing t h e i r o u t p u t i n m i l l i v o l t s w i t h t h e hovm h e a t f l o w through a s l a b of r u b b e r under s t e a d y s t a t e c o n d i t i o n s . D e t a i l s of c a l i b r a t i o n and i n s t a l l a t i o n a r e given i n Appendix B.The c a l i b r a t i o n v a l u e s o b t a i n e d a r e compared w i t h
t h e manufacturer's c a l i b r a t i o n i n Pig.
3 .
They a r e c o n s i d e r a b l y h i g h e r and do n o t a p p e a r t o depend on t e m p e r a t u r e , a t l e a s t f o r t h e temperature r a n g e s checked. A f u r t h e r check was made by c a l c u l a t i n g t h e thermal c o n d u c t i v i t y of t h e p e a t samples, u s i n g t h e h e a t meter c a l i b r a t i o n v a l u e s and comparing t h e thermalc o n d u c t i v i t i e s obtained w i t h t h o s e r e p o r t e d by o t h e r i n v e s t i g a t o r s . D e t a i l s of t h e s e c a l c u l a t i o n s , i n c l u d i n g t h e assumptions made,
a r e a t t a c h e d a s p a r t of Appendix B.
The v a l u e s of thermal c o n d u c t i v i t y o b t a i n e d were i n r e a s o n a b l e agreement w i t h v a l u e s r e p o r t e d i n t h e l i t e r a t u r e .
It was considered t h a t t h e hea% meters gave r e s u l t s c o n s i s t e n t enough f o r Q b t o be measured w i t h s u f f i c i e n t
accuracy f o r t h e s e t r i a l experiments.
Qp
-
Evaporation measurementEvaporation was measured by t h e same technique a s i s used w i t h t h e s t a n d a r d C l a s s A e v a p o r a t i o n pan. P l a s t i c s t i l l i n g w e l l s 4 - i n . i n d i a m e t e r were placed i n t h e t a n k s a s shorvn i n Pig. 1, and t h e l e v e l of w a t e r i n them was determined by a p o i n t e r placed i n t h e c e n t r e . A s t h e r e was f r e e passage of w a t e r from t h e p e a t samples i n t o t h e s t i l l i n g w e l l , t h e w a t e r l e v e l s i n t h e s t i l l i n g w e l l and i n t h e samples were assumed equal.
The t a n k was f i l l e d each morning t o t h e t o p of t h e pointed marker. I t was assumed t h a t t h e amount of w a t e r
added e q u a l l e d t h e amount of w a t e r l o s t by e v a p o r a t i o n f o r t h e preceding 24 h o u r s . The volume of w a t e r added was measured w i t h a c o n t a i n e r graduated s o t h a t 1 i n . of w a t e r i n t h e
c o n t a i n e r equalled 1/100 i n . over t h e s u r f a c e of t h e 4 - f t
diameter tank.
If r a i n f e l l d u r i n g t h e 24-hr period preceding measurement, t h e amount of r a i n f a l l measured w i t h a standard r a i n gauge and t h e amount of water added w i t h t h e graduated c o n t a i n e r were t o t a l l e d t o give t h e t o t a l evaporation. I f t h e r a i n f a l l exceeded evaporation ( i f t h e water l e v e l was above t h e p o i n t e r ) , evaporation was n o t c a l c u l a t e d u n t i l
(because of a d d i t i o n a l e v a p o r a t i o n ) t h e water l e v e l dropped below t h e l e v e l of t h e p o i n t e r . I n t h i s c a s e , t h e evaporation r a t e obtained was f o r a period l o n g e r t h a n 24 hours, u s u a l l y 48 hours.
This method of evaporation measurement has s e v e r a l shortcomings. It was d i f f i c u l t t o judge a c c u r a t e l y t h e amount of water t o be added each day; furthermore, i f t o o much was added it was n o t f e a s i b l e t o remove t h e e x c e s s , a s i s possible i n t h e case of t h e Class A evaporation pan. During a period of r a i n t h e c a l c u l a t e d evaporation would be no more a c c u r a t e t h a n t h e recorded r a i n f a l l , which can be i n e r r o r , p a r t i c u l a r l y f o r summer showers accompanied by wind.
A d e t a i l e d a n a l y s i s of t h e evaporation measurements was made f o r t h e period June 24 t o J u l y 29, and t h e r e c o r d s a r e given i n Appendix C. This a n a l y s i s i n d i c a t e d t h a t t h e method of measuring evaporation was s a t i s f a c t o r y f o r 7 t o 4 day averages, but on a d a i l y b a s i s t h e measurements were n o t a c c u r a t e enough t o be used i n energy balance c a l c u l a t i o n s .
Qc
-
t h e convective componentThe d i r e c t measurement of Q t h e convective component, c
'
i s most d i f f i c u l t and was n o t attempted i n t h i s study. Two methods of o b t a i n i n g values f o r Qc were used. I n t h e first method, Q was obtained by measuring a l l o t h e r components i n
C
equation (1) and by assuming t h a t t h e remainder equaled Q c .
A s a l l t h e e r r o r s i n measuring
g,
Q b , Q,, Qe may be accumulated i n Qc, it r e q u i r e s v e r y a c c u r a t e measurements of t h e s e o t h e r components t o o b t a i n a r e l i a b l e value o f Qc.I n t h e second method a r e l a t i o n s h i p known a s t h e Bowens r a t i o i s assumed between Q and Qe. The expression i s :
where
Ts = s u r f a c e temperature O C
Ta = a i r temperature O C 4 f t above s u r f a c e
e = vapour pressure of a i r a t t h e s u r f a c e (mb)
S
= vapour pressure of a i r 4 f t above t h e
ea s u r f a c e (mb)
A s t h e sum of Qc + Qe can be obtained by measuring t h e o t h e r components i n equation ( I ) , t h e r e l a t i v e value of Qc and Qe can be estimated if Ts, T a , e s , ea a r e lmown.
From t h e a n a l y s i s , t w o values of Qc and Qe were t h u s obtained.
Q c l
r e f e r s t o t h e value of Qc c a l c u l a t e d by t h e f i r s t method, and Q r e f e r s t o t h e value of Qe t h a t was
e
,
Iobtained by measurement. and Q r e f e r t o v a l u e s obtained e2
by u s i n g Bowen's r a t i o , B y comparing v a l u e s obtained by t h e s e two methods t h e amount of confidence t h a t could be placed i n t h e r e s u l t s of t h i s energy balance a n a l y s i s was a s s e s s e d ,
ENERGY BALANCE ANALYSIS S a t u r a t e d Peat
Figure 4 i s a g r a p h i c a l p l o t of
3-
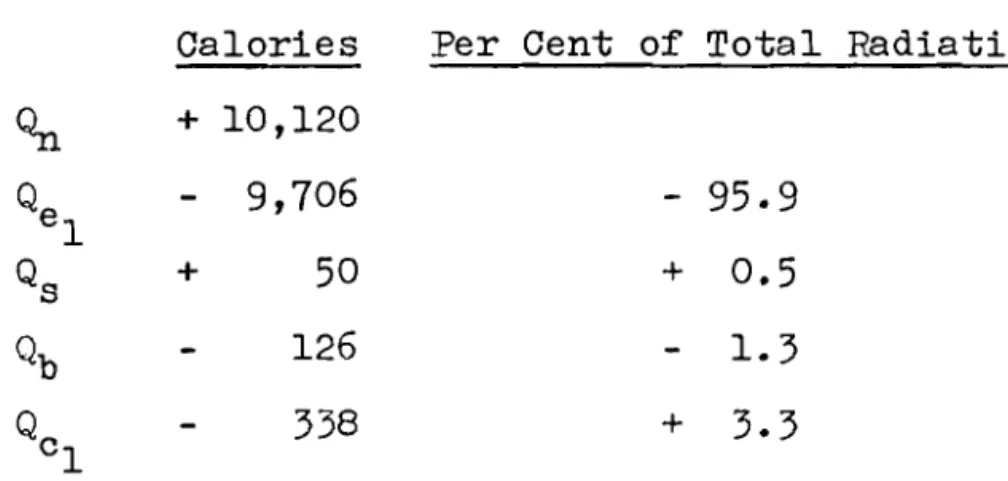
t o 4-day average v a l u e s f o r t h e d i f f e r e n t components of t h e energy balance f o r August 9 t o September 1 9 , 1960, t h e period analyzed i n d e t a i l , These values a r e given a l s o i n Table I . I t may be seen t h a t t h e h e a t from t h e r a d i a t i o n absorbed a t t h e s u r f a c e i s l a r g e l y balanced by t h e h e a t r e q u i r e d f o r t h e observed evaporation. The h e a t l o s t through t h e bottom of t h e t a n k , t h e change i n h e a t content of t h e moss, and t h e convective h e a t t r a n s f e r component a r e small f r a c t i o n s of t h e t o t a l r a d i a t i o n energy received during t h i s period.The accumulated energy l o s s e s o r g a i n s f o r t h e v a r i o u s components of t h e energy balance f o r t h i s period a r e summarized a s follows:
C a l o r i e s Per Cent of T o t a l Radiation
The accumulated v a l u e s of t h e convective and
evaporative components, u s i n g Bowenfs r a t i o , a r e a s f o l l o w s : Qe2 = -9341 c a l (92.3 p e r c e n t of t o t a l r a d i a t i o n ) Qc2 =
-
700 c a l (6.9 p e r c e n t of t o t a l r a d i a t i o n ) Values of t h e f a c t o r s r e q u i r e d t o c a l c u l a t e Bowenfs r a t i o , i n c l u d i n g d e t a i l s of how t h e r e c o r d s were o b t a i n e d , a r e presented i n Table 11.Although t h e accumulated average v a l u e s of Q and el Q c compare reasonably w e l l w i t h Qe and Qc
,
t h e r e s u l t s a r e1 3 C )
I L L
n o t s o s a t i s f a c t o r y i f 3- t o 4-day averages a r e compared. Figure
5
shows t h e 3- t o 4-day average v a l u e s o f Qc and Q1 el
compared t o Qc and Qe
.
I n a d d i t i o n , v a l u e s of Bowen's r a t i oQ c l 2 2 (To
-
T a )R1 =
%
i s compared w i t h R2 = 0.61 es-
ea f o r3-
t o $-dayI
periods. On a 3- t o 4-day b a s i s t h e r e i s c o n s i d e r a b l e d i f f e r e n c e between R1 and R2 and t h u s c o n s i d e r a b l e d i f f e r e n c e between Q,
1
and Qc
,
and Qe,
and Q~.
2 1 2
A s t h e d i f f e r e n c e between Q and Qc i s of t h e
C1 2
same magnitude a s v a l u e s of t h e convective component, n o t much confidence can be placed i n t h e value of Qc obtained by e i t h e r c a l c u l a t i o n f o r 3- t o 4-day periods. Since t h e v a l u e s f o r t h e evaporation component, however, a r e l a r g e i n comparison w i t h t h e d i f f e r e n c e between Qe and Qe
,
more confidence can be1 2
I n i n t e r p r e t i n g t h e s e r e s u l t s , t h e probable
accuracy of t h e measured v a l u e s of t h e energy balance components should be considered. The change i n h e a t c o n t e n t of t h e moss o r t h e h e a t flow through t h e bottom could be i n e r r o r by a l a r g e p e r c e n t without a f f e c t i n g a p p r e c i a b l y t h e balance obtained. I f however, e i t h e r t h e measured evaporation o r measured r a d i a t i o n a r e i n e r r o r , t h e f i n a l balance would be a f f e c t e d considerably.
For example, if t h e manufacturer's c a l i b r a t i o n of 10.3 mv/cal-crn-2 min-I i s used f o r t h e Beckman and Whitley radiometer i n s t e a d of 9.5 mv/cal-cm-* min-l, t h e following balance may be obtained f o r t h e period August 9 t o September 1 9 , 1960:
C a l o r i e s
Under t h e s e circumstances Q i s p o s i t i v e , +482
C
c a l o r i e s compared t o a negative value of -338 c a l o r i e s
obtained i n t h e f i r s t balance. A s t h e mean s u r f a c e tempera- t u r e of t h e p e a t , T,, was g r e a t e r than t h e mean a i r tempera- t u r e , Ta, over t h e period analyzed, h e a t should be t r a n s f e r r e d from t h e surface t o t h e a i r by convective a c t i o n , i . e . , t h e negative value appears t o be t h e most l i k e l y value f o r Qc. I t
i s evident t h a t t h e r a d i a t i o n temn has t o be measured a c c u r a t e l y if t h e convective term i s t o be determined by t h e energy balance method
.
F h e r a ~ Balance of 1 0 - f t Water Tank
On September 30, 1960, t h e radiometer was moved over a shallow 1 0 - f t diameter water t a n k i n s t a l l e d a t t h e Ottawa s i t e . An energy balance was attempted f o r a water s u r f a c e , using t h e same g e n e r a l techniques a s were used t o o b t a i n t h e energy balance over t h e p e a t sample. The r e s u l t s from t h i s study (Table 111) a r e presented i n t h i s r e p o r t because t h e y demonstrate t h e problem of o b t a i n i n g an energy balance when t h e n e t r a d i a t i o n and evaporation v a l u e s a r e comparatively small.
During t h e period October 1 t o 31 t h e c a l c u l a t e d and measured energy balance components gave reasonable values
-
a s t h e measured value of Qe agreed w i t h i n 10 per1
c e n t with t h e value Qe obtained by assuming Bowenfs r a t i o 2
v a l i d .
During t h e period November 1 t o 28 t h e measured evaporation d i d n o t agree with t h e value f o r evaporation
obtained by assuming Bowenfs r a t i o v a l i d . During t h i s p e r i o d , t h e evaporation measurements were n o t considered v e r y r e l i a b l e a s r a i n f a l l was f r e q u e n t during November. It should a l s o be pointed out t h a t a n e r r o r of 500 c a l o r i e s i n t h e n e t r a d i a t i o n would be l a r g e r t h a n t h e convective term, and about one h a l f t h e value o f t h e evaporative term. An e r r o r o f 500 c a l o r i e s i n n e t r a d i a t i o n f o r t h e period August 9 t o September 1 9
would have r e s u l t e d i n only a 5 p e r c e n t e r r o r i n t h e c a l c u l a - t e d evaporation, and would n o t have changed t h e g e n e r a l con- c l u s i o n s reached i n t h a t a n a l y s i s .
Prom December 7 t o
1 4 ,
an energy balance was attempted on t h e 1 0 - f t t a n k during a period of i c e formation. A sevaporation was n o t measured, t h e c a l c u l a t e d evaporation r a t e could n o t be compared with a measured evaporation r a t e . Under t h e s e circumstances n o t much confidence can be placed i n t h e r e s u l t s , a s an e r r o r i n r a d i a t i o n of 500 c a l o r i e s would be twice t h e sum of Qe + Qc and almost h a l f t h e energy used i n i c e growth. I t i s e v i d e n t t h a t when t h e n e t r a d i a t i o n term i s of t h e same magnitude a s t h e o t h e r terms i n t h e energy balance equation, it must be measured a c c u r a t e l y i f t h e o t h e r terms i n t h e equation a r e t o be determined by t h e energy
balance method.
GENERAL
DISCUSSIONThe major conclusions reached i n t h i s t r i a l p r o j e c t a r e summarized a s follows:
Measurement of n e t r a d i a t i o n p r e s e n t s t h e most d i f f i c u l t problem f o r a s t u d y o f t h i s kind. The Beckman and Whitley radiometer appears t o be adequate i f t h e magnitude of
t h e n e t r a d i a t i o n term i s l a r g e compared t o p o s s i b l e e r r o r s and i f measurements a r e averaged over a period of s e v e r a l days. V e n t i l a t e d type n e t radiometers a r e s u b j e c t t o e r r o r s , some of which a r e d i s c u s s e d by Suomi and o t h e r s (1).
( 2 ) Heat meters appear t o be a c c u r a t e enough f o r determining h e a t flow through t h e bottom of a tank. Since t h e y
t o analyze r e s u l t s , however, c o n s i d e r a t i o n should be given t o o t h e r methods o f o b t a i n i n g h e a t flow. Heat flow from t h e bottom need n o t be c a l c u l a t e d a s a s e p a r a t e item. Appropriate thermocouples can be
i n s t a l l e d and v a l u e s assumed f o r t h e t h e r m a l c o e f f i c i e n t s of t h e t e s t sample; from t h e s e o b s e r v a t i o n s t h e t o t a l
rate-of-change of h e a t s t o r a g e may be e s t i m a t e d a c c u r a t e l y enough f o r t h i s type of experiment.
( 3 ) The means of measuring e v a p o r a t i o n a p p e a r t o be adequate
f o r t h i s type of f i e l d study. Since a c c u r a c y of evapora- t i o n measurements depends on t h e a c c u r a c y w i t h which
p r e c i p i t a t i o n can be measured, t h e method. of measuring r a i n f a l l should be improved. I t might be p o s s i b l e t o i n s t a l l a metal t a n k of t h e same a r e a a s t h e t e s t samples t o measure r a i n f a l l , o r a s u i t a b l e network of s t a n d a r d r a i n gauges could be l o c a t e d around t h e t e s t a r e a .
( 4 ) If t h i s type of experiment i s t o be c a r r i e d o u t i n a p e a t bog t h e thermal and r a d i a t i o n a l p r o p e r t i e s of t h e surround-
i n g t e s t a r e a should be a b o u t t h e same a s t h e c o r r e s p o n d i n g p r o p e r t i e s of t h e t e s t sample. For example, it i s impor- t a n t t h a t t h e albedo of t h e t e s t s u r f a c e be a b o u t e q u a l t o t h e albedo of t h e s u r r o u n d i n g a r e a . Otherwise, t h e n e t r a d i a t i o n absorbed w i l l n o t be t h e same and t h e measured e v a p o r a t i o n w i l l . n o t be t y p i c a l of e v a p o r a t i o n
o v e r t h e t e s t a r e a . I n a d d i t i o n , t h e t e s t sample would be surrounded by a n a r e a w i t h perhaps q u i t e d i f f e r e n t e v a p o r a t i v e and convective boundary c o n d i t i o n s . I t may be d i f f i c u l t t o e v a l u a t e t h e e f f e c t of t h e d i s c o n t i n u i t y i n t h e boundary c o n d i t i o n s on t h e numbers which t h e
o b s e r v a t i o n s y i e l d .
( 5 ) I n a s t u d y of t h i s k i n d , t h e b e s t hope f o r s u c c e s s i s t o use f a i r l y long-term a v e r a g e s . With t h e a v a i l a b l e
i n s t r m e n t a t i o n it was impossible t o g e t c o n s i s t e n t r e s u l t s on a 24-hour b a s i s o r even on a 3- t o 4-day b a s i s . . I t h a r d l y seems j u s t i f i a b l e t h e r e f o r e , t o r e c o r d and analyze h o u r l y v a l u e s of a i r t e m p e r a t u r e , r a d i a t i o n and s o i l temperature. I n s t e a d , a s i m p l i f i e d approach t o t h e problem of measuring t h e d i f f e r e n t terms i n t h e energy balance e q u a t i o n m i g h t be c o n s i d e r e d where- by l o n g e r term a v e r a g e s of p r e c i p i t a t i o n , e v a p o r a t i o n , changes i n h e a t s t o r a g e , and r a d i a t i o n a r e used. For example, when t h e p e r i o d s e t f o r t h e b a l a n c e c a l c u l a - t i o n s i s one week o r more, r a d i a t i o n i n t e g r a t o r s t h a t r e a d t h e t o t a l r a d i a t i o n t o
-
+ 5 p e r c e n t would be extremely u s e f u l .( 6 ) Perhaps t h e most i m p o r t a n t l e s s o n l e a r n e d , and t h i s a p p l i e s e s p e c i a l l y t o t h e c a s e where a number of o b s e r v a t i o n s a r e t o be made and r e c o r d e d , i s t h a t
a n a l y s i s must proceed concurrently w i t h observations. I n t h i s way, observational e r r o r s can be d e t e c t e d and corrected before they s e r i o u s l y a f f e c t t h e purpose of t h e p r o j e c t . Furthermore, t h e experimenter can o b t a i n a r e a l i s t i c a p p r e c i a t i o n of t h e problems while t h e study
i s under way r a t h e r than a f t e r t h e observations have been completed.
The w r i t e r i s indebted t o s e v e r a l members of t h e Division of Building Research f o r h e l p f u l d i s c u s s i o n during t h e preparation of t h i s r e p o r t . The a s s i s t a n c e of M r . S.
Tavares, M r . R. G. Brown and M r . R. Amour i n preparing t h e experimental equipment i s g r a t e f u l l y acknowledged.
1. Suomi, V. E. and o t h e r s . An Improved Net-radiation
Instrument. Journal of Meteorology, Vol. 2 , No. 4 ,
Aug. 1954, p. 276
-
282.2. Geiger, R. The Climate Near t h e Ground. Harvard Univer- s i t y Press, 1950, 482 p.
TABLE I
ENERGY BALANCE COMPONENTS SATURATED 4-F'T PEAT MOSS AUGUST
9
TO SEPTEMBER19, 1960
P e r i o dI
Aug. 9-
12
"
12
-
15
"
15
-
19
'
I
19
-
22
It2 2 - 2 6
"
26
-
29
29
- S e p t , 2 S e p t .2
-
6
"
6 -
89 - 1 2
"
12
-
16
16
-
19
Qn Qe Qs Qb Qc Net R a d i a t i o n +332
+314
+
381
E v a p o r a t i o n-
264
-
278
-
296
H e a t S t o r a g e-
7
+9
+ 1 r a d i a t i o n r e c o r d s m i s s i n g +30
-
27
-
9
+19
-
28
-
33
+57
-
23
+
286
+336
+235
+202
+371
+
228
+151
+
188 H e a t Out Bottom-
3
-
6
-
7
-
266
-
318
-
247
-
225
-
382
-
218
-
199
-
150
C o n v e c t i o n-
58
-
39
-
79
-
5
-
4-
5
-
5
-
8 +3
+3
+4
-
45
+13
+
26
+9
+47
+20
-
12
-
19
TABLE I1
CALCULATION OF BOWEN'S R A T I O FOR OBSERVATION PERIODS
Ts = obtained from h o u r l y averages of thermocouple r e a d i n g s
4
i n . under s u r f a c e of p e a tTa = thermocouple
-
i n s m a l l s c r e e n 4 f t above groundPeriod
Aug. 9
-
1 2 12-
1 5
1 5
-
1 9e = obtained by assuming t h e a i r was s a t u r a t e d a t t h e temperature of t h e s u r f a c e ( e s - e "mb 10.6 8.7 9.4 (Is
-
T o + 1.36-
0.50+
1.20e, = obtained from h o u r l y averages f r o m dew-cell r e a d i n g s of dew-point R = 0.61
-
(aT
P e+
0.08-
0.04+
0.08 1 9-
22 22-
26 26-
29 29 -Sept.2 Sept. 2-
6 6 - 8 9-
12 1 2-
16 16-
1 9 n o t used-
r e a d i n g s u n r e l i a b l e + 0.21-
0.10+
0.02+
0.16-
0.05+
0.17 + 0.24+
0.16 + 3-30-
1.50+
0.28+
1.80-
0.72+
1.60+
1.30 + 2.50 9.7 9.0 8.4 6.7 8 . 4 5.7 3.4 9.4TABLE I11
BEST ESTIIVLATE OF
ENERGY
BALANCE 10-FT TANK OF WATER OTTAWA 1960 Qn n e t r a d i a t i o n-
1180 ( w a t e r ) change i n Qs s t o r a g e energy Qb h e a t flow o u t bottom of t a n k 9, energy i c e growth Qe + 'c measured Q e l Q remainder C1 R Bowenfs r a t i o + 7 1 0 0+
2251-
2020-
231 + 113+
28 0 +5 1
-
940 + 9 9 1I
+
.16 + 51+
7
+ 1360-
238-
-
-
-067-
4 +55
Qe2 c a l c u l a t e d 'c2 c a l c u l a t e d+
2.01-
79
-
153-
1890-
361ROUND EVEL
/-
BECKMAN 8 WHITLEY NET RADIOMETEREVAPORATION CONNECTIONS
RECORDERS SS APPROACH
CO NDI TlONS INSULATION
I IN. CRUSHED ROCK AWA SAND
FIGURE
1
FIGURE 2 'PPVo views of p e a t sample w i t h Net
Radiometer i n p o s i t i o n and Evaporation Gauge i n foreground.
E
\ 6 0 C IC wg
5 0f
=I
4 0 C m cf o 3 0 I- 0 2 0z
0F
l o ae
rn-
0 3 0 4 0 5 0 6 0 7 0 80 9 0 100 110a
UHEAT METER TEMPERATURE, O F
I
-
UNSATURATED-
- 0 0- 00-
-
-
0 -I
. - Y i v u F A c T u R E R-
CALIBRATION 1955-
-
1
1
I
1
I
I
I
A1
I
1
-
-
-
-8
8
--
-
----4---.---
CALIBRATION 1955-
-
I
I
I
0HEAT METER TEMPERATURE, OF
F I G U R E
3
CALIBRATION CURVES FOR B E C K M A N AND
W H I T L E Y H E A T M E T E R S
- 3 0 0 9 12 15 19 2 2 26 2 9 2 6 8 12 16 19 A U G U S T S E P T E M B E R E V A P O R A T I O N
(-1
H E A T O U T B O T T O M C O N V E C T I O NFIGURE 4
I
I
I
I
I
I
- --
B O W E N R A T I O-
--
- --
- - --
- II
-
FIGURE 5
COMPARISON OF MEASURED VALUES RI, Q,,
9
%I
*
WITH CALCULATED VALUES R2, Q c 2 *
Qe,
+ 2 0 0 h
I
I
I
1
I
I
I
1
1
+ I 0 0-
CONVECTION-
5l -100-
V)-
e
r
-200 Q - 3 0 0 a I<
0-
-
-
-
-100-
E V A P O R A T I O N-
E3
-200-
a
01 o - 3 0 0 .-
- 4 0 0-
-
-500-
-
- 6 0 0 - II
II
L 9 12 15 19 22 26 2 9 2 6 8 12 16 19 A U G U S T SEPTEMBERAPPENDIX A
CHECK CALIBRATION OF BEC,UIAN AND WHITLEY NET RADIOMETER U S I N G ALUMINLmI PPLATE TECHNIQUE
P r i n c i p l e
Heat i s l o s t o r gained from a p l a t e by .conduction, convection and n e t r a d i a t i o n . If t h e p l a t e i s placed on a n i n s u l a t e d base and exposed t o atmospheric c o n d i t i o n s , t h e amount of h e a t l o s t o r gained by conduction w i l l be small when compared t o t h e h e a t l o s s e s o r g a i n s by r a d i a t i o n and convection. Convective h e a t i s p r o p o r t i o n a l t o t h e d i f f e r e n c e between s u r f a c e temperature and a i r temperature. If t h e p l a t e
i s cooled s e v e r a l degrees below mean a i r temperature, placed on t h e i n s u l a t e d base and exposed t o atmospheric c o n d i t i o n s , t h e temperature of t h e p l a t e w i l l r i s e above mean a i r tempera- t u r e on a sunny day. During t h e f i r s t few minutes it w i l l be above t h e s u r f a c e temperature and t h e r e w i l l be convective h e a t g a i n ; when t h e s u r f a c e temperature exceeds mean a i r
temperature t h e r e w i l l be convective h e a t l o s s . When convective h e a t l o s s and convective h e a t g a i n balance, t h e n e t i n c r e a s e i n h e a t s t o r e d i n t h e p l a t e w i l l be due t o t h e n e t r a d i a t i o n .
If t h e i n c r e a s e i n temperature of t h e p l a t e , i t s
mass and s p e c i f i c h e a t a r e known, t h e h e a t absorbed by t h e p l a t e i n a given time can be c a l c u l a t e d . I f t h e p l a t e , d u r i n g t h i s given time i n t e r v a l , i s exposed t o a n e t radiometer and t h e output of t h e radiometer i s recorded, t h e n t h e r a t e of h e a t s t o r e d can be r e l a t e d t o t h e o u t p u t and a c a l i b r a t i o n f a c t o r obtained f o r t h e radiometer.
Apparatus
Requirements of t h e p l a t e a r e : s p e c i f i c h e a t ,
( 2 ) good conduction, s o t h a t temperature v a r i a t i o n s w i t h i n t h e p l a t e w i l l be a minimum,
( 3 ) s u r f a c e having uniform and reasonably l a r g e p r o p e r t i e s of a b s o r p t i o n ,
( 4 ) s u r f a c e l a r g e enough t o cover most of t h e a r e a "seen" by n e t radiometer,
( 5 )
mass ( o f p l a t e ) such t h a t under maximum atmospheric r a d i a t i o n t h e temperature r i s e would be q u i t e r a p i d ; f o r t h e p r e s e n t o b s e r v a t i o n s t h e maximum r a t e of temperature i n c r e a s e was about 10°C i n5
min.A c i r c u l a r aluminum p l a t e painted b l a c k on one s i d e was chosen. It was i n . t h i c k and 2 8 i n . i n diameter, and was l a i d h o r i z o n t a l l y on a block of i n s u l a t i n g m a t e r i a l .
A thermocouple was placed i n a hole d r i l l e d
1s
i n . i n t o t h e s i d e o f t h e p l a t e ; a n o t h e r thermocouple was f a s t e n e d t o t h e under s i d e of t h e p l a t e . Temperature was measured w i t h a potentiometer.Procedure
Two methods were used t o cool t h e p l a t e below a i r temperature: crushed i c e was placed on t o p o f t h e p l a t e and t h e s u r f a c e wiped d r y when it had cooled s u f f i c i e n t l y ; t h e p l a t e was exposed f o r a n i g h t under c l e a r sky c o n d i t i o n s and t h e temperature taken e a r l y i n t h e morning a t a time when t h e dew-point was s e v e r a l degrees belorrv mean a i r temperature ( i f t h e p l a t e cooled below t h e dew-point, moisture would condense on t h e s u r f a c e o f t h e p l a t e ) .
A period had t o be chosen when t h e output of t h e n e t radiometer was s t e a d y ( c l e a r sky c o n d i t i o n s ) , and was
reasonably h i g h ( a t l e a s t 5 mv). S u i t a b l e c a l i b r a t i o n p e r i o d s did n o t occur v e r y f r e q u e n t l y a t Ottawa d u r i n g August and
September 1960.
When a s u i t a b l e period was a v a i l a b l e , t h e f o l l o w i n g procedure was used. The p l a t e was cooled s e v e r a l degrees below a i r temperature and t h e n placed on t h e i n s u l a t e d s l a b below t h e n e t radiometer. The temperature of t h e p l a t e was measured f o r a c e r t a i n time i n t e r v a l . During t h i s same time i n t e r v a l t h e output of t h e n e t radiometer was measured.
Fibwre A - 1 g i v e s a sample c a l c u l a t i o n f o r one t e s t p e r i o d ,
-
chosen s o t h a t t h e shaded a r e a s were e q u a l , i . e . convective h e a t l o s s-
convective h e a t gain.Shortcomings of Technique
(1) I t r e q u i r e s i d e a l weather c o n d i t i o n s f o r c a l i b r a t i o n .
( 2 ) The c a l i b r a t i o n u s u a l l y cannot be checked a t s e v e r a l wind speeds; and t h e c a l i b r a t i o n f a c t o r may v a r y w i t h wind speed.
( 3 ) The s p e c i f i c h e a t o f p l a t e must be assumed equal t o standard.
( 4 )
The shadon e f f e c t of n e t radiometer i s n o t b o r n . ( 5 ) The a r e a "seen" by t h e radiometer i s l a r g e r t h a nt h e a r e a of t h e p l a t e .
6 The temperature measurements a r e c r i t i c a l .
( 7
) Non-unif orm p l a t e temperature d u r i n g t h e c a l i b r a t i o n could r e s u l t i n a change i n a i r s t a b i l i t y which would a f f e c t t h e c a l i b r a t i o n .Conclusion
On the b a s i s of experience so f a r , it appears t h a t t h i s method can be used t o check n e t radiometers under f i e l d conditions. Before r e a l confidence can be placed i n t h i s type of c a l i b r a t i o n however, it w i l l have t o be checked under a v a r i e t y of conditions with a radiometer of h o r n c a l i b r a t i o n .
TEMPERATURE
B
INSIDE DRILLEDBOTTOM OF PLATE
0906 09 11 0916 09 2 1 0 9 2 6 0 9 3 1
TIME OF EXPERIMENT, E.S.T.
PERIOD 0906.30 TO 0 9 1 7 * 3 0 1 1 MINUTES RISE IN TEMPERATURE = 21
-
13 = 8 OCH E A T ABSORBED BY P L A T E
= 8 ( 1 3 , 5 5 0 ) ( 0 . 2 1 4 ) MASS OF PLATE
=
13,550 GRAMS= 2 3 , 2 0 0 CALORIES SPECIFIC HEAT OF A L
= 0 . 2 1 4
CALS/GM AT 20°C
-
-
2 3 , 2 0 0 CALS/SQ CM/MIN EFFECTIVE AREA OF PLATE(11 X 3,670) =3,670 CM2
OUTPUT OF B t W CONSTANT DURING PERIOD
AT 5.5 MV
MANUFACTURER'S CALIBRATION = 10.3 MYCAL- CM-'-M IN- I
F I G U R E A - l
CALIBRATION OF HEAT METERS
Heat meters were placed on t h e bottom of two 4 - f t
diameter metal t a n k s . They were l o c a t e d i n t h e c e n t r e of t h e t a n k s and b a k e l i t e s h e e t i n g , of approximately t h e same t h i c k n e s s a s t h e h e a t m e t e r s , was placed around t h e h e a t
meters and glued t o t h e bottom i n s i d e f a c e of t h e t a n k s . A l l
j o i n t s i n t h e b a k e l i t e , connections t o t h e h e a t meter, and t h e h e a t meters themselves were covered w i t h wax. The t a n k s were t h e n placed i n h o l e s i n t h e ground s o t h a t t h e i r t o p s were l e v e l w i t h t h e surrounding s o i l s u r f a c e .
A s l a b of h a r d r u b b e r , 1 2 i n . square and 2 i n .
t h i c k was placed d i r e c t l y over t h e h e a t meter. Thermocouples were f i x e d t o t h e upper and lower f a c e s of t h e r u b b e r s l a b .
A small metal t a n k , 2 f t i n d i a m e t e r , 6 i n . deep and f i l l e d w i t h w a t e r , was placed on t o p of t h e r u b b e r pad. A 200-watt h e a t e r and a n e l e c t r i c s t i r r e r were placed i n t h e water.
The h e a t e r was turned on, t h e thermocouples and o u t p u t from t h e h e a t meter were connected t o a p p r o p r i a t e r e c o r d e r s , and t h e system l e f t u n t i l s t e a d y - s t a t e h e a t flow e x i s t e d , i , e . t h e t e m p e r a t u r e s a t t h e t o p and lower f a c e of t h e r u b b e r were c o n s t a n t f o r s e v e r a l hours. Then, knowing t h e thermal c o n d u c t i v i t y of t h e r u b b e r , it was p o s s i b l e t o c a l c u l a t e t h e h e a t f l o w through t h e r u b b e r which was assumed e q u a l t o t h e h e a t flow through t h e h e a t meter.
I n o r d e r t o check t h e c a l i b r a t i o n f a c t o r a t d i f f e r e n t t e m p e r a t u r e s , t h e h e a t e r was removed and s e v e r a l pounds of
crushed i c e were placed i n t h e water, The procedure was r e p e a t e d , i . e . t h e system was l e f t f o r s e v e r a l h o u r s u n t i l s t e a d y - s t a t e c o n d i t i o n s were obtained. Again, by e q u a t i n g t h e h e a t flow through t h e r u b b e r t o t h e h e a t flow through t h e meter, a c a l i b r a t i o n f o r t h e h e a t meter was obtained. Check on Heat Meter C a l i b r a t i o n
Both 4 - f t t a n k s , f i l l e d w i t h p e a t and s a t u r a t e d w i t h w a t e r , were exposed t o t h e same atmospheric c o n d i t i o n s . Thermocouples were embedded i n t h e p e a t a t d i f f e r e n t depths. The h e a t f l o w through t h e bottom of t h e t a n k was determined
f r o m t h e h e a t meter r e a d i n g s . If t h i s h e a t f l o w i s assumed e q u a l t o t h e h e a t flow through t h e bottom l a y e r of s a t u r a t e d p e a t , t h e thermal c o n d u c t i v i t y can be c a l c u l a t e d .
For t h e p e r i o d June 23 t o 26, t h e average v a l u e f o r t h e thermal c o n d u c t i v i t y of t h e bottom 5 - i n , l a y e r of s a t u r a t e d
n O m
p e a t was c a l c u l a t e d t o be 0.0011 cal/cmL - G s e c , compared t o
O C
- s e c f o r wet, marshy s o i l given by Geiger ( 2 ) . I t should
c m
b e noted t h a t t h i s value f o r t h e lower l a y e r s included about 1 i n . of sand and g r a v e l which might e x p l a i n why it i s lower t h a n those r e p o r t e d by Geiger. The sand and g r a v e l l a y e r had been added t o ensure f r e e h o r i z o n t a l drainage i n t h e lower l a y e r of t h e p e a t sample.
A d d i t i o n a l v a l u e s of thermal c o n d u c t i v i t y were c a l c u l a t e d f o r t h e period J u l y
1 5
t o 18 a f t e r t h e p o s i t i o n s of t h e thermocouples were changed s o t h a t t h e y were above t h e g r a v e l l a y e r . Values c a l c u l a t e d f o r t h e lower l a y e r of s a t u r a t e d p e a t were :Tank No. 1 = 0.0014 cal/cm2
2
s e c Bank No. 2 = 0.0019 cal/cmcm
O C s e cEstimate of Thermal Cond.uctivit.v f o r U ~ a e r Layer
An e s t i m a t e of t h e thermal c o n d u c t i v i t y f o r t h e upper l a y e r s was a l s o obtained by f i r s t c a l c u l a t i n g t h e thermal d i f f u s i v i t y . I f h e a t i s t r a n s f e r r e d i n t h e s o i l i n accordance w i t h t h e t h e o r y of conduction, it i s p o s s i b l e t o compute thermal d i f f u s i v i t y by comparing t h e temperature range a t two depths according t o t h e f o l l o w i n g formula:
( a 2
-
Kh
= H1) 2
P ( l o g e
-
R, )
where R1 and R2 a r e t h e d a i l y temperature amplitudes a t depths Z1 and
a2
r e s p e c t i v e l y ,P i s t h e period of t h e temperature o s c i l l a t i o n
5
= thermal d i f f u s i v i t y .From v a l u e s t h e thermal c o n d u c t i v i t y can be c a l c u l a t e d by assuming v a l u e s f o r d e n s i t y and s p e c i f i c h e a t of t h e p e a t sample. The v a l u e s of thermal c o n d u c t i v i t y c a l c u l a t e d f o r t h e period J u l y
1 5
t o 18 a r e a s f o l l o v ~ s :Tank No. 1, upper s a t u r a t e d l a y e r 0 t o 6 i n . 2 C O = 0.0011 cal/cm s e c Tank No. 2 , upper u n s a t u r a t e d l a y e r 0 t o 6 i n .
s e c = 0.0007 cal/cm
These values f o r K a r e i n reasonable agreement w i t h v a l u e s i n t h e l i t e r a t u r e .
Considerations f o r Future C a l i b r a t i o n
(1) I t was important t o have c o n s t a n t temperature c o n d i t i o n s during c a l i b r a t i o n . T r i a l s during t h e n i g h t ,
where t h e r e was s t e a d y c o o l i n g by long wave r a d i a t i o n , appeared t o be most s a t i s f a c t o r y .
(2) The m a t e r i a l surrounding t h e h e a t meter, i n t h i s case t h e b a k e l i t e , should be t h e same thiclcness a s t h e meter and have t h e same thermal c o n d u c t i v i t y s o t h a t h e a t flow through t h e bottom of t h e t a n k w i l l be uniform and v a l u e s obtained from t h e h e a t meter w i l l be a t r u e measure of t h i s flow.
Considerations f o r Measurement of Thermal Conductivi-bv
(1) Thermocouples should be f a s t e n e d r i g i d l y a f i x e d d i s t a n c e a p a r t ; those used i n t h i s experiment were n o t r i g i d enough and some s e t t l e m e n t may have occurred.
(2) The sample depth should be deeper s o t h a t t h e
un-
s a t u r a t e d depth can be g r e a t e r than 6 i n . The e f f e c t i v ethermal r e s i s t a n c e of t h e u n s a t u r a t e d moss was n o t a p p r e c i a b l y d i f f e r e n t from t h a t o f s a t u r a t e d moss, and it would be d e s i r a b l e t o have a g r e a t e r depth of u n s a t u r a t e d m a t e r i a l .
( 3 ) The most s a t i s f a c t o r y v a l u e s of thermal c o n d u c t i v i t y were obtained when t h e r e was maximum h e a t flow and, c o r r e s - pondingly, l a r g e s t temperature g r a d i e n t s .
( 4 ) Values obtained f o r thermal c o n d u c t i v i t y a r e r e p r e
-
s e n t a t i v e only; under f i e l d c o n d i t i o n s t h e v a r i a b i l i t y of t h e peat moss w i t h i n s h o r t d i s t a n c e s may be l a r g e .APPENDIX C
CHECK ON ACCURACY OF EVAPORATION M.EASURE3IENTS
For t h e period June 24 t o 30 t h e p e a t i n t h e two t a n k s was s a t u r a t e d and t h e evaporation measured. A s both t a n k s were exposed t o t h e same atmospheric c o n d i t i o n s , t h e evaporation r a t e should have been n e a r l y t h e same. The only d i f f e r e n c e between t h e two t a n k s was t h a t i n Tank No. 1 t h e
s u r f a c e of t h e peat was about 1/4 i n . from t h e r i m of t h e t a n k , whereas i n Tank No. 2 t h e s u r f a c e of t h e p e a t was about
3/4 i n . from t h e t a n k r i m .
The f ollovring r e c o r d s were obtained:
Date of
Observation Tank No. 1 Tank No. 2
( i n . of e v a p o r a t i o n ) ( i n . of e v a p o r a t i o n ) June 23 0.11 0.11
*
I t 24 t o 27 (0.47) n o t r e l i a b l e - r a i n 0.38 " 27 0.25 0.23 I' 28 0.30 0.37 " 29 0.10 0.10 " 30 0.08-
-
0.04 T o t a l 0.84 0.85 A f u r t h e r a n a l y s i s of t h e d a i l y evaporation r e c o r d s was made f o r t h e period J u l y 4 t o 29. Figure 6 shows acomparison of d a i l y evaporation; Tank No. 1 i s compared t o Tank No. 2, and Tanks No. 1 and No. 2 a r e compared w i t h a
standard Class A evaporation pan l o c a t e d w i t h i n 50 f t of t h e s i t e . Figure C - 1 i n d i c a t e s t h e s c a t t e r a s s o c i a t e d w i t h d a i l y observations.
3 June 24th observations n o t included i n t o t a l because it
was noted t h a t if t h e r e was more t h a n 0.25 i n . of r a i n , t h e water i n Tank No. 1 would overflow and t h e evaporation measurement would n o t be r e l i a b l e .
- 6 EVAPORATION, INCHES ( T A N K NO.
I )
.6 EVAPORATION, INCHES
( PEAT TANKS)