HAL Id: hal-00304706
https://hal.archives-ouvertes.fr/hal-00304706
Submitted on 1 Jan 2002HAL is a multi-disciplinary open access archive for the deposit and dissemination of sci-entific research documents, whether they are pub-lished or not. The documents may come from teaching and research institutions in France or abroad, or from public or private research centers.
L’archive ouverte pluridisciplinaire HAL, est destinée au dépôt et à la diffusion de documents scientifiques de niveau recherche, publiés ou non, émanant des établissements d’enseignement et de recherche français ou étrangers, des laboratoires publics ou privés.
reduction of nitrogen loads
N. J. Flynn, T. Paddison, P. G. Whitehead
To cite this version:
N. J. Flynn, T. Paddison, P. G. Whitehead. INCA Modelling of the Lee System: strategies for the reduction of nitrogen loads. Hydrology and Earth System Sciences Discussions, European Geosciences Union, 2002, 6 (3), pp.467-484. �hal-00304706�
INCA Modelling of the Lee System: strategies for the reduction of
nitrogen loads
N.J. Flynn, T. Paddison and P.G. Whitehead
Aquatic Environments Research Centre, Department of Geography, University of Reading, Reading, RG6 6AB, UK Email for corresponding author. [email protected]
Abstract
The Integrated Nitrogen Catchment model (INCA) was applied successfully to simulate nitrogen concentrations in the River Lee, a northern tributary of the River Thames for 1995-1999. Leaching from urban and agricultural areas was found to control nitrogen dynamics in reaches unaffected by effluent discharges and abstractions; the occurrence of minimal flows resulted in an upward trend in nitrate concentration. Sewage treatment works (STW) discharging into the River Lee raised nitrate concentrations substantially, a problem which was compounded by abstractions in the Lower Lee. The average concentration of nitrate (NO3) for the simulation period 1995-96 was 7.87 mg N l-1. Ammonium
(NH4) concentrations were simulated less successfully. However, concentrations of ammonium rarely rose to levels which would be of environmental concern. Scenarios were run through INCA to assess strategies for the reduction of nitrate concentrations in the catchment. The conversion of arable land to ungrazed vegetation or to woodland would reduce nitrate concentrations substantially, whilst inclusion of riparian buffer strips would be unsuccessful in reducing nitrate loading. A 50% reduction in nitrate loading from Luton STW would result in a fall of up to 5 mg N l-1 in the reach directly affected (concentrations fell from maxima of 13 to 8 mg N l-1, nearly a 40 % reduction), whilst
a 20% reduction in abstractions would reduce maximum peaks in concentration in the lower Lee by up to 4 mg l-1 (from 17 to 13 mg N l-1,
nearly a 25 % reduction),.
Keywords: modelling, water quality, nitrogen, nitrate, ammonium, INCA, River Lee, River Thames, land-use.
Introduction
Rising concentrations of nitrogen (N) in UK aquatic environments is due primarily to human activities from three major inputs, namely atmospheric pollution, urban pollution and agricultural sources. In terms of atmospheric pollution, the average deposition of N in the UK is approximately 17 kg ha–1yr–1. Regional differences in the spatial distribution
of N deposition in the UK are clear and generally upland areas with high rainfall are associated with the highest deposition of N (NEGTAP, 2001). However, N deposition in parts of south-east England has been estimated to be as much as 30 kg ha–1yr–1 and, if the average runoff in this part
of the country is 300 mm yr–1 and nitrogen inputs from the
atmosphere are balanced by leaching, drainage waters may have a resultant nitrate-N concentration of 10 mg N l–1 due
to atmospheric inputs alone. Clearly, atmospheric inputs of nitrogen are significant, and this mobility implies that the problem is regional. Skeffington (2002) reviews N control strategies for atmospheric pollution in some detail.
Urban areas are associated with effluent discharges from industry and sewage treatment works (STWs), and are categorised as point source pollution. Of the 70 000 consented discharges into UK freshwaters, upwards of 80% are for STWs (EA, 2001c). Sewage is high in N content, and, untreated, can contain approximately 50 mg N l–1.
However, with secondary treatment this may be reduced to approximately 20 mg N l–1. Consented effluent discharges
from industry are generally low in N content (Heathwaite, 1993). Although urban areas are associated mostly with point source pollution, they may also contribute N in diffuse pollution through surface runoff, the quantity of which varies according to the annual precipitation and the proportion of impermeable surfaces in the urban catchment (Heathwaite, 1993).
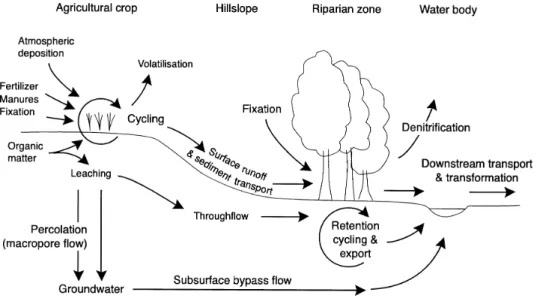
Agricultural land is the major source of diffuse N loading into freshwater systems (Whitehead, 1990) (Fig. 1). Diffuse pollution has become a major issue only in the last 50–60 years due to intensification of agricultural practices. The
second half of the twentieth century saw heavy subsidies for farming and the extensive use of inorganic fertilisers which, while vastly increasing food production, put an unsustainable strain on the environment (Johnes et al., 1996). For economic reasons, it is often the case that the best farming practices (in environmental terms) are not used. In addition to the increased use of fertilisers for crop production, artificial feeds allowed large increases in livestock numbers. Numbers of sheep and poultry doubled and pig numbers trebled during 1950–1980 (Heathwaite, 1993) which has increased the quantity of urea and manure deposited and thus N loads on the land. Some significant agricultural point sources also exist, such as manure and silage heaps and intensive animal rearing units.
In a pristine river, the average concentration of nitrogen (N) will be minimal (nitrate ~0.1 mg N l–1; ammonium
~0.015 mg N l–1). However, Global Environmental
Monitoring System’s (GEMS) stations show that European rivers have been polluted to such an extent that a nitrate concentration of 4.5 mg N l–1 is the norm, while 10% of
rivers lie within a range of 9–25 mg N l–1. This compares
unfavourably with the maximum acceptable concentration (MAC) of 11.3 mg nitrate-N l–1 allowed for water
abstractions by the European Community (Heathwaite et
al., 1993). Furthermore, although N is essential for plant
growth, additions of N into aquatic systems can create significant environmental problems.
The modelling of N in freshwater systems and their catchments is particularly worthwhile in catchments where problems exist or may arise. Of the many models designed to simulate various aspects of N dynamics in the environment, few meet a need to track N inputs through the
catchment to the river or to address the spatial heterogeneity of the catchment (Whitehead et al., 1998; Wade et al., 2002). The development of INCA – Integrated Nitrogen Catchment model, has gone some way to satisfying such a need, and has been applied here to the River Lee, a northern tributary of the River Thames.
The River Lee supplies one sixth of London’s drinking water requirements, and provides a treasured recreational resource for the capital in the form of the Lee Valley Regional Park. The River Lee safeguards important aquatic habitats, including several Sites of Special Scientific Interest (SSSI) (Reid, 1995; EA, 2001a, b), but has a history of poor water quality. Local Environment Agency Plans (LEAP) for both the Upper and Lower Lee express concern over N loading (the River Lee was designated as a Eutrophic Sensitive Area in 1998). Diffuse pollutions from both urban runoff and agricultural land are identified as significant sources, while effluent discharges from STWs at times of low flow in summer are also a problem (EA, 2001a, b).
In this paper, the INCA model has been used to examine the N dynamics in the River Lee to improve understanding of the sources of N in the Lee catchment, and of the spatial and temporal variations in nitrate and ammonium along its length. In addition, INCA has investigated strategies of land use and management practices for managing N in this catchment.
The River Lee catchment
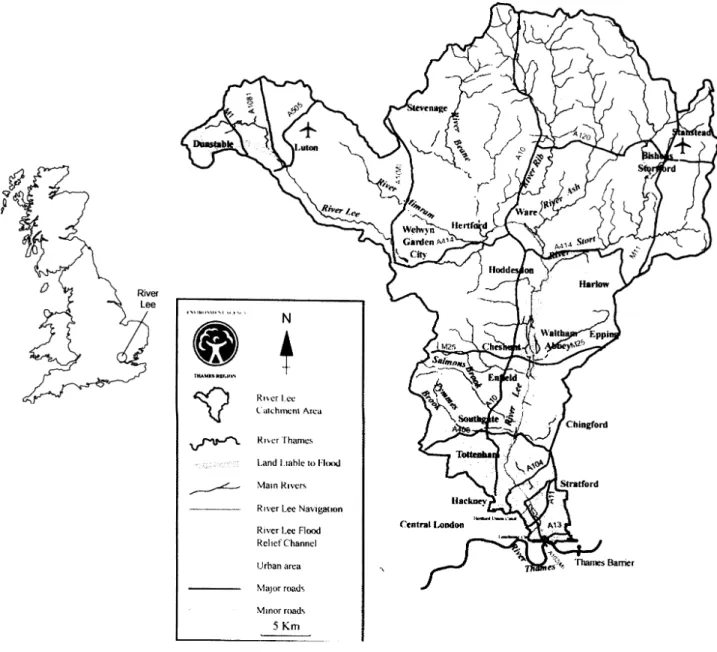
The River Lee, 85.2 km from its source in Luton to its confluence with the Thames in London, drains a catchment area of 1420 km2 (Fig. 2) (EA, 1997), has been used as a
Fig. 2. River Lee atachment area (source Environment Agency, 1997)
navigable river for over 900 years and has undergone many engineering works in that time (RUST, 1995). The Lower Lee is now a complicated system which consists of the Lee Navigation, a Flood Relief Channel, several small tributaries, wetlands and reservoirs. Underlying the Cretaceous catchment area is a Chalk aquifer which outcrops in the Chiltern Hills in the north-western extremity of the catchment. The Chalk in the south of the catchment is overlain by Tertiary sands and London clay and is up to 70 m deep in places; it has been a significant source of London’s water supply for many centuries (Flavin and Joseph, 1983; Halcrow Water, 1995; O’Shea and Sage, 1999).
Industrial and residential developments along the River Lee’s course are abundant, and over 2 million people live in the catchment area (EA, 1997, 2001b). Those areas of the catchment that are not urbanised are generally utilised for intensive agriculture. Consequently, the River Lee suffers pollution from both point sources (i.e. effluent discharges), and diffuse sources (i.e. agricultural land and urban runoff) (Halcrow Water, 1999; EA, 2001a, b). The sizeable populace and the catchment’s proximity to London means that the River Lee is a valuable water resource; however, demand can be such that water abstraction from surface and groundwater sources can cause variable flows resulting in additional environmental problems (EA, 2001a). Sections
of the River Lee are valuable conservation areas, with several sites having the status of Site of Special Scientific Interest (SSSI).
The INCA model
Modelling N in the environment is essential to assess how changes in atmospheric deposition, land use, land management and climate will affect N dynamics. Many models consider various aspects of N in the environment. Physically based models such as QUASAR (Whitehead et
al., 1997; Whitehead and Williams, 1984) represent
physical, chemical and biological transformations of N and are generally applied to river systems. On the other hand, empirical models (e.g. export coefficient model; Johnes, 1996) use statistical correspondence or simple coefficients to simulate N loading into aquatic systems. However, while the empirical approaches may be successful in estimating annual and seasonal N loads, they are not process-based and are therefore unable to predict daily variations in river N concentrations.
INCA, a processed based model, integrates catchment and river processes by tracking N inputs through the catchment soils to the river; it is semi-distributed and, thus, takes some account of spatial variations in land use, vegetation and hydrology. INCA is also dynamic and so allows daily variations in flow, N fluxes and N concentrations to be examined (Whitehead et al., 1998; Collins et al., 1999; Wade
et al., 2002).
The INCA model incorporates several different model components to simulate the N dynamics of catchment and river:
z Nitrogen Input Model: Calculates the total N inputs from all sources (e.g. atmosphere and fertilisers) to each sub-catchment; these are then scaled according to the land use. The separation of N forms and sources allows the effects of changing inputs to be assessed.
z Hydrological Model:
uses hydrologically effective rainfall (HER) to drive the water transfers and N fluxes through the catchment system;
simulates the effect of changes in land use on flow using a simple two box reservoir approach - the reactive soil zone and groundwater zone (see page 303);
calculates the mass balance of flow through multiple reaches by which the river system is divided.
z Catchment Nitrogen Process Model: Simulates the transformations of N in soil and groundwater by
modelling plant uptake, nitrification, denitrification, mineralisation and immobilisation in sub-catchments using parameter sets which are derived for each land class. This part of the model is driven by the output from the Nitrogen Input Model.
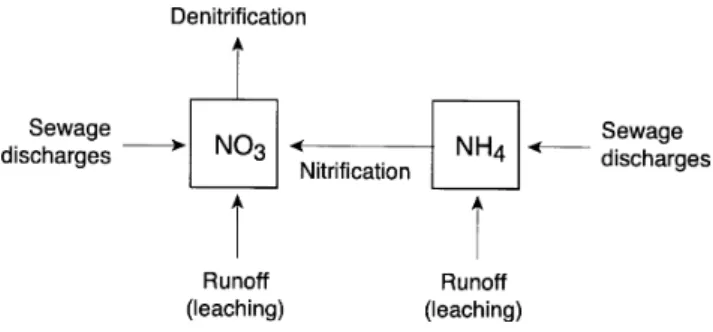
z River Nitrogen Process Model: Simulates dilution, in-river transformations, and losses such as nitrification and denitrification of the ammonium-N and nitrate-N inputs derived from the Catchment Nitrogen Process Model, as well as sewage effluent discharges (Fig. 3). A more detailed explanation of the model components and the equations used to drive the simulation can be found in Whitehead et al. (1998) and Wade et al. (2002).
Application of INCA to the River Lee
system
REACH STRUCTURE AND LAND CLASS PERCENTAGES
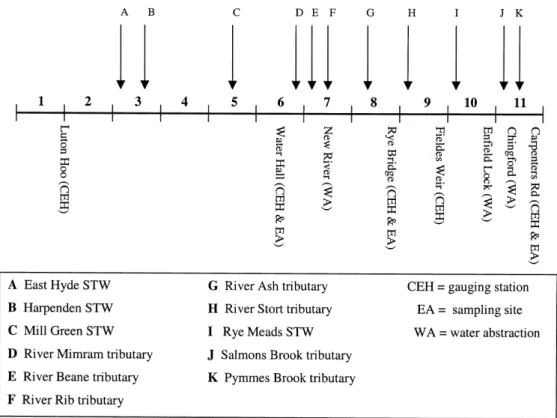
The River Lee was divided into 11 reaches chosen on the basis of factors such as the location of water quality sampling sites, discharge gauging stations, effluent inputs, confluence points and changes in land use. A schematic diagram of the reach boundary structure is shown in Fig. 4. Only those Environment Agency (EA) sites that sample for both ammonium and nitrate have been included; several others exist which sample only for ammonium. The lowest catchment boundary is approximately 8 km short of the confluence with the River Thames; beyond this point, the River Lee is tidal and so beyond the scope of modelling accurately with INCA. Each reach drains a sub-catchment, delimited by the Centre of Ecology and Hydrology using algorithms of Digital Terrain Mapping (DTM).
The proportion of land use in each catchment is derived using Geographical Information Systems (GIS) from the Fig. 3. Instream inputs and processes incorporated within INCA
ITE Land Cover Map of Great Britain. INCA uses six land classes which have been derived from a simplification of the original 18 land classes for the ITE land cover map. These are forest, short vegetation fertilised and grazed (SVgFG), short vegetation grazed but not fertilised (SVgGNF), short vegetation fertilised (SVgF), arable and urban. Table 1 shows the length of each reach and the corresponding area of the sub-catchment with land use proportions. The sub-catchments at the beginning and end of the River Lee are clearly dominated by urbanisation; however, arable and SVgGNF land classes are more prevalent elsewhere in the catchment.
NITROGEN DEPOSITION, RIVER DATA, BASE FLOW INDEX AND TIME SERIES DATA
Atmospheric deposition of wet and dry nitrate and ammonium is derived from the MATADOR-N model. GIS is then used to calculate the amount of deposition in each sub-catchment (Table 2). Dry nitrate deposition accounts for the greatest quantity of total N deposition in the River Lee catchment area.
INCA requires a and b parameters determined from the velocity–flow relationship (V = aQb). To estimate the
residence time within each reach (Wade et al., 2001). The
relationship may be determined from tracer experiments on tables of velocity – flow information available from the EA. The velocity-flow relationship used for the entire river system was V = 0.06 Q 0.64. INCA can include effluent
discharges and water abstractions within each reach. Data pertaining to STW effluent discharges, obtained from the EA, are shown in Table 3. Surface water abstractions from the Lee are over 200 million m3 yr–1 (approx. 6.3 m3 s–1).
They include abstractions near Ware to supply the New River, and abstractions from Enfield and Chingford for public water supply.
The base flow index (BFI) governs the transfer of water from the soil reactive zone to the groundwater zone (Whitehead et al., 1998). BFI data for the River Lee were obtained from the Institute of Hydrology Register and Statistics Yearbook (1991-95) for each gauging station (Table 4).
The time series data of hydrologically effective rainfall (HER), actual precipitation, soil moisture deficit (SMD) and temperature are used to drive the water transfers and N fluxes through the catchment system and provide essential information for the modelling of N transformations. The data were obtained from ADAS and use the MORECS soil moisture and evaporation accounting model to convert actual precipitation into HER and produce a daily time series of Fig. 4. Schematic diagram of the River Lee boundary structure. CEH – Centre for Ecology and Hydrology; EA – Environment Agency.
SMD. However, MORECS has a tendency to over-estimate SMD and consequently under-estimate HER, which can create generalised flows in which many significant peaks in flow are not simulated (Limbrick et al., 2000; Limbrick, 2002). These peaks in flow have a dilution effect which alters the N concentrations in the simulation. This was found with the data produced for the River Lee catchment, as HER for the years 1996–97 was exceptionally low. However, other means of determining a HER time series are available whereby the ratio between average annual runoff in the catchment and actual yearly precipitation is multiplied by the actual precipitation to calculate an approximation to HER. One of the drawbacks of this method is that seasonal variations in evapotranspiration are not taken into account, possibly resulting in over-estimations of HER in summer and under-estimations in winter. Initial observations also showed that simulated flows between peaks in the hydrograph were significantly above those actually observed. Consequently although MORECS HER data were used, values of HER produced by the ratio method were included where significant peaks in flow were missed.
Model calibration and validation
Process based models such as INCA need to be calibrated against observations if they are to be used as scientific and management tools. This was undertaken in a ‘trial and error’ fitting procedure whereby the various parameters in the model have to be adjusted within viable limits until the best possible simulation was produced (Wade and Whitehead, 2001). For the Lee catchment, the INCA model was calibrated against daily discharge data from EA gauging stations and against nitrate and ammonium concentration
Table 3. Effluent discharges into the River Lee
Name Reach no. Discharge Discharge
m3 day-1 m3 s-1
Luton (East Hyde) 3 130,000 1.50
STW
Harpenden STW 3 24,000 0.28
Mill Green STW 5 12,000 0.14
Rye Meads STW 9 330,000 3.80
Table 2. Wet and dry deposition rates of nitrate and
ammonium (kg N ha–1 y–1)
Reach no. NO3 dry NO3 wet NH4 dry NH4 wet
1 11.4 2.58 1.46 4.43 2 10.6 2.75 1.39 4.60 3 9.49 2.88 1.04 4.71 4 10.8 2.62 0.79 4.51 5 15.0 2.42 1.07 4.35 6 10.2 2.52 0.76 4.42 7 9.08 2.33 0.60 4.36 8 9.87 2.49 0.53 4.03 9 10.3 2.51 0.61 3.90 10 13.9 2.42 1.01 4.22 11 23.6 2.33 1.67 4.42
Table 1. Reach, length, sub-catchment area and land class percentage
Reach no. Reach Length Sub-catchment Forest SVgFG SVgGNF SVgF Arable Urban
(m) Area (km2) (%) (%) (%) (%) (%) (%) 1 8000 61 0 0 2 3 30 66 2 3500 12 8 0 25 0 33 33 3 6750 14 0 0 29 0 57 14 4 6000 18 6 0 22 0 67 6 5 5000 21 14 0 29 0 29 29 6 10250 192 5 0 23 0 65 8 7 3500 329 1 0 9 0 82 8 8 6750 109 0 0 8 0 87 5 9 1000 284 1 0 9 0 81 8 10 16500 176 13 0 35 1 34 18 11 13500 173 5 0 8 1 2 85
data from the routine water quality monitoring programme of the EA. Two years’ continuous data (1995–96) were used to give a clearer picture of the trends of N concentrations.
Although ammonium concentrations were recorded in the majority of reaches, nitrate data were restricted to reaches in the lower half of the Lee.
In the lower reaches of the Lee, difficulties were incurred in simulating the volume of flow. At times, simulated flow was higher than that observed, perhaps because of water abstractions. Initially, abstractions were based on the mean abstraction calculated from the consented annual abstractions. However, zero flow was obtained at one point during the simulation; therefore the abstraction rate was reduced so that flow was always maintained in the simulation. Furthermore, the abstraction rate may rise above the mean during peak flows so that not enough water is removed at times of substantial peak flows. However, the rising and falling limbs were matched closely to observed flows. Land and river phase process parameters were calibrated successfully for the simulation of nitrate
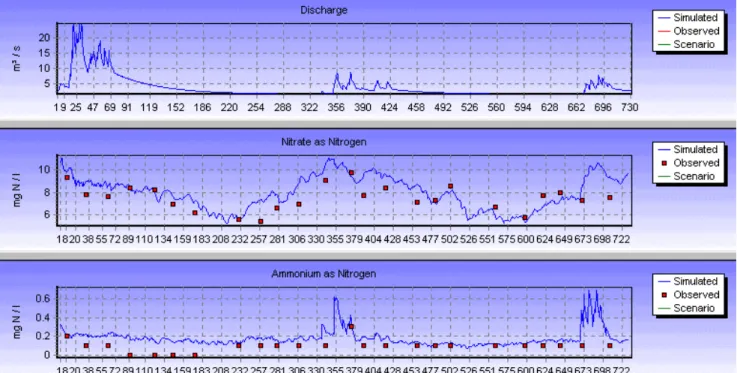
concentrations. The initial conditions and the upward and downward trends in nitrate concentrations were simulated and fell within the absolute limits of the field data (Fig. 5). Ammonium concentrations were simulated less successfully but generally remained within the absolute limits of the observations.
To ensure the success of the simulation in representing the modelled river, its reliability must be examined against its ability to simulate water quality from data for a time period different from that used in the calibration procedure (i.e. validation). The same process parameters were used in conjunction with time series data from 1998–99, and compared for reliability against observations for those years. Although the fit was not quite so good, the changes in concentration dynamics still followed the trends of the field data. Discrepancies occurred within the flow simulation (whereby too much flow was generally simulated) and these are probably related to changes in abstraction rates, or result from the MORECS calculation of HER.
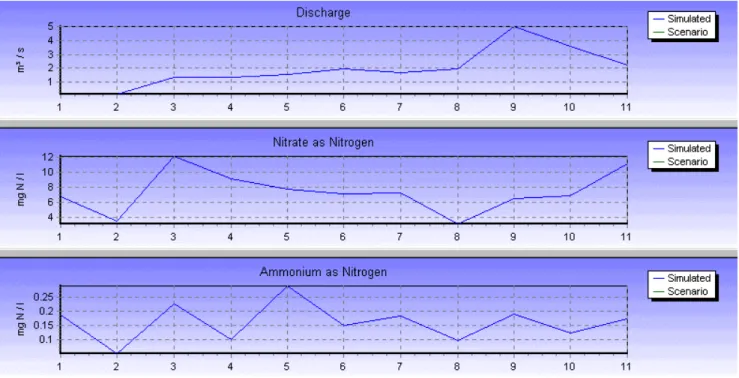
SPATIAL VARIATIONS ALONG THE RIVER LEE The changing concentrations in nitrate and ammonium along the River Lee are shown in Fig. 6. Although this represents just one day in the simulation period, no significant variations in this pattern occur over the two-year period. A summary of nitrate concentrations produced in each reach is provided in Table 5.
Table 4. Base Flow Index (BFI) for the River Lee
Gauging Station (no.) Reach no. BFI
Luton Hoo (38013) 1 0.62
Water Hall (38018) 6 0.81
Rye Bridge (38031) 8
-Fieldes Weir (38001) 9 0.57
Lee Bridge (38032) 11 0.46
Table 5. A reach summary of nitrate concentrations
(mg N l–1) in the River Lee
Reach no. Mean Max. Min. Range
1 7.40 10.6 5.04 5.55 2 4.87 9.26 2.30 6.96 3 12.1 13.9 10.0 3.87 4 9.58 11.8 7.03 4.75 5 8.46 10.7 5.79 4.91 6 7.78 9.73 5.63 4.10 7 7.97 11.1 5.22 5.84 8 4.40 8.76 1.60 7.16 9 6.98 9.41 5.11 4.30 10 7.05 10.8 4.79 5.98 11 9.99 16.8 7.50 9.31
Fig. 6. Changes in discharge, and concentrations of nitrate-N and ammonium-N along the length of the River Lee (Day 257)
Urbanisation clearly affects the nitrate concentrations in the Lee. Reach 1 and reach 11 demonstrate higher concentrations of nitrate-N than adjacent reaches (Fig. 6). Nitrate concentrations in reach 1 are, on average, 2.5 mg N l–1 greater than those simulated in reach 2; similarly, in
reach 11, nitrate concentrations are 3 mg N l–1 higher than
those in reach 10 (Table 5); these differences are attributable to the urbanisation of the relevant sub-catchments (Table 1). The source of the Lee is in Luton and the first reach is entirely
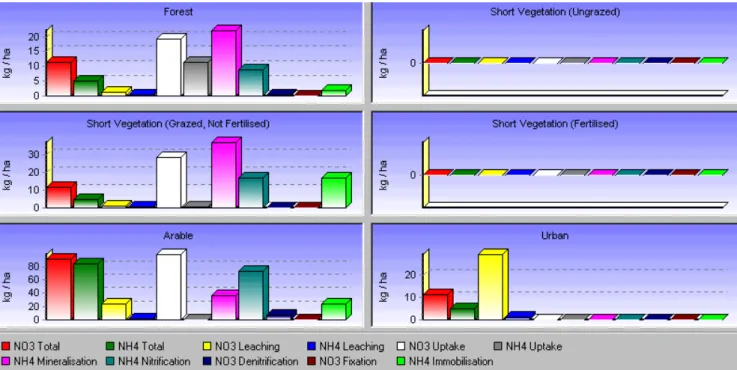
confined within metropolitan Luton, while the whole of reach 11 runs through North London boroughs towards the confluence with the River Thames. INCA modelling of the typical annual nitrogen loads by land class in the River Lee catchment area show the urban land class to have the highest nitrate-N leaching of any other land class (approximately 29 kg ha–1 yr–1: Fig. 7). Modelling also indicates that no
denitrification of nitrate takes place in urban areas as it moves from the land phase to the river (Fig. 7); the loading of nitrate to these reaches is proportionally much greater than that in other reaches, to the detriment of the water quality. In reach 11, water abstractions may be a contributing factor.
The highest mean concentration of nitrate is found in reach 3 (12.1 mg N l–1), substantially higher than in reach
2. This is clearly attributable to effluent discharges from the STWs at Luton and Harpenden. Luton (East Hyde) STW is a particularly large operation dealing with most of the domestic waste from Luton. The STW at Rye Meads discharges a large flow into reach 9, so that nitrate concentrations rise between reach 8 and reach 9. However, the greater volume of water in the Lee at this point ensures that the effect on water quality is less marked than further upstream. Ammonium concentrations follow a similar pattern, although the Hatfield STW, which discharges effluent into reach 5, increases ammonium but not nitrate concentrations.
Water abstractions reduce the dilution of pollutants. This was apparent from the difference between the simulated concentrations of reach 7 and reach 8, where a sudden decrease in nitrate was inconsistent with the rate at which concentrations had been declining previously. This is most probably due to the abstraction from reach 7 to the New River (to supply London) as there are no significant differences in land use between the two sub-catchments. A similar effect occurs in reach 10 and reach 11, when substantial abstractions reduce river discharge and so amplify nitrate concentrations Ammonium concentrations are less susceptible to this effect and any rise in concentration is minimal.
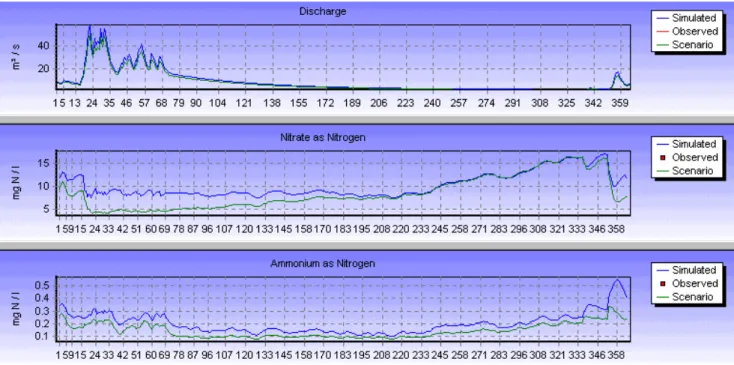
Figure 8 displays the simulation generated for reach 2, and is a typical representation of the temporal pattern formed by changing N concentrations along the Lee in the absence of effluent discharges. The low flow conditions at the start of the simulation time period are characterised by some of the highest concentrations of the simulated period. In all reaches, concentrations of nitrate were initially > 8 mg N l–1. The concentrations of nitrate remain high and fall
and rise to mirror the flow pattern. This is because HER results in the flux of water through the catchment soils which ultimately affects river discharge, whilst N in catchment soils is transported to the river concurrently. Thus, the pattern of nitrate leaching matches the pattern of flow throughout the simulation. When HER ceases, the gradual decline in discharge and leaching results in a fall in nitrate
concentrations as denitrification removes it from the system. Minimum concentrations in all reaches occur around day 211. The nitrate concentrations then increase again although there is no increase in discharge and leaching to mirror the change. This is attributed to the large reduction in the water volume in the Lee resulting in minimal dilution of nitrate. The next HER event then coincides with a rapid increase in nitrate concentration as hydrological responses cause increased leaching and discharge. Thus, as noted previously, the concentration of nitrate begins to mirror the changes in flow. A peak in concentration on day 356 of the simulation matches the magnitude of the peak earlier in the year. A similar pattern is established through 1996 as concentrations fall through the year before rising when drought conditions result in minimal flows, and then increase rapidly with autumnal and winter HER.
The simulation of the ammonium concentrations follows the same hydrological responses. However, higher rates of nitrification in both land and river phases result in more rapid reductions of ammonium. Hence, concentrations are more consistent between peaks and low flows do not result in rising ammonium concentrations (Fig. 8).
N dynamics were affected in those reaches where significant discharges of sewage effluent occur. In reach 3, where large effluent discharges from Luton (East Hyde) STW and from Harpenden STW enter the river, the concentration of nitrate is considerably higher than that in most other reaches as the discharge from the STWs accounts Fig. 7. Typical annual nitrogen loads by land class in the River Lee catchment area
for a significant proportion of river flow. However, the nitrate concentration falls rapidly when flow in the river increases, which contrasts with other reaches. The water entering the reach from upstream, and the water draining into the reach from the sub-catchment, have a significantly lower nitrate concentration; this dilutes the effluent discharge at peak flows. Similarly, concentrations rapidly fall at the peaks in river discharge in the latter parts of 1995 and 1996. A similar effect is observed in reach 9 due to the discharge of the Rye Meads STW, however, the impact is less dramatic since a larger proportion of river flow is derived naturally. The temporal dynamics in nitrate concentrations of reach 11 are affected by the large abstractions from this and the preceding reach. The minimal flows in this reach result in the highest nitrate concentration simulated in the Lee (17 mg N l–1). Hence, as in reaches affected by sewage
effluent, an increase in river discharge results in a sudden fall in nitrate concentrations. The concentration of nitrate is then maintained until the river flow reaches critical conditions again. However, this increase appears to have been over-stated, probably due to the observed flow conditions being slightly higher than simulated.
OVERALL WATER QUALITY OF THE RIVER LEE The water quality of the River Lee is assessed here in terms
of the water abstraction MAC for nitrate. The majority of reaches in the Lee have a range of nitrate concentration between 6–10 mg N l–1 and rarely transgress the 11.3 mg
N l–1 limit. Although this may be adequate in economic
terms, in terms of the environment, these concentrations are suggestive of the problems of eutrophication that have been reported in the Local Environment Agency Plans for the River Lee catchment area (EA, 2001a, b). Using a crude estimate of the average concentration of nitrate from the mean concentration for each reach provides a figure of 7.87 mg N l–1 which suggests that the water quality in the
River Lee is worse than the European average, and is in the lowest 10%. Two particular reaches of the Lee appear to break the MAC limit consistently. For most of 1995–96 the River Lee in reach 3 has nitrate concentrations which surpass the MAC (71%) as a result of effluent discharges. In reach 11, the situation is less severe so that concentrations surpass the MAC limit in only 18% of the simulations.
Controlling nitrogen loading to river
systems
Several schemes exist in the UK whereby nitrogen loading to river systems, particularly from agricultural land, is reduced through voluntary implementation of various Fig. 8. Temporal nitrogen dynamics in the River Lee (reach 2: 1995–96)
governmental or European schemes. Agricultural land is the single main contributor of diffuse N pollution due to its highly intensive nature. The late 1980s and early 1990s began to see a policy change from intensification and surplus production (Burt and Haycock, 1993) where the Ministry for Agriculture and Fisheries (MAFF) compensated farmers who adopted practices which could result in a loss of income, but were beneficial to the environment. These schemes reduced fertiliser applications and took land out of crop production.
Set-aside was designed as a voluntary scheme to reduce the surplus in arable crops, whereby farmers are compensated for taking at least 20% of their arable land out of production. In addition, the Nitrate Sensitive Areas (NSA) scheme was introduced by MAFF in 1989 for those areas where water resources were in danger of exceeding the MAC of 11.3 mg N l–1. Basic and premium rate payment schemes
were introduced, the rate of payment linked to the extent of the measures taken. Measures under the basic rate involve reducing fertiliser applications below the economic optimum; planting winter crops earlier in the autumn; limiting application rates of organic manure; and controlling the time of fertiliser application. Assessment of some aspects of the NSA and similar management schemes have been carried out in model simulations (Johnes, 1996: export coefficient model, and Wade et al., 2001: the INCA model). The use of riparian buffer strips to reduce nitrogen loading to river systems has also been investigated, the precept behind these being that their natural location allows them to regulate the movement of materials in surface runoff and groundwater flowing between terrestrial and aquatic systems, while their function enables nutrient fluxes (including N) to be retained and/or transformed particularly by denitrification and plant uptake. However, the experimentation and implementation of riparian buffer strips has met with mixed results. Riparian buffer strips can be highly efficient in their removal of nitrate, particularly from subsurface flow, but site selection and management needs careful consideration. Agricultural drainage mechanisms can reduce the effectiveness of buffer strips by either bypassing them or by lowering the groundwater table, so removing waterlogged areas near to streams (Haycock and Burt, 1993; Vought et al., 1994; Woltermade, 2000). Thus, it is vital that natural drainage mechanisms predominate, and agricultural drainage water may be required to be re-routed. It is also suggested that buffer strips are usually best employed on smaller streams because 60–70% of water reaching large streams enters via streams of order 1–-3 (Vought et al., 1994).
In addition to agricultural land, urban and atmospheric sources of N can also be substantial. Effluent discharges
from STWs can make up significant amounts of flow in rivers, especially during times of drought. The processing of sewage treatment in UK works has undergone extensive investment since the privatisation of the UK water industry; as a result, ammonium concentrations have decreased dramatically. However, few STWs in the UK have facilities for the tertiary treatment of sewage to enable the removal of large quantities of nitrate from sewage effluent.
A reduction in atmospheric emissions relating to nitrogen compounds could be beneficial for aquatic systems. Johnes (1996) simulated the impact of reducing the nitrogen loading from atmospheric sources by 20% using the export coefficient model on three separate catchments. The reduction had limited success, although a fall of approximately 6% in N loading was found in the River Esk catchment in Cumbria. It is likely that reducing emissions of nitrogen compounds into the atmosphere would be more beneficial to upland areas sensitive to acidification than to lowland areas, which are more susceptible to eutrophication.
Scenario analysis
One of the valuable functions of INCA is its ability to be used as a management tool, allowing an analysis of strategies which might be adopted to improve water quality. Scenarios to reduce nitrate concentrations in the River Lee were simulated through INCA from 1995. Scenario 1 was the 100% implementation of a NSA premium pay rate scheme across the catchment; it converts all arable land to unfertilised and ungrazed vegetation. Scenario 2 takes a more realistic approach and converts 20% of arable land to forestry.
The LEAP for the Upper Lee suggests that the implementation of riparian buffer strips along the main tributaries of the River Lee could be beneficial to water quality (EA, 2001a). Furthermore, an ‘environmental assessment’ of the Lower Lee advises that the construction of a wetland treatment system in the derelict Tottenham Marshes could be used to intercept storm flows from the Pymmes Brook catchment (Rust Environmental, 1995). Scenario 3 attempted to simulate this management strategy. However, INCA is semi-distributed, and consequently the precept of riparian buffer strips cannot strictly be simulated. A method was therefore established to provide an average of the removal/retention of nitrate over the catchment. Rates of denitrification and plant uptake in riparian buffer strips (the principle mechanisms of nitrate removal) were established from the literature. A ratio describing the area of the riparian buffer strips to the area of the Lee catchment (1:50) was used to calculate the average loss of nitrate per hectare. The parameters defining rates of denitrification and
plant uptake were then adjusted to account for this additional loss.
Effluent discharges from STWs can add substantial N pollution to rivers. Luton (East Hyde) STW and Rye Meads STW produce large discharges which are relatively high in nitrate content, thus affecting water quality in the Lee (see Table 3). Scenario 4 reduces the nitrate concentration of sewage effluent from these two STWs by 50%. Water abstractions have also been identified as altering N dynamics in the Lee and scenario 5 examined the effect of reducing abstraction licensing conditions by 20%.
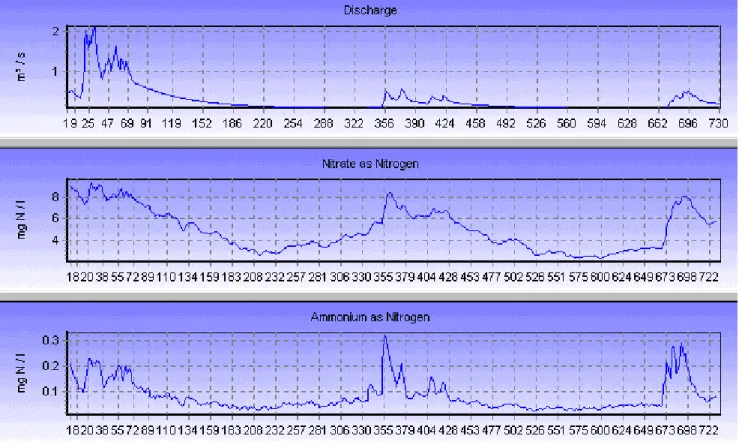
The simulation of scenario 1 demonstrated the extent to which agricultural land is a controlling factor on water quality. Substantial reductions of nitrate were observed in reaches 3 and 11 during peak flows (2 mg N l–1 and 4 mg
N l–1 respectively). However, as flow decreased after winter
rainfall, the difference was reduced until, at minimal flows, the original simulation and scenario are indistinguishable. This is further evidence that during low flows the effluent discharge into reach 3, and the abstractions from reach 10 and reach 11 are major contributors to water pollution in those parts of the river. The greatest improvements were attained in the reaches whose associated sub-catchments were predominately arable. Reach 7 attained the greatest drop in nitrate-N concentration of 7 mg l–1 at peak flows,
whilst even during the minimal flow of summer and autumn the nitrate-N concentrations were improved by 3 mg l–1
(Fig. 9). This is further demonstrated by longitudinal profiles of the Lee (Fig. 10). The profile of the Lee on day 30 (peak
flow) displays a substantial reduction in nitrate in all reaches but, by day 270 (low flow) of the simulation, significant improvements are found only between reach 6 and reach 9, and these have largely agricultural sub-catchments (65–87% arable land use).
The simulation of scenario 2, in which only a limited amount of arable land is converted, met with limited success. In reach 3, minimal reductions were observed, even at maximum flows. However, in reach 7, a reduction in nitrate of between 1–2 mg N l–-1 occurred throughout the
simulation. Figure 11 demonstrates that this improvement in water quality starts at reach 6 and is maintained along the rest of the Lee at peak flow. However, these improvements are negligible in most reaches when flow is reduced.
The simulation of riparian buffer strips in scenario 3 provided little indication that their implementation would result in significant reductions of nitrate. Minimal reductions were made by representing nitrate removal in buffer strips using plant uptake rates of 1000 kg ha–1 yr–1; and
denitrification rates of 400 kg ha-1 yr-1 (values at the upper
end of the range found in the literature: Vyzamal, 2001; Leeds-Harrison et al., 1999). Even at low flows, where most significant improvements have previously been established, the reduction of nitrate concentrations to the Lee was minimal (Fig. 12).
In scenario 4, the 50% reduction of nitrate-N concentrations of selected effluent discharges into the Lee has greatest effect in reach 3. The reduction in instream nitrate-N ranges between 2 and 5 mg l–1, with the greatest
differences between original and scenario simulations when flow is low. The reduction of nitrate in reach 9, which also receives a large STW discharge, is less substantial. However, nitrate reductions of up to 3 mg N l–1 were still
simulated. The longitudinal profiles of the Lee also demonstrated the magnitude of the reductions caused by the reduced nitrate loading into reach 3, and the significant reductions immediately downstream (Fig. 13). The reduced nitrate input from Rye Meads STW benefits water quality
in reach 10 and reach 11, especially during low flows when nitrate pollution is most critical in these reaches.
Reducing abstractions from the Lower Lee by 20% (scenario 5) simulated a reduced nitrate concentration in reaches 10 and 11. The effect is greatest in reach 11 where a nitrate-N reduction from 17 mg l–1 to 13 mg l–1 is obtained
at the time of lowest flow (Fig. 14). Fig. 10. Scenario 1: day 30
Fig. 12. Scenario 3: day 30
Fig. 13. Scenario 4: day 30
Discussion
In reaches unaffected by effluent discharges and water abstractions, the periods of peak N concentration occurred at peak flows, while minimal flows resulted in an upward trend of nitrate. However, STW effluent discharges added considerably to the concentration of nitrate found in reaches,
and the problem was compounded during the summer when flow was lowest. Furthermore, the abstractions from the Lower Lee amplify the problems by marked reductions in the volume of water in these reaches. This may raise nitrate levels above the MAC, which then incurs water resource problems, as well as environmental damage. This suggests that management strategies on the Lee will necessitate
reductions in the loading of nitrate from STWs, while serious consideration must be given to reducing abstractions from the Lee.
Although agricultural and urbanised areas have been identified as significant sources of diffuse nitrate loading, it is uncertain that any viable land management plan alone would reduce nitrate enough to improve the environmental status of the Lee. However, changes in land use and land management practices would be beneficial to the Lee, since nitrate loading can be reduced by taking arable land out of production. The apparent benefits of this reduction would become greater if loadings from STWs were reduced.
Using the INCA model, riparian buffer strips were not predicted to offer any significant benefit to the reduction of nitrate loading. However, their use cannot be disregarded. Further investigation is needed to establish whether INCA can be used to simulate the function of riparian buffer strips. These strips can have additional benefits by reducing sediment and phosphorus loads to rivers and flooding problems further downstream through the restoration of the natural flood plain (Haycock and Burt, 1993).
Improvements could be made to the current simulation, because simulation of flow using MORECS HER overly generalised flows and consequently missed many significant peaks. Although adjustments were made to these data, a different model, such as IHACRES, to determine the dynamics of the two separate hydrological zones as well as
simulating runoff could be used (Whitehead et al., 1998). A better understanding of the somewhat artificial hydrology of the Lower Lee would also be beneficial, since the interactions of the Lee itself with various navigation channels appears complex. Furthermore, inclusion of time series of water abstractions from the Lee could be incorporated into the model using the ‘Effluent Time Series’ function, which is available in the current INCA version (v1.6) (Wade and Butterfield, 2001).
Lack of nitrate data for the upper reaches of the Lee led to difficulties in adjusting instream denitrification rates. Monthly sampling of N concentrations can result in peaks being missed, which was particularly true of ammonium because the concentrations change much more rapidly than for nitrate, for which general and longer-term trends are normally established. More frequent sampling for a period of time could be beneficial, especially downstream of the Luton (East Hyde) STW.
Since low flows have been established as a cause of raised nitrate concentrations, simulation of the effect of climate change on the Lee would be a viable and useful study. Global warming might reduce river flows with important implications for the management of water resources and for the ecological status of the river. Climate models could be used to predict the changes in hydrological variables, which could then be superimposed onto current data, as carried out by Limbrick et al. (2000) for the River Kennet. Fig. 14. Scenario 15: reach 11
Conclusion
For most of the Lee catchment, the leaching of N from urban and arable areas controls the changing dynamics of N in river reaches. However, when flows became minimal during summer and early autumn, nitrate increased because of lack of dilution. However, these N dynamics were upset by significant effluent discharges, or where flow was reduced substantially by abstractions. In these reaches, an increase in flow resulted in lowered concentrations of nitrate as the load was diluted. Ammonium concentrations were less susceptible to these influences.
The average simulated concentration of nitrate over the course of the River Lee for 1995–96 was 7.9 mg N l–1.
Compared to the European average of 4 mg N l–1 nitrate,
the River Lee suffers from high nitrate concentrations and it has been designated a ‘Eutrophic Sensitive Area’. Furthermore, in reach 11, the MAC of 11.3 mg N l–1 was
surpassed approximately 18% of the time during the two year simulation period; this could have serious implications for water resource management to supply London. The major sources of nitrate loading were identified initially as Luton (East Hyde) and Rye Meads STWs. The concentration of nitrate was highest when the effluent discharge accounted for a significant proportion of the river flow (i.e. when river flow was minimal). A 50% reduction in the nitrate concentration from Luton (East Hyde) STW should result in a fall of up to 5 mg N l–1 in reach 3; improvement would
occur in reaches immediately downstream. Large abstractions from reach 10 and reach 11 compounded pollution problems in summer, and a maximum nitrate concentration of 17 mg N l–1 was simulated in reach 11.
However, a 20% reduction in abstraction would result in a drop of up to 4 mg N l–1 in this reach. Concentrations of
ammonium fell largely within the ‘fair-good’ Environment Agency general water quality assessment, for all reaches.
High nitrate concentrations were found to be connected with land use; a simulation of the conversion of all arable land to ungrazed vegetation would result in substantial reductions in nitrate. The conversion of a smaller proportion (20%) of the arable land, this time to woodland, would reduce nitrate concentration by 1–2 mg N l–1 loading where
sub-catchments were dominated by agriculture. The representation of riparian buffer strips in an INCA simulation gave little reduction of nitrate loading. Whether INCA is unsuitable for such an assessment, or whether the establishment of buffer strips would be successful in this instance is inconclusive.
The River Lee is heavily polluted with nitrate, both from agricultural diffuse pollution and STW point sources. The problems of nitrate pollution are then further exacerbated
by the substantial abstractions from the Lower Lee to supply London. For any improvement in water quality, nitrate loading must be reduced and careful consideration given to future water resources management. Any changes to land management will have limited success in reducing pollution until a reduction of nitrate loading from the largest STWs is achieved.
Acknowledgements
This research is supported by the European Commission (Project EVK1-1999-00011). The authors would like to thank Heather Browning for help with the diagrams and CEH, ADAS and the Environment Agency for providing information on the River Lee catchment.
References
Burt, T.P. and Haycock, N.E., 1993. Controlling Losses of Nitrate by Changing Land Use. In: Nitrate: Processes, Patterns and
Management,T.P. Burt, A.L. Heathwaite and S.T. Trudgill
(Eds.). Wiley, Chichester, UK. 341–368.
Collins R., Whitehead, P.G. and Butterfield, D., 1999. Nitrogen leaching from catchments in the Middle Hills of Nepal; an application of the INCA model. Sci. Total Envir., 228, 259– 274.
EA, 1997. The Lee Fact File. Environment Agency, Bristol. EA, 2001a. Local Environment Agency Plan - Upper Lee.
Environment Agency, Bristol.
EA, 2001b. Local Environment Agency Plan - North London. Environment Agency, Bristol.
EA, 2001c. Pollutants from sewage treatment works in England
and Wales. Environment Agency, Bristol.
Flavin, R.J. and Joseph, J.B., 1983. The hydrogeology of the Lee Valley and some effects of artificial recharge. Quart. J. Eng.
Geol., 16, 65–82.
Halcrow Water, 1999. Water and Environment Water Quality
Strategy for the Lower River Lee.
Haycock, N.E. and Burt, T.P., 1993. The Sensitivity of Rivers to Nitrate Leaching: The Effectiveness of Near-stream Land as a Nutrient Retention Zone. p.260-272 In: Landscape Sensitivity, D.S.G. Thomas and R.J. Allison (Eds.). Wiley, Chichester, UK. Heathwaite, A.L., 1993. Nitrogen cycling in surface waters and lakes. In: Nitrate: Processes, Patterns and Management,T.P. Burt, A.L. Heathwaite and S.T. Trudgill (Eds.). Wiley, Chichester, UK. 99–140.
Heathwaite, A.L., Burt, T.P. and Trudgill, S.T., 1993. Overview – the Nitrate Issue. In: Nitrate: Processes, Patterns and
Management,T.P. Burt, A.L. Heathwaite and S.T. Trudgill
(Eds.). Wiley, Chichester, UK. 3–22.
Johnes, P.J., 1996. Evaluation and management of the impact of land use change on the nitrogen and phosphorus load delivered to surface waters: the export coefficient model approach. J.
Hydrol., 183, 323–349.
Johnes, P.J., Moss B. and Phillips, G., 1996. The determination of total nitrogen and total phosphorus concentrations in freshwaters from land use, stock headage and population data: testing of a model for use in conservation and water quality management. Freshwater Biol., 36, 451–473.
Leeds-Harrison, P.B., Quinton, J.N., Walker, M.J., Sanders, C.L. and Harrod, T., 1999. Grassed buffer strips for the control of nitrate leaching to surface waters in headwater catchments. Ecol.
Eng., 12, 299–313.
Limbrick, K. J., 2002. Estimating daily recharge to the chalk aquifer of Southern England. Hydrol. Earth Syst. Sci., 6,485– 495.
Limbrick, K.J., Whitehead, P.G., Butterfield, D. and Reynard, N., 2000. Assessing the potential impacts of various climate change scenarios on the hydrological regime of the River Kennet at Theale, Berkshire, south-central England, UK: an application and evaluation of the new semi-distributed model, INCA. Sci.
Total Environ., 251/252, 539–555.
NEGTAP, 2001, National Expert Group on Transboundary Air
Pollution. NEGTAP Draft Report.
O’Shea, M.J. and Sage, R., 1999. Aquifer recharge: an operational drought-management strategy in north London. J. Chart. Inst.
Water Envir. Manage., 13, 400–405.
Prior, H., 1998. Total nitrogen and total phosphorus cycling in
riparian ecosystems. Unpublished PhD thesis, University of
Reading.
Reid, K., 1995. River revival. Surveyor, 182, 20–21.
Rust Environmental, 1995. NRA (Thames Region) Lower Lee
Improvements – downstream of Tottenham. Rust Environmental.
Skeffington, R., 2002. European nitrogen policies and nitrate in rivers. Hydrol. Earth Syst. Sci., 6, 315–324.
Vought, L.B., Dahl, J., Lauge, C., Pedersen, L. and Lacoursiere, J.O., 1994. Nutrient retention in riparian ecotones. Ambio, 23, 342–348.
Vymazal, J., 2001. Types of constructed wetlands for wastewater treatment. In: Transformations of nutrients in natural and
constructed wetlands. J.Vymazal (Ed.). Backhuys, USA. 1–93.
Wade, A.J. and Butterfield, D., 2001. INCA v1.6 Release Notes. Aquatic Environments Research Centre, Department of Geography, Whiteknights, P O Box 227, Reading, RG6 6AB, UK.
Wade, A.J. and Whitehead, P.G., 2001. INCA v1.6 Calibration
Guidelines. Aquatic Environments Research Centre, Department
of Geography, Whiteknights, P O Box 227, Reading, RG6 6AB, UK.
Wade, A.J., Whitehead, P.G., Edwards, A.C., Butterfield, D., Smart, R.P., Cook, Y., Owen, R.P., Soulsby, C. and Langan, S.J., 2001. Modelling instream nitrogen variability in the Dee catchment, NE Scotland. Sci. Total Envir. 265, 229–252. Wade, A.J., Durand, P., Beaujouan, V., Wessel, W.W., Raat, K. J.,
Whitehead, P.G., Butterfield, D., Rankinen,K. and Lepisto, A., 2002. A nitrogen model for European catchments: INCA, new model structure and equations. Hydrol. Earth Syst. Sci., 6, 559– 582.
Whitehead, P.G., 1990. Modelling nitrate from agriculture to public water supplies. Phil. Trans. Roy. Soc. London, Series B, 329, 403–410.
Whitehead, P.G. and Williams, R., 1984. Modelling nitrate and algal behaviour in the River Thames. Water Sci. Tech., 16, 621– 633.
Whitehead, P.G., Williams, R. and Lewis, D., 1997. The QUASAR Water Quality Model. Sci. Total Environ., 194/195, 399–418. Whitehead, P.G., Wilson, E.J. and Butterfield, D., 1998. A
semi-distributed Integrated Nitrogen model for multiple source assessment in Catchments (INCA): Part I – model structure and process equations. Sci. Total Envir., 210/211,: 547–558. Woltermade, C.J., 2000. Ability of restored wetlands to reduce
nitrogen and phosphorus concentrations in agricultural drainage water. J. Soil Water Conserv., 55, 303–309.