HAL Id: hal-00328615
https://hal.archives-ouvertes.fr/hal-00328615
Submitted on 10 Oct 2008
HAL is a multi-disciplinary open access
archive for the deposit and dissemination of
sci-entific research documents, whether they are
pub-lished or not. The documents may come from
teaching and research institutions in France or
abroad, or from public or private research centers.
L’archive ouverte pluridisciplinaire HAL, est
destinée au dépôt et à la diffusion de documents
scientifiques de niveau recherche, publiés ou non,
émanant des établissements d’enseignement et de
recherche français ou étrangers, des laboratoires
publics ou privés.
Using geophysics on a terminal moraine damming a
glacial lake: the Flatbre debris flow case, Western
Norway
I. Lecomte, I. Thollet, H. Juliussen, S.-E. Hamran
To cite this version:
I. Lecomte, I. Thollet, H. Juliussen, S.-E. Hamran. Using geophysics on a terminal moraine damming
a glacial lake: the Flatbre debris flow case, Western Norway. Advances in Geosciences, European
Geosciences Union, 2008, 14, pp.307. �hal-00328615�
Adv. Geosci., 14, 301–307, 2008 www.adv-geosci.net/14/301/2008/ © Author(s) 2008. This work is licensed under a Creative Commons License.
Advances in
Geosciences
Using geophysics on a terminal moraine damming a glacial lake:
the Flatbre debris flow case, Western Norway
I. Lecomte1,2, I. Thollet3,*, H. Juliussen4,**, and S.-E. Hamran4
1International Centre for Geohazards, P.O.Box 3930, Ullevaal Stadion, 0806 Oslo, Norway 2NORSAR, P.O. Box 53, 2027 Kjeller, Norway
3University of Strasbourg, EOST, 5 rue Ren´e Descartes, 67084 Strasbourg Cedex, France 4University of Oslo, P.O. Box 1047, Blindern, 0316 Oslo, Norway
*now at: University of Nancy, France
**now at: University of Svalbard, Longyearbyen, Norway
Received: 23 July 2007 – Revised: 17 April 2008 – Accepted: 18 April 2008 – Published: 24 April 2008
Abstract. A debris flow occurred on 8 May 2004, in
Fjær-land, Western Norway, due to a Glacial Lake Outburst Flood and a natural terminal moraine failure. The site was investi-gated in 2004 and 2005, using pre- and post-flow aerial pho-tos, airborne laser scanning, and extensive field work inves-tigations, resulting in a good understanding of the mechanics of the debris flow, with quantification of the entrainment and determination of the final volume involved. However, though the moraine had a clear weak point, with lower elevation and erosion due to overflowing in the melting season, the sud-den rupture of the moraine still needs to be explained. As moraines often contain an ice core, a possible cause could be the melting of the ice, inducing a progressive weakening of the structure. Geophysical investigations were therefore carried out in September 2006, including seismic refraction, GPR and resistivity. All methods worked well, but none re-vealed the presence of ice, though the depth to bedrock was determined. On the contrary, the moraine appeared to be highly saturated in water, especially in one area, away from the actual breach and corresponding to observed water seep-age at the foot of the moraine. To estimate future hazard, water circulation through the moraine should be monitored over time.
1 Introduction
Glacier retreat is observed around the world and is usually associated with global warming. Beside the fact that glaciers are the major source of water for many local communities, especially in tropical areas like in the Andes, the retreat of a glacier can result in the formation of glacial lakes behind the
Correspondence to: I. Lecomte
(il@geohazards.no)
moraine. These lakes may then overflow during periods of high water discharge from the glacier (glacier lake outburst flood, or GLOF), generating impressive and often devastat-ing debris flows, which are a threat to the local population, as often seen in Peru at the Cordillera Blanca (Lliboutry et al., 1977).
The 2004 debris flow in Fjærland, Western Norway, de-veloped from a failure of a glacial moraine ridge, which caused the sudden drainage of the lake behind and possi-bly also a lake contained within the Flatbre glacier. A total soil and boulder volume of about 240 000 m3terminated in a boulder fan 3 km downstream, while the finer material in-undated fields and nearby areas. The initial volume of tilt at the moraine ridge is estimated to be 25 000 m3, showing a significant bulking as the masses cascaded down the valley. The volume of the lake itself behind the moraine was about 50 000 m3, but the volume of the water coming from under the glacier is unknown.
Early drainage from the glacier and blockage of the nor-mal drainage routes, combined with a weakening of the moraine ridge, may have triggered the event (overtopping). In a warming climate, a likely scenario in many high moun-tain glacial regions is the melting of ice cores and inter-nal erosion of moraines damming glacial lakes, leading to dam ridge failure when high drainage occurs. To evalu-ate whether geophysics could be useful for investigation of the inner structure of the moraine, a geophysical campaign was performed in September 2006, consisting of resistivity, Ground-Penetrating Radar (GPR) and seismic refraction. A new type of rough terrain antenna was tested for the GPR. The goal was not only to perform geophysical investigation of a specific site, but also to evaluate the different methods in terms of practibility, cost and returned value. Based on the recommendations given by Reynolds (2006), both GPR and
302 I. Lecomte et al.: Using geophysics on a terminal moraine damming a glacial lake
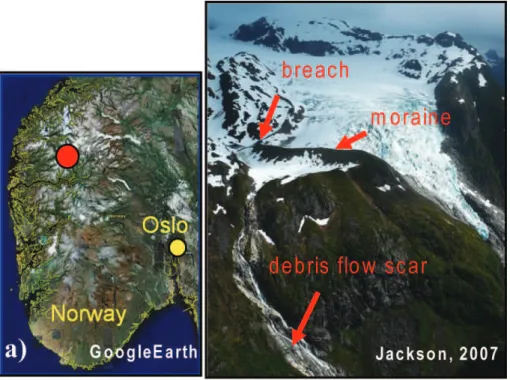
Fig. 1. (a) Location of the site in Western Norway. (b) Overview of the site.
resistivity were chosen as the methods of choice. In addition the seismic refraction technique was used despite the prob-lems usually encountered by such a technique (bad coupling of the receivers to the ground, loose material, etc.).
2 The Flatbre site
The site is located in Western Norway, in the Fjaerland region (Fig. 1a, red dot). The terminal moraine of Flatbre at about 1000 m a.s.l. (Fig. 1b) was probably formed in the Little Ice Age and was damming a small lake due to the last hundred years of glacier retreat (Jackson, personal communication). The moraine is about 650 m long, with heights between 25 and 50 m, and a slope from about 30◦downstream to more
than 35◦upstream. The material of the moraine is from the
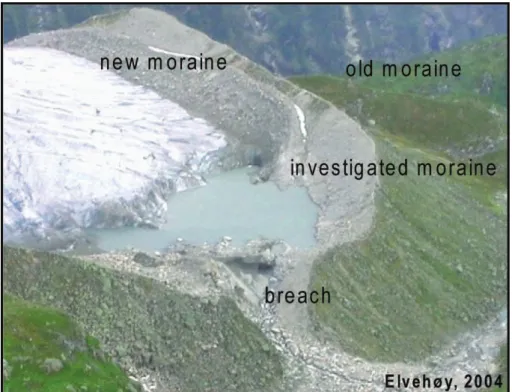
Late Holocene and has minimal clay content, hence is easily eroded. The scar of the debris flow is still visible on a picture taken 3 years later (Fig. 1b). Figure 2 shows the moraine right after the 2004 GLOF with a clear breach through which water from both the lake and from below the glacier escaped. Note also an old moraine in the background, and a small new moraine against the principal one. The new moraine is ice-cored, as easily observable in the field, with ice just beneath the moraine surface.
Thorough studies of the 2004 Flatbre debris flow and its possible causes can be found in Breien (2005) and Breien et al. (2008), especially regarding the dynamic of the de-bris flow. Key glaciologic information was also provided by the Norwegian Water Resources and Energy Directorate
(NVE, M. Jackson, personal communication). The site is at about 1000 m a.s.l., i.e., below the normal permafrost eleva-tion in Norway (about 1400–1600 m a.s.l.; Etzelm¨uller et al., 2003). But local conditions may lower this limit; the site is at the edge of the largest glacier on the European conti-nent; i.e., the Jostedalsbreen glacier. The small lake behind the moraine is regularly emptied each year (seasonal activ-ity), but mostly subglacially, draining out to the regenerated outlet glacier Supphellebreen (steep down-going part of the glacier in Fig. 1b). No damage is reported for such events and the site was therefore not considered as potentially dan-gerous (Vaksdal and Melvold, 2003). However, events simi-lar to the one in 2004 may have occurred in 1924 and 1947, although not on such a large scale as in 2004 (Breien, 2005). In 2004, E. Øygard, owner of both the nearby farm in the valley and the cabin close to the moraine, was a witness of the GLOF and subsequent debris flow, and took photographs (Fig. 3a). The violence of the event is clearly demonstrated by the depth of the erosion along the flow path (Fig. 3b), the size of the flooded area in the valley (Fig. 3c) with a total run-out of about 3 km, and the size of the transported boul-ders (Fig. 3d).
The Flatbre moraine in Fjaerland is a good candidate for a field laboratory site and as much data as possible was col-lected to better understand what happened and why. In ad-dition, testing of geophysical methods and equipment is pos-sible, which allows evaluation of which methods give use-ful results. Glacier hazards are difficult to investigate due to their remoteness (Reynolds, 2006). Though helicopter
I. Lecomte et al.: Using geophysics on a terminal moraine damming a glacial lake 303
Fig. 2. Aerial photography of the moraine site after the 2004 GLOF.
Fig. 3. (a) Photographs taken by E. Øygard during the 8 May 2004, GLOF. (b) Erosion along the path of the flow. (c) Boulder fan and part
of the mud flooded area. (d) Example of transported boulders down in the valley.
transportation is a necessity at Flatbre, the cost is reasonable as the flight takes only a few minutes. Such case studies are useful to gain experience and should be done, especially in countries like Norway which can afford the cost. As glacier
retreat is observed all over the world, and believed to be as-sociated with global warming, it is of major importance for the international society to learn more about glacier hazards for better prevention and mitigation in the future.
304 I. Lecomte et al.: Using geophysics on a terminal moraine damming a glacial lake
Fig. 4. Electrical resistivity data. (a) Location of the profiles. (b) Examples of electric tomography profiles, with P3 and P9 showing both
very low resistivity down in the main moraine (high water saturation) and very high resistivity (ice in the new moraine). The old moraine shows intermediate values.
3 Geophysical investigations
Several types of geophysical measurements were carried out in September 2006. Our goal was to use standard meth-ods and processing software to evaluate their applicability in such a difficult terrain. The development of near-surface geo-physics has been significant in the last 10 years, with much better equipment and software now available. Beside the sep-arate development of various techniques, the trend is now to integrate several types of measurements for joined inver-sion/interpretation (Grandjean, 2006), which is a promising approach which leads to less uncertainty.
3.1 Resistivity
Resistivity measurements are useful in permafrost areas and have been proved to work well on similar moraine investiga-tions (Reynolds, 2006). Except for the transport of the equip-ment, done here with helicopter, the equipment is rather easy to install and operate (electrodes in the ground), but the mea-surements take time. The data can be easily processed in the field, on the same day, giving quick, valuable information. 3.1.1 Equipment and setting
We used an ABEM Lund multi-electrode Terrameter SAS 300 system, with 40 m cables (2 to 5 cables depending on the profiles), and 2 m spacing between the electrodes. The Wenner configuration was chosen and the standard Res2DInv software used for the data inversion. Due to the time needed for the acquisition of each profile (about 2 h), in addition to
the installation, only 7 profiles were acquired during the 3 days on site (Fig. 4a).
3.1.2 Results
Figure 4b shows four of the profiles. On both profiles P3 and P9, the acquisition line went through the new moraine, which explains the very high observed resistivity values (above 200 000 Ohm m, blue colors), characteristic of ice. As one of the questions to be answered by using geophysics was the presence of ice in the moraine, the resistivity profiles gave us a quick answer, i.e., no ice core observed in the pene-trated area, observation later confirmed by both GPR and seismic refraction. On the contrary, the inner part of the main moraine is characterized by rather low resistivity values (the opposite side of the scale, red-brownish colors) indicating a progressive water saturation of the moraine material with depth. Profiles P6 to P8 show the lowest resistivity value, and this corresponds to a zone of the moraine where water seepage is observed at its foot (Fig. 4c). Note that this zone is away from the breach and may indicate a preferential path of water flow through the moraine.
3.2 GPR
Gound-Penetrating Radar (GPR) techniques are also re-ported to work well in permafrost areas and on moraines (Reynolds, 2006). The data acquisition can be difficult and time-consuming, especially with the standard antennas, though the result is more or less directly available on the
I. Lecomte et al.: Using geophysics on a terminal moraine damming a glacial lake 305
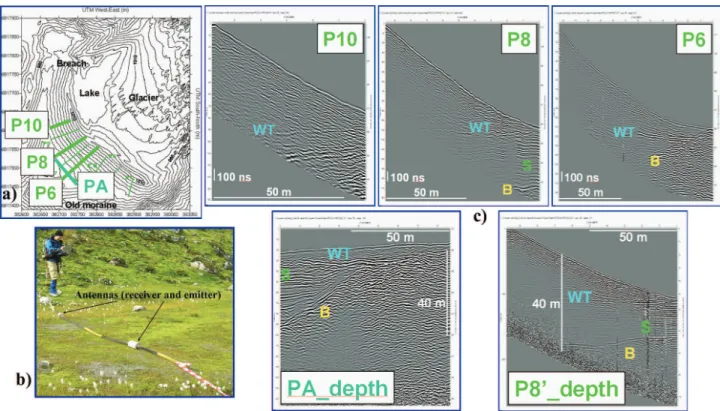
Fig. 5. GPR. (a) Location of the profiles. (b) 50 MHz cquisition system with both emitting and receiving antennas on the same rod and
pulled by an operator (c) Examples of processed profiles, the upper ones being in time, and the lower ones obtained after depth conversion. Water-table like reflectors (WT), bedrock (B) and lake-deposit sediments (S) are identified.
screen of a laptop in real-time as a radar section in time, often quickly translated to depth.
3.2.1 Equipment and settings
We had both standard non-shielded antennas (25 and 50 MHz) and a new rough-terrain 50 MHz antenna of Mal˚a (Fig. 5b). We quickly found out that the latter was the per-fect tool to use on the moraine due to numerous and often large boulders covering it and preventing the use of the long antennas. The acquisition was so efficient compared to the standard antennas that all profiles in Fig. 5a were more or less acquired within a day.
3.2.2 Results
The data were processed using ReflexW. Though the struc-ture inside the moraine is quite heterogeneous, with different grain sizes from rather fine sand to large boulders, the GPR results showed several interesting features with clear reflec-tors down to 30–40 m in depth (Fig. 5c). Some are associated with water-table like features (strong and near horizontal re-flectors, see P6). Others are typical layered structures (in PA and P8) believed to be lake deposits in an older lake trapped by the older moraine. In addition, bedrock is clearly reached in several profiles. Strong diffractions at dipping bedrock can be seen along Profile PA at the foot of the moraine, thus
giv-ing the possibility to estimate velocities at several depths in order to properly convert from time to depth (bottom profiles in Fig. 5c). A velocity in the main moraine and a different one in the lake deposits were then used.
Despite a chaotic image inside the top part of the moraine due to interfering diffractions on boulders, the water-table like reflectors seem to correspond to the zones of higher wa-ter content detected by resistivity. The rather fine layered structure below the moraine may also channelize water from the glacier and under the moraine, which may in turn increase its internal erosion.
3.3 Refraction seismic
In contrast with resistivity and GPR techniques, seismic re-fraction data are much more complicated to acquire and pro-cess, and are generally of poor quality in coarse and sandy material (Reynolds, 2006). While on site, we usually just get a first guess of the information contained in the data, but sometimes long and difficult processing are needed after field work (event picking). As with the GPR data, we used Re-flexW as the standard software.
3.3.1 Equipment and settings
We used a 24-channel Geode (Geometrics) with 24 ver-tical geophones and 5-kg hammer-blows as source after
306 I. Lecomte et al.: Using geophysics on a terminal moraine damming a glacial lake
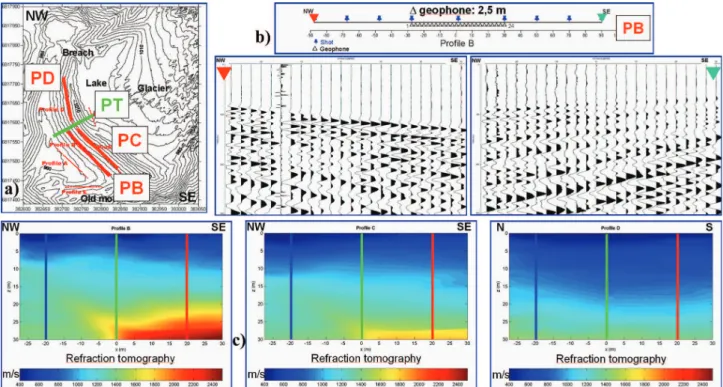
Fig. 6. Seismic refraction data. (a) Location of the profiles. (b) Example of 2 shots for one of the profile (PB). (c) Refraction tomography
results for 3 profiles.
Fig. 7. Seismic refraction data (2). (a) Geometry of the transverse profile (see location in Fig. 6a) with 24 fixed geophones and 49
hammer-blow positions. (b) Final tomography result. (c) Vertical velocity profile at the lateral position given in (b). (d) Examples of shot recordings.
comparison with a seismic gun (Betsy gun). The use of the latter was difficult, slowing down significantly the acquisi-tion without giving better results. Five standard refracacquisi-tion profiles were acquired, three on the main moraine, one on the old one and one at the foot of the moraine, all along the cor-responding moraine axis, the sampling between geophones being 2.5 m (Fig. 6a). In addition, a line across the main moraine was acquired with denser shots and with the 24
geo-phones located on the distal side every 3 m (PT in Fig. 6a with a cross-section given in Fig. 7a; one day was needed for that profile only).
3.3.2 Results
The seismic refraction data were of very good quality and hammer blows were sufficient for offsets up to 80 m from the receiving line extremities (Fig. 6b). The data were
I. Lecomte et al.: Using geophysics on a terminal moraine damming a glacial lake 307 systematically of better quality above the wetter zone
identi-fied by both resistivity and GPR, while showing weaker first-arrivals away from that zone, either towards the breach or on the South-East side. We used the wavefront-based to-mography approach of ReflexW to produce tomograms, as in Fig. 6c and Fig. 7b. No ice-velocity is found within the moraine, in agreement with resistivity. Within the moraine, the velocity increases with a rather linear gradient (com-paction and/or capillarity-induced water content) up to water-like velocities, followed by a transition zone believed to cor-respond to the highly water-saturated sediment package, be-fore reaching the bedrock (Fig. 7c). The good quality of the data, also shown in Fig. 7d, was unexpected and a denser ac-quisition in lines, receivers and shots, would have permitted a 3-D tomography.
4 Conclusions
All techniques worked well, providing useful information, despite a very blocky moraine material. There is, for exam-ple, no evidence of ice, at least at the penetrated depths (30– 40 m). On the contrary, the moraine is quite wet, character-ized by low resistivity in contrast to icy material closer to the glacier, seismic velocities typical of water-saturated material, and clear water tables visible within the GPR data. The depth to bedrock is determined at the base on the distal side using both GPR and seismic refraction. The very good quality of the seismic refraction data, usually poor on such moraine ma-terial, is an additional indication of high water content. Both resistivity and GPR are very efficient techniques, providing results while on site. Seismic refraction is more difficult to use, but its results, when combined with those of the two pre-vious mentioned techniques, give a more complete image of the moraine. A zone of apparently higher water content was identified and may require continuous monitoring to better assess the water flow inside the moraine. Geophysical meth-ods such as resistivity monitoring, self-potential (SP) mea-surements, and hydrological measurements could be used for that purpose. It is also necessary to map the bedrock to de-fine its topology and low-frequency GPR could help doing so (acquisition on snow at the end of the winter).
Judging from the quality of the collected seismic refrac-tion data, the recording time-window should have been in-creased (up to 1 s, for instance) to allow complete recording of surface waves, especially their fundamental mode. These waves are good indicators of the shear strength of a geolog-ical structure. Despite our short time-window, preliminary processing of surface-wave data gave interesting results, es-pecially shear-wave velocity 1-D profiles and 2-D sections, which complete the compressional-wave results (A. Bitri, BRGM, personal communication). In addition, joined inver-sion/interpretation of the different data sets, based on several types of measurements, could better constrain all of the re-sults and lead to clearer conclusions. The data are available
for external studies and the Flatbre site could be considered as a field laboratory in the future, especially in view of the proximity of the Norwegian Glacier Museum in Fjaerland.
Acknowledgements. First of all, the authors would like to thank
the students who helped us in the field, i.e., May Bagge-Lund, Alban Souche and Maria Sand. We also thank Hedda Breien for bringing up the case to us, and Karl Joseph Sandmeier for his help with ReflexW. Thanks to the Norwegian Research Council and the International Centre for Geohazards. Many thanks to the field work sponsors: the Norwegian Glacier Museum (Lisbeth Vedaas), NORSAR, the Norwegian Geotechnical Institute and the Geological Survey of Norway. Thanks to T. Dybwad from the regional municipality of Sogn og Fjordane for the authorization to work in a national park. Many thanks go to G. and E. Øygard for their cabin and hospitality! Last but not least, thanks to our ICG colleagues, who followed the case and with whom we had many interesting discussions, and to NVE (Miriam Jackson) for providing additional information and material. This publication is ICG contribution #191.
Edited by: P. Lagos
Reviewed by: M. Larsen and B. McArdell
References
Breien, H.: On the dynamics of debris flows: Case study Fjaer-land, Western Norway – a debris flow triggered by a natural dam breach, Master thesis in Geosciences, University of Oslo, 2005. Breien, H., Elverhøi, A., De Blasio, F., and Høeg, K.: Erosion
and morphology of a debris flow caused by a glacial lake out-burst flood, Western Norway, Landslides, doi:10.1007/s10346-008-0118-3, in press, 2008.
Etzelm¨uller, B., Berthling, I., and Sollid, J.L.: Aspects and concepts on the geomorphological significance of Holocene permafrost in southern Norway, Geomorphology, 52, 1–2, 87–104, 2003. Grandjean, G., Malet, J.-P., Bitri, A., and M´eric, O.: Geophysical
data fusion by fuzzy logic for imaging the mechanical behaviour of mudslides, Bull. Soc. Geol. France, 178(2), 127–136, 2007. Lliboutry, L., Morales Arnao, B., and Schneider, B.:
Glaciologi-cal problems set by the control of dangerous lakes in Cordillera Blanca, Peru, I. historical failures of morainic dams, their causes and prevention, J. Glaciol., 18(79), 239–254, 1977.
Reynolds, J. M.: Role of geophysics in glacial hazard assessment, First Break, 24, 61–66, 2006.
Thollet, I.: Glacial hazards and Geophysics: study of the Flatbre moraine after a glacial lake outburst flood (Western Norway), Dipl. Eng. Geophys. Thesis, University of Strasbourg, ICG re-port T1-2006-1, 2006.
Vaksdal, M. and Melvold, K.: Glacier Inventory in Norway, Sur-vey and prevention of extreme glaciological hazards in euro-pean mountainous region, GLACIORISKS, EU 5th Framework Programme, EVG1 2000 00512, compiled by D. Richards and M. Gay, 2003.