First International Conference on Bio-based Building Materials June 22nd - 24th 2015 Clermont-Ferrand, France
INVESTIGATION OF PERFORMANCE TESTS USING BIO-DERIVED/CHEMICAL
ADDITIVES
J. Podolsky1*, A. Buss2, R.C. Williams3, E. Cochran4 1
Iowa State University, 174 Town Engineering, Ames, IA 50011, USA 2 Iowa State University, 403 Town Engineering, Ames, IA 50011, USA 3
Iowa State University, 490 Town Engineering, Ames, IA 50011, USA 4 Iowa State University, 1035 Sweeney, Ames IA 50011, USA
*Corresponding author; e-mail: podolsky@iastate.edu
Abstract
An industry wide emphasis on sustainable asphalt practices has given rise to increasing use of warm mix asphalt technologies. WMA reduces both binder viscosity and mixing and compaction temperatures by 20-55°C during the asphalt mix production and laydown process. This research investigates several bio-derived WMA additives that act as chemical modifiers with surfactant properties. Two established additives derived from the forest products industry are studied as well as a WMA additive in development that is derived from corn. The WMA material responses are measured for binder testing and mixture testing. All binder testing with the additives was conducted using a Performance Grade (PG) 64-22 binder and the same binder was polymer modified with an SBS polymer to attain a PG 70-22 binder. Dynamic modulus testing on a State DOT approved 10 million ESAL mix design was performed to compare stiffness at a wide range of temperatures and frequencies. The newly developed, corn-derived IDB additive was successful in allowing asphalt to be compacted at a reduced temperature. All additives were added at the same dosage level. The IDB binder and mix test results were comparable to other commercially available WMA additives; however, no particular additive consistently produced the highest or lowest test results.
Keywords:
warm mix asphalt, bio-derived
1 INTRODUCTION
The notion or idea of warm mix asphalt (WMA) came about when the European Union (EU) started creating more sustainable technologies after the ratification of the Kyoto Protocol in the mid-1990s. Several companies in Europe researched different ways of implementing the Kyoto Protocol and lower emissions by reducing production temperatures in asphalt mix plants. This brought about the creation of WMA. WMA was first introduced in the United States by the National Asphalt Pavement Association (NAPA) in 2002. In 2003, a joint meeting was held between NAPA, the Federal Highway Administration (FHWA), and the National Center for Asphalt Technology (NCAT) to explore further opportunities with WMA use in the United States. The next year, the “World of Asphalt Show and Conference” had a live demonstration of WMA being constructed. In 2007, the Federal Highway Administration’s International Technology Scanning Program organized a team of U.S. experts to visit four European countries and evaluate whether WMA use in the United States was feasible. The team of experts recommended WMA as
an alternative to HMA for use in the United States after the visit [D'Angelo, 2008; Newcomb, 2007].
During asphalt mix and laydown WMA enables reductions in viscosity and reductions in mixing and compaction temperatures by as much as 20°C-55°C. Lowering the asphalt mixing and compaction temperatures saves money due to lower fuel use, which also lowers the carbon footprint as an effect. By reducing binder viscosity, lower compaction temperatures can be used in the field; which in turn improves mix compactability, and extends the time paving can be done by allowing for longer haul distances. WMA additives also work well with recycled asphalt pavement (RAP) and recycled asphalt shingles (RAS) [Buss, 2014]. An added benefit from lower mixing and compacting temperatures is that there is less fumes produced that workers will be exposed to [Button, et al., 2007; D'Angelo, 2008; Gandhi, 2008; Hassan, 2009; Hurley & Prowell, 2006; Jenkins, et al., 1999; Kim, et al., 2012; Kristjánsdóttir, 2006; Kristjánsdóttir, et al., 2007; Larsen, et al., 2004; Perkins, 2009; Prowell, et al., 2007].
WMA technologies are generally split between four groups; foaming – water based, foaming – water
bearing additive, chemical additive, and organic/bio-derived additive. The first of the two foaming technologies (water based) is physical in terms of the production process due to introduction of water to create the foaming effect. There are two main methods for foaming (water based) asphalt at lower temperatures; the WAM-foam method, and the Astec Double Barrel Green method [Anderson, et al., 2008; Koenders, et al., 2002; Middleton & Forfylow, 2009]. The second foaming technology (water bearing additive) creates the foaming effect in asphalt through the release of water from additives during the mixing process. The two most commonly used water bearing additive technologies are Advera and Aspha-min [Anderson, et al., 2008; Hossain, et al., 2011; Hurley & Prowell, 2005a]. Both chemical and organic/bio-derived additives when blended to asphalt binder reduce the binder viscosity. Commonly used chemical and organic/bio-based additives in WMA are Evotherm 3G, Sasobit, and Asphaltan B [Button, et al., 2007; Corrigan, 2006; Hurley & Prowell, 2005b, 2006]. Isosorbide distillation bottoms (IDB) is a bio-derived co-product from corn with surfactant properties. The corn-derived WMA additive is produced as part of a bio-refining process. As an initiative to achieve zero waste in the refining process, distillation bottoms were identified as having chemical characteristics that may be of value as a WMA additive. The use of the additive is beneficial for creating a more sustainable bio-refining process as well as more sustainable roadways. IDB is produced as part of the conversion of sorbitol to isosorbide. Sorbitol is produced by hydrogenating the glucose from the corn biomass [Werpy, et al., 2004]. IDB will be studied as a WMA bio-derived additive in this study. Commercially available chemical/bio-based additives from the forest products industry called forest product 1 and 2 (FP 1 and FP 2) will also be used for binder modification in this study. FP 1 and 2 are water-free chemical/bio-based additives that display surfactant properties. When asphalt binder modified with FP 1 or FP 2 is added to aggregates the aggregate-binder interface friction is reduced due to the surfactant properties of both FP 1 and 2. A reduction in the interface friction between the aggregates and binder make it possible to lower the mixing and compaction temperatures [Buss, et al., 2014; Leng, et al., 2013]. In the literature it is recommended that chemical/bio-derived additives from the forest products industry are added at an optimum dosage level of 0.5% by weight of the total binder, and in a recently completed binder study it was found that the optimum dosage level for IDB addition is 0.5% by weight of the total binder. Therefore, 0.5% addition level was used in this study [Hurley & Prowell, 2006]. 2 OBJECTIVES
The objective of this paper is to compare the performance test results of three bio-derived warm mix additives. The newly developed IDB WMA additive is of particular interest because it is derived from corn, produced during a bio-refining process. IDB is compared with two versions of a commercially available WMA additive and a control group. Test groups will include the various studied using an unmodified and polymer-modified binder. Performance testing of asphalt mix is conducted over a range of temperatures and frequencies to characterize material behavior for various pavement environmental and
loading conditions. Binder testing was also performed at various temperatures to compare the additive performance at high temperatures.
3 MATERIALS AND METHODS 3.1 Material Description
Within this study, the asphalt parent material was a Montana crude, which is similar to a Canadian crude source. The Montana crude was used at its original grade of performance grade (PG) 64-22, and also used as a polymer modified binder (1.5% styrene-butadiene-styrene (SBS) polymer modification), PG 70-22. An Iowa DOT approved surface mix with a 10 million equivalent single axel loads (ESAL) design level was used to construct dynamic modulus samples in the laboratory. The aggregate types, gradation, and material suppliers used for this mix design are shown in Tab. 1. The gradation for each aggregate was verified with the mix gradation in the job mix formula from the Iowa DOT. The laboratory mix gradation was adjusted to increase the fines in the blended gradation by the addition of commercially produced hydrated lime to simulate the change in gradation due to aggregate breakdown during plant production. Before the blended gradation was matched to the job formula, each aggregate was sieved in their appropriate proportions to create less variability between batches. The addition of 2% hydrated lime matched to the job mix formula gradation.
Three additives were used in this study – IDB, FP 1 and FP 2 – all at addition rates of 0.5% by weight of the binder. IDB is derived from corn while FP 1 and 2 are WMA chemical additives derived from tall oil (tree oil). The research literature recommends that the optimum dosage level for both FP 1 and FP 2 is 0.5% by weight of the total binder, and in recently completed binder studies, it was found that the optimum dosage level for IDB addition is also 0.5% by weight of the total binder. Therefore, 0.5% addition level was used in this study to compare the three technologies. A Silverson shear mill was used for blending the binders with the WMA additives – IDB, FP 1 and FP 2 at 140 °C±10 °C for one hour with a blending speed of 3000 rpm. The polymers were blended by the binder supplier in the case of the polymer modified PG 70-22 binder.
3.2 Dynamic Modulus Test
The dynamic modulus test was performed on four groups of samples: no additive (control), 0.5% IDB, 0.5% FP 1 and 0.5% FP 2 samples using two binder types; the PG 64-22 and the polymer-modified PG 70-22 binder. The dynamic modulus values were calculated at several different frequency-temperature combinations for the mix combinations. The temperatures used in testing were 4 °C, 21 °C, and 37 °C while the test frequencies were 25 Hz, 20 Hz, 10 Hz, 5 Hz, 2 Hz, 1 Hz, 0.5 Hz, 0.2 Hz, and 0.1 Hz. An asphalt mixture’s dynamic modulus varies with both temperature and loading frequency, making comparisons between results more involved. The development of dynamic modulus master curves provides a direct means of viewing a representation of dynamic modulus results that is much easier to interpret. With a dynamic modulus master curve, it is much easier to make a comparison between several sets of dynamic modulus results at various temperatures [Christensen & Anderson, 1992]. According to research conducted by Li and Williams [Li
& Williams, 2012], testing E* values at three temperatures (4.4, 21.1, and 37.8 °C) did not change the shape of master curves constructed by data from nine frequencies ranging from 25 Hz to 0.1 Hz when compared to using data from 5 temperatures each at six frequencies.
Dynamic modulus samples contained an optimum binder content of 5.2% and were compacted to 7% ± 1% air voids. Sample dimensions were 100 mm in diameter and 150 mm in height. All mixes, regardless of additive and binder type, were mixed at 140 °C. The control HMA mixture was compacted at 140 °C. The mixtures containing WMA additives were compacted at
120°C. Five replicate samples for each group were tested for the development of this paper.
3.3 Dynamic Shear Rheometer
The binder testing was performed using a dynamic shear rheometer (DSR) on three samples for each of the four groups: no additive, 0.5% IDB, 0.5% FP 1 and 0.5% FP 2 using the PG 64-22 and PG 70-22 binders. A DSR was used to test the binders after they were RTFO aged (short term aged) at one frequency (1.59 Hz – 10 rad/sec) and at three temperatures (58 °C, 64 °C, and 70 °C for the PG 64-22 binder, and 64 °C, 70 °C, and 76 °C for the PG 70-22 binder) (AASHTO, 2011).
Tab. 1: Mix Design Gradation and Supplier Information Ames Mine/Martin Marietta Ames Mine/Martin Marietta Dell Rapids E. Minnchaha Co/Everist Inc. Ames Mine/Martin Marietta Ames Mine/Martin Marietta Ames South/Hallet Materials Co. Commercially Produced 1/2 CRUSHED EC 3/4 CL CHIP EC 1/2 X 4 QUARTZITE 3/8 CL CHIP LC MANF SAND
LC SAND Hydrated Lime
26% 11% 13% 8% 23.5% 16.5% 2%
U.S. Sieve, mm Mesh Number % Passing % Passing % Passing % Passing % Passing % Passing % Passing
37.5 100 100 100 100 100 100 100 100.0% 25 1 in. 100 100 100 100 100 100 100 100.0% 19 3/4 in. 100 98 100 100 100 100 100 99.8% 12.5 1/2 in. 91 58 99 100 100 100 100 92.9% 9.5 3/8 in. 70 32 78 92 100 100 100 81.2% 4.75 No.4 35 5 7.7 25 98 98 100 53.9% 2.36 No.8 19 1.5 1.2 3.1 68 87 100 37.8% 1.18 No.16 12 1.4 0.6 1.8 36 69 100 25.3% 0.6 No.30 10 1.3 0.4 1.6 16 40 100 15.3% 0.3 No.50 8.5 1.2 0.3 1.5 6 8 100 7.2% 0.15 No.100 8.2 1.1 0.2 1.2 2 0.6 100 4.9% 0.075 No.200 8 0.9 0.1 1 1.2 0.2 100 4.6% % Used Aggregate Supplier Blend Gradation
4 DISCUSSION OF RESULTS AND
ANALYSIS
4.1 Dynamic Modulus Test Results
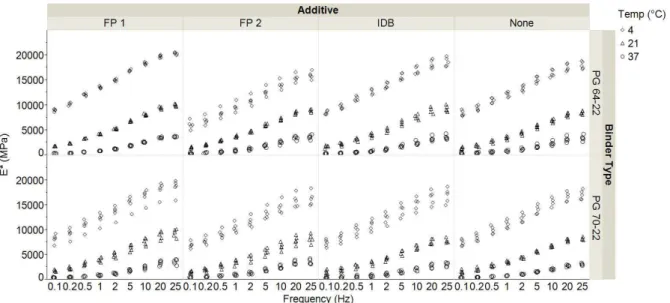
The measured E* results across three temperatures (°C) and nine frequencies (Hz) for each additive and binder type are shown in Fig. 1. From the trends in Fig. 1, it is observed that E* values for all eight groups of samples increase with an increase in frequency and a decrease in temperature at which each test is conducted.
To conduct a statistical analysis using the raw measured E* results, the data needs to be examined to see if the central limit theorem is met. The spread of the unshifted E* results for each group is shown in Fig. 2 (a) and illustrates that the central limit theorem is not met because the variance decreases with increasing temperature for each group and thus exhibits heteroscedasticity. A square root transformation of the raw E* values was performed and is shown in Fig. 2 (b). After the transformation, the data satisfies the central limit theorem.
An analysis of variance (ANOVA) was conducted to examine which factors significantly affect the square root transformed E* values. A split-plot/repeated-measures (SPRM) design was used to conduct the ANOVA. The whole plot factors examined are binder type - A, and additive - B, while the sub plot factors examined are temperature (°C) - C, and frequency (Hz)–D.
All the interactions between binder type - A, additive - B, temperature (°C) - C, and frequency (Hz) – D are
also studied. The statistical program JMP was used to perform the ANOVA analysis.
Tab. 2, shows the ANOVA analysis and the p-values for the factors studied. To be a statistically significant source of variability at the 95% confidence level, the p-value must be less than or equal to 0.05. As expected, there are differences in the E* material response for the different binders, temperatures and frequencies. The real factor of interest is the influence of the additive on E* and the potential binder interactions. The ANOVA analysis shows that the additive does significantly affect the E* response but there is not a binder-additive interaction. This indicates that the additives influence the E* results for both binders in the same way. This is important because it demonstrates no changes in the additive effect when polymerized asphalt is used. The only interactions that are not statistically significant sources of variability are A*B, A*B*D, A*C*D, B*C*D, and A*B*C*D, while the rest of the interactions are significant sources of variability. The small p-value in the ANOVA table in Tab. 6 shows that there are significant differences between at least one the additives at the 95% confidence level. The results shown in Fig. 3 suggest that FP1 is significantly different from the other additives. A Tukey Honestly Significant Differences (HSD) comparison was performed to mathematically verify the observations in Fig. 3. The comparison of additives confirmed that FP 1 is statistically different from that of FP 2, IDB and the control group according to a 95% confidence level.
Fig. 1: Comparison of all E* Results across Additive and Binder Type.
(a)
(b)
Tab. 2: ANOVA of Square Root of E* (MPa^1/2) using SPRM Design
Source SS MS Number DF Number F Ratio Prob > F Binder Type - A 1.04E+03 1.04E+03 1 6.45 0.0161
Additive - B 4.73E+03 1.58E+03 3 9.76 0.0001 Binder Type*Additive 8.98E+02 2.99E+02 3 1.85 0.1572 Temp (°C) - C 1.06E+06 5.28E+05 2 119317.98 <.0001 Binder Type*Temp (°C) 4.27E+02 2.13E+02 2 48.17 <.0001 Additive*Temp (°C) 4.57E+03 7.62E+02 6 171.97 <.0001 Binder Type*Additive*Temp (°C) 9.97E+02 1.66E+02 6 37.50 <.0001 Frequency (Hz) - D 2.78E+05 3.47E+04 8 7842.51 <.0001 Binder Type*Frequency (Hz) 3.26E+02 4.08E+01 8 9.21 <.0001 Additive*Frequency (Hz) 2.56E+02 1.07E+01 24 2.41 0.0002 Binder Type*Additive*Frequency (Hz) 2.87E+01 1.20E+00 24 0.27 0.9998 Temp (°C)*Frequency (Hz) 5.49E+03 3.43E+02 16 77.47 <.0001 Binder Type*Temp (°C)*Frequency (Hz) 8.47E+01 5.29E+00 16 1.20 0.2655 Additive*Temp (°C)*Frequency (Hz) 6.29E+01 1.31E+00 48 0.30 1.00 Binder Type*Additive*Temp (°C)*Frequency (Hz) 8.39E+01 1.75E+00 48 0.39 1.00
Specimen No.[Binder Type, Additive]&Random 5.17E+03 1.61E+02 32 36.44 <.0001
4.2 Dynamic Shear Rheometer Results
The average complex shear modulus, G*, results for each additive by binder type across temperature is shown in Fig. 4, while the average phase angle results for each additive by binder type across temperature is shown in Fig. 5. Trends show expected asphalt behavior with G* values decreasing and phase angle values increasing as temperature increases. However, it is not clear from these trends whether the additives within each binder type are statistically different from one another in terms of their G* and phase angle values. Thus a statistical analysis is needed to see the differences more clearly.
Fig. 3 Comparison of the transformed E* results for additives (B)
An ANOVA using a SPRM design was used to investigate if there are differences between the binders modified with each additive for the PG 64-22 and the PG 70-22 binders. An ANOVA was done separately for each binder type because the binders were tested at different temperatures. The results of the statistical analysis are shown in Tab. 3 for each binder (PG 64-22 and PG 70-64-22), G* and phase angle results. Tab. 3 shows p-values are <0.005 for both binders and additives, indicating that the WMA additive type significantly influences the G* and phase angle. Temperature is expected to show significant differences. The interaction of additive and temperature is significant indicating that lower test temperatures show G* more sensitive to additive type
than higher test temperature readings that are more uniform.
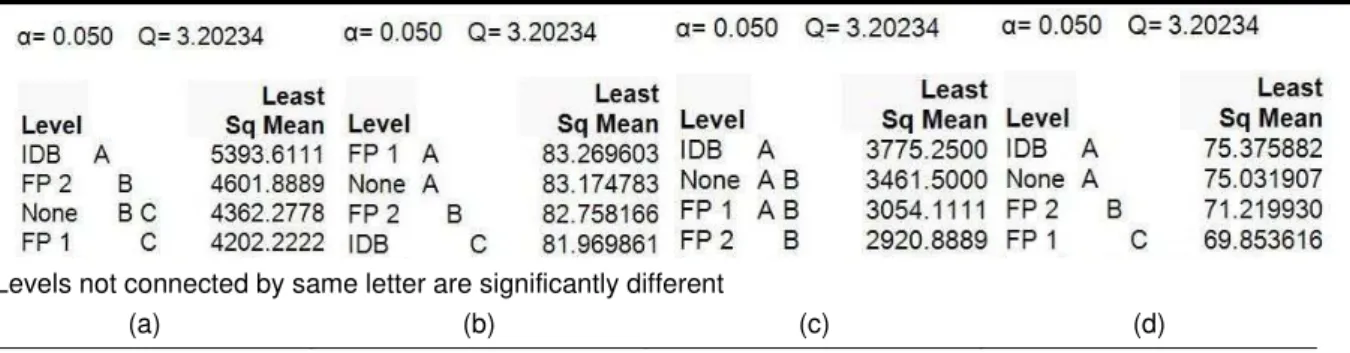
Tukey HSD comparisons show which additives exhibit significantly different material behavior. The Tukey HSD comparison for G* and phase angle results for both binders are shown in Tab. 4. The comparison of additives for G* results in Tab. 4(a) shows that IDB is statistically different from the control group (no additive), FP 1, and FP 2 according to a 95% confidence level. It is also of interest that Tab. 4(a) shows that the control group is not statistically different from both FP 1 and FP 2 for G* results. In Tab. 4(b), showing the PG 64-22 phase angle, IDB and FP 2 are statistically different from all other additives and there is no difference between FP 1 and the control group phase angle.
The Tukey HSD comparison for PG 70-22 G* and phase angle results is shown in Tab. 4(c) and 4(d). Similar to the PG 64-22, the IDB had the highest average G* but was not statistically different from all other additives. No additives are statistically different from the control group. Tab. 4(d) shows the PG 70-22 phase angle results. The IDB PG 70-22 phase angle is not different from the control group but is statistically different from that of FP 1, and FP 2 at a 95% confidence level. FP 1 and FP 2 are significantly different from each other as well as the IDB and control groups.
Complex shear modulus results indicate that IDB has the highest average resistance to permanent deformation compared to the other additives for both PG 64-22 and polymer-modified 70-22 binders. The phase angle results designate differences between each of the additives, but the rankings are not the same for the different binders. The phase angle, or time lag in material response is greatest for FP 1 for the PG 64-22 binder and lowest for IDB. The order for IDB and FP 1 is switched for the PG 70-22 binder. This suggests that there is an interaction detectable with binder tests between the additive choice and the polymer-modification.
Fig. 4: Comparison of Average G* results
Fig. 5: Comparison of Average Phase Angle results Tab. 3: ANOVA of G* and Phase Angle using SPRM Design.
Source SS MS Number DF Number F Ratio Prob > F Additive 7.54E+06 2.51E+06 3 61.48 <.0001 Temp (°C) 3.07E+08 1.54E+08 2 13763.56 <.0001 Additive*Temp (°C) 2.58E+06 4.31E+05 6 38.62 <.0001 Spec No.[Additive]&Random 3.27E+05 4.09E+04 8 3.67 0.0129 Source SS MS Number DF Number F Ratio Prob > F Additive 4.10E+06 1.37E+06 3 5.37 0.0255 Temp (°C) 1.03E+08 5.16E+07 2 1428.81 <.0001 Additive*Temp (°C) 1.97E+06 3.28E+05 6 9.10 0.0002 Spec No.[Additive]&Random 2.04E+06 2.55E+05 8 7.06 0.0005 Source SS MS Number DF Number F Ratio Prob > F Additive 9.47E+00 3.16E+00 3 118.81 <.0001 Temp (°C) 1.27E+02 6.33E+01 2 8753.00 <.0001 Additive*Temp (°C) 2.71E-01 4.51E-02 6 6.24 0.0016 Spec No.[Additive]&Random 2.12E-01 2.66E-02 8 3.67 0.0129 Source SS MS Number DF Number F Ratio Prob > F Additive 2.05E+02 6.83E+01 3 458.78 <.0001 Temp (°C) 1.09E+02 5.45E+01 2 421.29 <.0001 Additive*Temp (°C) 1.76E+01 2.93E+00 6 22.68 <.0001 Spec No.[Additive]&Random 1.19E+00 1.49E-01 8 1.15 0.3837
G* (Pa) - PG 64-22
G* (Pa) - PG 70-22
Phase Angle (°) - PG 64-22
Tab. 4: Tukey Honestly Significant Differeces comparison of additives (a) G* (Pa) for PG 64-22, (b) Phase Angle (°) for PG 64-22, (c) G* (Pa) for PG 70-22 (d) Phase Angle (°) for PG 70-22
Levels not connected by same letter are significantly different
(a) (b) (c) (d)
5 CONCLUSIONS
Test results show that WMA additive is a source of variability in the material property results for both binder and mix and should be studied carefully. IDB is a new bio-derived WMA additive currently under development. In this study, IDB was compared with two, widely used, commercially available WMA additives designated, FP 1 and FP 2. The dynamic modulus test has shown that Isosorbide Distillation Bottoms (IDB) can be used as a viable WMA additive in terms of performance when compared to the control group as well as the additives FP 1 and FP 2. Statistical comparisons of the test results were made using a SPRM experimental design. To satisfy the central limit theorem, the E* results were transformed using the square root transformation. The statistical analysis showed additives were a source of variability in E* results. The additives did not show an interaction with the polymer modified binder, indicating that the influence of the additives was similar for the PG 64-22 and the SBS-modified PG 70-22. Additive FP 1 shows statistically higher E* results than FP 2, IDB and None (the control group). This is interesting because additive FP1 and FP2 are the same commercial additive, showing that although additives are sold under the same commercial name, the version can significantly impact performance test results. Results show no difference in stiffness values between FP 2, IDB and the control group.
Binder was aged in the RTFO and tested in a DSR for all test groups. The test groups included all combinations of binder type, PG 64-22 and PG 70-22, as well as additive type: FP 1, FP 2, IDB and control group. The experimental design required SPRM for statistical analysis. The analysis was performed separately for each binder because the binders were tested at different temperatures. The statistical analysis found that for both binders tested, additives significantly influenced the G* and phase angle. Multiple comparison testing, using Tukey HSD, provided a detailed look at how the additives influence the complex modulus and phase angle. For PG 64-22, the G* results for FP 2 and None (the control group) were not found to be significantly different from one another, and the phase angle for FP 1 and None (the control group) were not found to be statistically different from one another. For PG 70-22, the control group was not statistically different from any of the additives. The PG 70-22 phase angle results showed differences between FP1 and FP2 but IDB and the control group were statistically the same.
The binder results may suggest an interaction between binder type and additive choice. This is shown by examining IDB and FP 1’s least square mean (LS
mean) phase angle results for each binder type. For the PG 64-22 binder IDB has the lowest LS mean phase angle result, while FP 1 has the highest resulting LS mean phase angle. The phase angle order switched when the PG 64-22 is polymer modified as shown in Tab. 4. Now IDB shows the highest LS mean phase, while FP 1 has the lowest LS mean phase angle result.
The newly developed, corn-derived IDB additive was successful in allowing asphalt to be compacted at a reduced temperature. All additives were added at the same dosage level. The IDB binder and mix test results were comparable to other commercially available WMA additives. Overall, there was no clear trend of one particular additive consistently producing the highest or lowest test results. Mixture testing results indicated FP 1 had the highest average E* values for the mixture but this was not reflected in all of the binder tests. The binder type played a substantial role in the material properties. Binder test results suggest an interaction between the binder type and additive.
Future research will investigate the pavement performance of the various groups using the mechanistic-empirical pavement design guide models for predicting pavement performance. This will provide insight as to how the changes in binder and mix properties will influence pavement performance. If pavements show adequate performance in the AASHTOWare Pavement ME Design, field trials will be identified.
6 ACKNOWLEDGMENTS
The authors would like to thank Bill Haman from the Iowa Energy Center (IEC) for funding this research work.
7 REFERENCES
American Association of State Highway and Transportation Officials, (AASHTO). (2011). Determining the Rheological Properties of Asphalt Binder Using a Dynamic Shear Rheometer (DSR): T 315-10, Washington, DC.
Anderson, R., Baumgardner, G., May, R., & Reinke, G. (2008). Engineering properties, emissions, and field performance of warm mix asphalt technologies NCHRP 9-47, Interim Report. Washington D.C.: National Cooperation Highway Research Program. Buss, A., Cascione, A., Williams, R.C. (2014). Evaluation of warm mix asphalt containing recycled asphalt shingles. Construction and Building Materials, 61, 1-9. doi:10.1016/j.conbuildmat.2014.02.066
Buss, A., Kuang, Y., Williams, R. C., Bausano, J., Cascione, A., & Schram, S. A. (2014). Influence of Warm Mix Asphalt Additive and Dosage Rate on Construction and Performance of Bituminous Pavements. Paper presented at the Transportation Research Board 93rd Annual Meeting.
Button, J. W., Estakhri, C., & Wimsatt, A. (2007). A synthesis of warm mix asphalt Rep. No. FHWA/TX-07/0-5597-1. College Station, TX.: Texas Transportation Institute.
Christensen, D. W., & Anderson, D. A. (1992). Interpretation of dynamic mechanical test data for paving grade asphalt cements (with discussion). Journal of the Association of Asphalt Paving Technologists, 61.
Corrigan, M. (2006). Warm mix asphalt technologies and research. Federal Highway Administration Office of Pavement Technology, 3(10), 26-28.
D'Angelo, J., et al. (2008). Warm-mix asphalt: European practice Publication FHWA-PL-08-007: FHWA, U.S. Dept. of Transportation, Washington, DC. Gandhi, T. (2008). Effects of warm asphalt additives on asphalt binder and mixture properties. Ph.D. dissertation, Clemson Univ., Clemson, SC.
Hassan, M. (2009). Life-cycle assessment of warm-mix asphalt: An environmental and economic perspective. Paper presented at the Transportation Research Board 88th Annual Meeting.
Hossain, Z., Zaman, M., O'Rear, E., & Chen, D. (2011, June 9-11). Effectiveness of Advera in Warm Mix Asphalt. Paper presented at the ASCE GeoHunan 2011.
Hurley, G. C., & Prowell, B. D. (2005a). Evaluation of Aspha-Min zeolite for use in warm mix asphalt NCAT Rep. No. 05-04. Auburn, AL.: National Center for Asphalt Technology.
Hurley, G. C., & Prowell, B. D. (2005b). Evaluation of Sasobit for use in warm mix asphalt NCAT Rep. No. 05-06. Auburn, AL.: National Center for Asphalt Technology.
Hurley, G. C., & Prowell, B. D. (2006). Evaluation of Evotherm for use in warm mix asphalt Rep. No. 06-02 (Vol. 6). Auburn, AL.: National Center for Asphalt Technology.
Jenkins, K., De Groot, J., van de Ven, M., & Molenaar, A. (1999). Half-warm foamed bitumen treatment, a new
process. Paper presented at the 7th Conference on asphalt pavements for Southern Africa (CAPSA 99). Kim, H., Lee, S., & Amirkhanian, S. (2012). Influence of Warm Mix Additives on PMA Mixture Properties. Journal of Transportation Engineering, 138(8), 991-997. doi:10.1061/(ASCE)TE.1943-5436.0000406 Koenders, B., Stoker, D., Robertus, C., Larsen, O., & Johansen, J. (2002). WAM-Foam, asphalt production at lower operating temperatures. Paper presented at the Ninth International Conference on Asphalt Pavements, Copenhagen, Denmark.
Kristjánsdóttir, Ó. (2006). Warm-mix asphalt for cold weather paving. Master’s thesis, Univ. of Washington, Seattle, WA.
Kristjánsdóttir, Ó., Muench, S. T., Michael, L., & Burke, G. (2007). Assessing potential for warm-mix asphalt technology adoption. Transp. Res. Rec., 2040, 91-99. Larsen, O., Moen, Ø., Robertus, C., & Koenders, B. (2004). WAM Foam asphalt production at lower operating temperatures as an environmental friendly alternative to HMA. Paper presented at the 3rd Eurasphalt & Eurobitume Congress.
Leng, Z., Gamez, A., & Al-Qadi, I. (2013). Mechanical Property Characterization of Warm-Mix Asphalt Prepared with Chemical Additives. Journal of Materials in Civil Engineering, 0(ja), null. doi: doi:10.1061/(ASCE)MT.1943-5533.0000810
Li, X. J., & Williams, R. C. (2012). A Practical Dynamic Modulus Testing Protocol. Journal of Testing and Evaluation, 40(1), 100-106.
Middleton, B., & Forfylow, R. W. (2009). Evaluation of warm-mix asphalt produced with the double barrel green process. Transp. Res. Rec., 2126, 19-26. Newcomb, D. (2007). An introduction to warm-mix asphalt. Retrieved August, 2, 2013.
Perkins, S. W. (2009). Synthesis of warm mix asphalt paving strategies for use in Montana highway construction Rep. No. FHWA/MT-09-009/8117-38. Helena, MT.: Western Transportation Institute.
Prowell, B. D., Hurley, G. C., & Crews, E. (2007). Field performance of warm-mix asphalt at the NCAT test track. Paper presented at the Transportation Research Board 86th Annual Meeting.
Werpy, T. A., Holladay, J. E., & White, J. F. (2004). Top Value Added Chemicals From Biomass: I. Results of Screening for Potential Candidates from Sugars and Synthesis Gas (pp. Medium: ED; Size: PDFN


![[PDF] Cours sur les Mécanismes Prolog en pdf | Formation informatique](data:image/gif;base64,R0lGODlhAQABAIAAAP///wAAACH5BAEAAAAALAAAAAABAAEAAAICRAEAOw==)