A Digital Path to Environmental Education
By Emma Bassein
Submitted to the Department of Earth, Atmospheric, and Planetary Sciences in Partial Fulfillment of the Requirements for the Degree of Bachelor of Science in Earth, Atmospheric, and Planetary Sciences at the Massachusetts Institute of Technology
May 19, 2006 C'
T
o. C., )r C 2006 Emma Bassein. All rights Reserved.The author hereby grants to M.I.T. permission to reproduce and distribute publicly paper and electronic copies of this thesis.
Author
Certified by__
Accepted by__
OF TECHNOLOGY
SEP 2 8
2017
Signature redacted
datyee
Department of Earth, Atmospheric, and Planetary Sciences
Signature redacted
Signature redacted
Kip Hodges Thesis Supervisor
Chair, Committee on Undergraduate Program The author hereby grants to MIT permission to reproduce and to distribute publicly paper ane 0O
MITLibraries
77 Massachusetts Avenue Cambridge, MA 02139 http://Iibraries.mit.edu/ask
DISCLAIMER NOTICE
Due to the condition of the original material, there are unavoidable flaws in this reproduction. We have made every effort possible to
provide you with the best copy available. Thank you.
The following pages were not included in the original document submitted to the MIT Libraries. This is the most complete copy available.
Acknowledgements
I would like to thank all of the staff at the Rookery Bay National Estuary Reserve in Naples Florida for all of their help with this project; Bob Gurnitz and his wife for their hospitality, and the donation of their time and boat in the support of this project; Peter Woods at the Palmetto Ridge High School; and all of the students who participated. I would also like to thank my advisor, Kip Hodges, for all of his time and patience throughout this process.
Table of Contents
T able of C ontents ... 3
A b stract ... 4
Introduction ... 5
B ackground ... 6
M aterials and M ethods ... 7
Results and Discussion ... 19
L ooking forw ard ... 26
C onclu sion ... 27
S ou rces ... 2 9 Appendix 1: Instructions for the Demonstration of Salinity's effect on Density ... 30
Appendix 2: Entrance and Exit Surveys ... 31
Appendix 3: Sample Code developed for ESR's ArcPad ... 32
Appendix 4: Consolidated Curriculum ... 34
Figures and Tables Figure 1: Students by Class Year ... 7
Figure 2: Student Self-Reported Levels of Fun and Learning ... 20
Table 1: Outline of Curriculum for Day One ... 9
Table 2: Outline of Curriculum for Day Two ... 12
Table 3: Scientific Instruments Used ... 13
Table 4: Outline of Curriculum for Day Three ... 15
Table 5: Outline of Curriculum for Day Four ... 16
Digital Paths to Environmental Education By
Emma Bassein Submitted to the
Department of Earth, Atmospheric, and Planetary Sciences May 19, 2006
In Partial Fulfillment of the Requirements for the Degree of Bachelor of Science in Earth, Atmospheric, and Planetary Sciences
Abstract
Digital technology has become completely engrained in the process of scientific research. Grade schools are beginning to incorporate computers and other digital devices into the learning process as tools for learning other subjects, including science. Educators have experimented with a variety of programs that incorporate computers, such as digital tutors, simulations of natural systems, and interactive simulations. This study aimed to demonstrate that handheld computers are a useful resource in problem-based learning environments. A "mini-curriculum", focused on making handheld computer-aided measurements of the key environmental parameters in marine estuaries, was designed and taught to eleven students from the Palmetto Ridge High School in Naples, Florida over a two week period. Students' reactions to both the curriculum and the computers were overwhelmingly positive. This proof-of-concept trial indicates that handheld computers have the potential to be a very useful tool in problem-based learning.
Introduction
Science is increasingly dependent on technology for data collection and analysis in the laboratory and the field, as well as for modeling complex systems. A group called Digital Tools for Field Geology (DTFG) within MIT's Earth, Atmosphere, and Planetary Science (EAPS) department has worked to develop a set of digital tools for data collection in the field intended for geology, but applicable to many other disciplines. One of the primary items used in this effort is a handheld computer (personal digital assistant, or
PDA) programmed with a georeferenced map, Global Positioning System (GPS) tracking,
and data collection forms that can interface with the widely used ArcPad Global
Information Systems (GIS) software. The advantage of this type of system is that data
collected in the field can be entered in digital form, spatially referenced, and organized so that the researcher need not waste time transcribing hand-written notes. Besides their usefulness for a trained geologist, EAPS has demonstrated that these handheld computers are useful for teaching purposes by using them as part of the department's annual undergraduate geology field camp. This thesis aims to address whether this applicability to education can be extended to the high school level in the realm of environmental science.
A pilot study was conducted with a group of eleven high school students from the
Palmetto Ridge High School in Naples, Florida, with the goal of evaluating the educational value of handheld computers for facilitating problem-based learning in environmental science classes. The study was conducted as a two-week extra curricular activity for the students using the Blackwater River estuary in the Rookery Bay National Estuary Reserve in Naples, Florida as a study site.
The accepted methods for primary and secondary education are changing from the conveyance of knowledge upon students to the facilitation of students' self-directed learning through real-world experience (Klopfer, 2004). Numerous studies have shown that students who participate in experience-based or problem-based learning, which puts their education into context, develop a deeper understanding of the material and are more capable of complex problem solving (e.g. Dehlgren, 1998; Bradley, 2004; Hudson, 2001; Bell, 2003).
At the same time, educators are embracing technology-enabled learning. Grade schools have offered classes that use computers as the subject for more than a decade, but increasingly computers are being integrated into classes as a tool for learning other subjects. This is an important and appropriate shift in the educational process because computers have become deeply engrained in virtually all professional and scientific fields. More than $60 billion has been spent on educational technology in US schools since 1991 and Congress has made grants available for purchasing technology that is shown to improve student performance (Bick, 2005). A growing number of case studies have shown that desktop, laptop, and handheld computers can be a valuable part of the learning experience (e.g. Bick, 2005; Klopfer, 2004; Yuen, 2003).
Initially, experience-based learning and technology-enabled learning seem to be mutually exclusive because the former takes students out of the classroom to interact with the real world, while the later keeps students in an artificial learning environment. However, this does not need to be the case. Up to this point educators have taken computer-based learning to an impressive level by experimenting with complex simulations that force students to interact with each other and design experiments to solve problems and puzzles (e.g. Klopfer, 2004). The next step is to use computers to facilitate
real-world problem-based learning. This pilot study demonstrates one way that this goal can be accomplished.
The goals of scientific, experience-based learning in general are: to create a personal connection with the study area, fostering a sense of stewardship; to create opportunities for learning science in a way that especially encourages non-traditional learners; and to put education into context for students, making material easier to understand and remember (Pooley, 2000; Dahlgren, 1998; Bell, 2003). Handheld computers were used in this program to facilitate an effective experience-based learning curriculum in multiple ways. They provided a source of reference material in the field, they helped students organize their notes and data during field work, and they encouraged students to take an active role in their learning.
Materials and Methods
Students enrolled in honors or advanced placement chemistry, biology, or marine science classes at the Palmetto Ridge High School in Naples, Florida, were asked to volunteer for this two-week extracurricular activity. As incentive students were offered some amount of extra credit, determined by their teacher, in their primary science class.
Figure trial.
1: The number of students per grade participating in the
Students by Class Year
5 0 4 -V P. 0 U) .0 z 0
The program was taught by an outside instructor (the author of this thesis) with the assistance of the Palmetto Ridge Marine Science teacher, Peter Woods.
In order to evaluate the effectiveness of handheld computers for enhancing a problem-based learning environment in the natural sciences, an entire problem-based curriculum was created. This was not a quantitative study due to the small number of students and the lack of a control group of students participating in the same curriculum without the computers. However it serves as anecdotal evidence for the value of integrating technology-enabled and problem-based teaching methods.
The curriculum consisted of five sessions, four of which were on conducted on campus after regular classes, and one of which was a weekend data collection field trip. The students were asked to develop a hypothesis about some aspect of the Blackwater River estuary; devise a method for testing that hypothesis; collect and analyze data; and give a presentation to the class about their findings. The classroom time was divided among lectures addressing scientific theory and procedures, independent research, and group work.
During this trial, the handheld computers were used in two lessons: one on campus that introduced the students to both the computers and the other scientific equipment, and the field day. The remainder of the curriculum addressed other areas of problem-based learning that did not involve computers. With a little more work, the handhelds or desktop computers could be incorporated into the data analysis lesson as well. In the following sections, I will discuss the experience with the curriculum as whole. Later on, I will address the role of the handheld computers on the outcome.
Materials: Copies of the entrance survey, handout on estuary mixing, and a handout with a chart of the area to be studied. A large plastic bowl with a flat bottom, two tin cans, one with both ends removed and one with only one end removed, a small beaker or Dixie cup, red food coloring, salt, and Vaseline. Students should have writing utensils and paper to take notes on.
Table 1: Outline of Curriculum
Objectives
Evaluate the baseline level of scientific knowledge and interests of the students in the class.
for Day One
Activities
Settling-down, taking attendance, entrance survey
Time 7 minutes
Students will identify why Ask students why science is 8 minutes the natural sciences are important to them and in
important to their daily general. Discuss a local lives, thereby acquiring the example of why science is necessary motivation to important (Example: in the study science. Everglades the canal system
disrupted fresh water, potentially impacting fish populations)
Students will expand their Ask students to define the 10 minutes understanding of the scientific process and write
scientific process, especially up the answers on the board. as it relates to experiments Suggest components that that do not have predefined they do not think of.
outcomes. Include:
-Search for previous literature
-Develop a hypothesis founded on sound logic -Design a methodology for testing that hypothesis -Collect relevant data -Analyze data and establish error bounds
-Suggest conclusions and further areas of study
Students will learn about the Discuss why water is 18 minutes properties of water and important to us. Discuss
dissolved substances. They two relatively simple will begin to understand parameters used to
how to predict what characterize it: salinity and chemical or biological temperature. How do these
properties of a water system will vary together.
Students will get an understanding of the area that they will be studying. They will be excited by the idea of studying the area.
Students will be prepared to create their own hypothesis for testing in the charted area.
affect density?
-Demonstration: Density of salty water (see Appendix 1)
-Mention other factors such as dissolved oxygen,
turbidity, and nutrients -Distribute hand out: estuaries
-Distribute hand out: map of study location
Ask the students to predict the variations in the
parameters discussed before by looking at the chart and thinking about fresh water
inputs, temperature, and mixing.
Discuss homework
assignment, remind students to think about the scientific process when developing their hypothesis
The first day of the curriculum was designed to introduce students to a more intensive version of the scientific process than is usually offered in a high school setting. The process of developing an original hypothesis that is based on a solid scientific background was emphasized. The first lesson was also used to introduce the key parameters for studying water in an estuary.
Before the beginning of the class, students were asked to fill out a questionnaire that addressed their general interest in science, their understanding of the local ecosystems, and their familiarity with field work (Appendix 2). This was done to facilitate the evaluation of the curriculum.
The lesson began with a short discussion of why science might be important to the students' lives. The ideas of science as a way of bettering human life, bettering our understanding of the world around us, and science for the sake of science were touched
5 minutes
upon. For an area like Florida, weather forecasting to predict hurricanes or monitoring water quality to maintain fish populations were good examples of relevant science.
The next topic was the scientific process. Developing an original hypothesis is not emphasized for many high school level, or even college level, laboratory experiments. Often the students are given a brief introduction to the experiment and are only asked to rephrase the given hypothesis in their own words (e.g., MIT 5.310 Course Notes: Laboratory Chemistry). Due of this lack of prior experience, the students were very uncomfortable with forming their own hypotheses.
The students were also asked to discuss what it means to prove or disprove a scientific theory. Once again, high school laboratory data analysis is greatly simplified and generally consists of explaining why the students' results differed from the "correct answer." Emphasizing that there is no "correct answer" to compare to in advanced science was an important point. The students were also encouraged to think about why one study is not enough to prove or disprove a hypothesis conclusively.
The discussion of the scientific process was followed by an introduction/review of the properties of water. Participating students ranged from 9th to 1 Ith grade and had a wide
range of scientific backgrounds, so the primary purpose of this section was to make sure that all of the students had an equal understanding of the parameters pertinent to the curriculum. Salinity was the primary topic for this part of the lesson. The relative densities of salt and fresh water, and the processes that could lead to an increase or decrease of salinity were presented. A description of the demonstration of the relative densities of fresh and salt water can be found in Appendix 1. Factors relating to temperature, dissolved oxygen, and water clarity were also discussed in brief.
After the lecture portion of the lesson, students were allowed to use computers in the library to begin looking for background information. They were supplied with a handout on estuaries and a map of the area that they would be working in. Their assignment for the next class period was to write up a hypothesis that they would be interested in testing.
Day 2 (one hour): Introduction to the iPAQs and development of data collection methods. Materials: iPAQs programmed with scavenger hunt; salinity and temperature measuring
devices; prizes for the scavenger hunt; all other equipment that you intend to use during the field study (e.g. Secchi disk used to determine the clarity of the water, YSI electronic meter for measuring temperature, salinity, and other parameters, phytoplankton net); extra copies of the map for students who have lost them.
Table 2: Outline of Curriculum for Day Two
Objectives Activity Time
Students should divide into Students will briefly share 12 minutes groups based upon what their hypotheses and the
their hypotheses were. reasoning behind them to the class. They will then divide into groups of 2-4 students with similar hypotheses
Students will become Give a brief introduction to 25 minutes comfortable using the the various instruments.
scientific instruments that -iPaq Scavenger Hunt scientists use to test water.
Students will think about In their research groups, ask 10 minutes what sort of data they will students to write down what
need to test their hypotheses data they think that they will and what makes a good need and mark on the map sampling strategy. where they would like to
take samples.
Students will be prepared for Discuss what students 3 minutes the weekend field day should expect during the
field trip and what they should bring
-Distribute handout: directions
The goal of the second lesson was to finalize the students' hypotheses and to introduce them to the scientific equipment that they would be working with. The students were asked to share their hypothesis and the reasoning behind it to the class. They were then separated into groups of two or three based on the similarity of their hypotheses.
The research groups were given twenty minutes to discuss their sampling plan while the instructors circulated and guided them. The students were asked to think about how they could most efficiently collect the data that they would need to test their hypothesis. For groups working primarily with physical parameters, such as temperature and salinity, they were guided to think about how the time of day and position of the tides might affect their readings. Groups working with biological parameters, such as the density of mangroves, were asked to work on how to quantify the amount of mangroves in the area, or other biological feature.
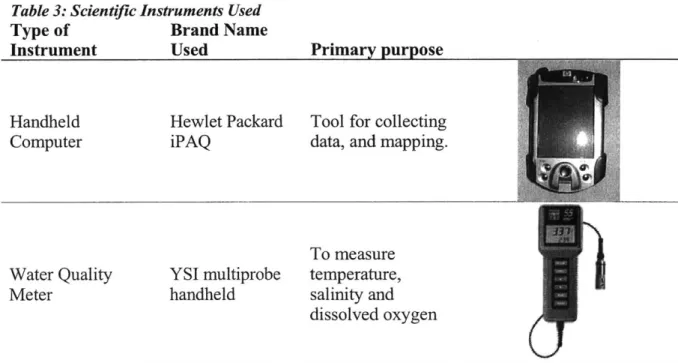
Table 3: Scientific Instruments Used
Type of Brand Name
Instrument Used Primary purpose
Handheld Hewlet Packard Tool for collecting
Computer iPAQ data, and mapping.
To measure Water Quality YSI multiprobe temperature,
Meter handheld salinity and
To measure the
Secchi disk NA depth of light
penetration into a body of water
Used to catch
Phytoplankton Net NA Usedpanto
During the second half of the class the students were introduced to the instruments that they would be using on the field day. This included a Secchi disk, a YSI meter, a phytoplankton net, and the handheld computers. The concepts behind the Secchi disk and the phytoplankton net were presented and the students were allowed to pass around the equipment. The YSI and the iPAQs were introduced through a short activity that was intended to be both fun and educational. The iPAQs were programmed with a brief scavenger hunt (Sample code available in Appendix 3) that instructed the students to go outside and measure the temperature and salinity of a pond on school grounds and then find a prize hidden in a classroom. Students did the scavenger hunt in their research groups; each group was given a brief introduction into how to use the iPAQs and input information before starting the hunt.
etc.
Day 3 (4 hours): Introduction to Rookery Bay and data collection
Materials: Motor boats and life jackets; scientific equipment (e.g. YSI's, iPAQs, Secchi disk, plankton net). Students should bring lunch, sunscreen/hat, etc.
Table 4:Outline of Curriculum
Objectives Students will feel comfortable asking
questions of their instructor and boat captain.
Students will learn to think critically about their surroundings.
Students will learn how to take accurate scientific data measurements.
Students will be prepared for the following class.
The field trip began and ended at the Colusa Island Yacht Club in Goodland, Florida, and lasted 4 hours. Students were separated into two motor boats based on their proposed project. The motor boats were privately owned, and were driven by the owners who had a good knowledge of the local waters.
One boat was equipped with the handheld YSI meter, and the other boat had a Secchi Disk and a phytoplankton net. Each boat had one iPAQ (originally one boat had two iPAQs, but one malfunctioned early into the trip and was not used) equipped with data collection software. The iPAQs also had an aerial photograph of the sampling region and a GPS so that the students could locate themselves at all times. The motor boats periodically anchored for the students to collect data and record it on the iPAQs both on the outgoing and return trips. It was occasionally necessary to redistribute the tasks among the students so that no one monopolized the equipment. It was also helpful to occasionally ask general
Time 30 minutes
for Day Three
Activity
Arriving. Divide students among the boats by what project they are doing and for a good distribution of "loud" and "quite" students. Encourage students to look around. Ask them questions related to the wild life, aquatic conditions, the effect of weather, etc.
Anchor the boats where
students want to take data
and deploy the equipment being used. Ask students to think about how they could
minimize the error in their
measurements. Collect equipment
(including iPAQs) and
discuss the goals for the rest of the unit.
15 minutes N/A
questions about the vegetation or birds that were visible to encourage students to think about their surroundings.
The iPAQs were collected at the end of the day and the instructor consolidated the data from the different iPAQs into easily readable tables that were handed out during the following session.
Day 4 (1 hour): Data analysis and discussion
Materials: A handout with the data that were collected on the field day, graph paper (or computers), handout with presentation guidelines.
Table 5:Outline of Curriculum
Objectives
Students will understand the difference between
correlation and causation,, and how to conduct an error analysis
Students will become comfortable with looking at data and deducing possible conclusions
Students will be prepared for their assignment and
understand what goes into a good scientific presentation
for Day Four
Activities
Ask students to think of things that might be
correlated but have nothing to do with each other or are not directly related. Discuss the importance of repeating scientific studies
In their research groups, students should discuss their original hypothesis, and how they can use their data to support or refute it. Students should graph or chart the relationship
between the parameters that they are interested in
Hand out presentation guidelines and discuss what they mean. The instructor
should give a sample presentation on a topic not
chosen by the students.
The goal of the fourth lesson was to help students analyze their data and think about the necessary components of a scientific presentation. The class started with a brief
Time 15 minutes
25 minutes
discussion about the difference between correlation and causation in data. The students were reminded of the first lesson where they had discussed that it might take more than one study to prove or disprove a hypothesis.
The students spent the remainder of the class in their research groups working together to analyze their data and determine how best to present it to an audience. They were given graph paper and instructed to try to use the data to either show evidence for or
against their original hypothesis.
The lesson was concluded with brief directions for the students' final presentation. They were told to include the following things in their talks: the original hypothesis, the type of data that they used and how it was collected, what their data showed, how they would improve their sampling method to get more useful data if they were going to do it again, and what types of future studies could build upon their conclusions.
Day 5 (1 hour): Group presentations and conclusions. Materials: peer review sheets, exit surveys.
Table 6:Outline of Curriculum for Day Five
Objectives Activities Time
Students will develop their Student presentations. Each 40 minutes presentation skills and their presentation should be
peer-ability to critically evaluate reviewed by the students in other scientists. the audience and the
instructor.
Students will review what Ask students what they have 3 minutes they have learned and gain a learned, discuss the basic
sense of accomplishment. principles covered.
Students' learning will be Exit Survey 7 minutes evaluated.
The final lesson consisted entirely of student presentations. The class began with a presentation by the instructor on a topic that was not chosen by any of the students. This
served two purposes: firstly it demonstrated to the students what the instructor was looking for in their own presentations, and secondly it introduced a slightly more complex way to look at some of the data. Student presentations were between 4 and 7 minutes with time for questions in between.
At the end of the lesson, students were asked to fill out a final survey to asses how interested they were in the curriculum, how much they learned from it, and how it affected their outlook on science. This survey, along with the one taken at the beginning of the program, and instructor observations from the classes, was used to evaluate the
effectiveness of the project as an education supplement.
The equipment used during the lessons might be prohibitively expensive for an instructor at a typical grade school. Some of the scientific items might be borrowed from a nature reserve research program, or replaced with less expensive alternatives such as thermometers and litmus paper. For this particular trial, the handheld computers and corresponding software were made available by the MIT Digital Tools for Geology program; the Secchi disk and phytoplankton net were owned by Palmetto Ridge High School; and the Rookery Bay National Estuary Reserve research staff provided the hand-held YSI and base maps of the study location. The time on the boats was kindly donated by MIT alumni Bob Gurnitz. Depending on the location, it might be possible to alter the sampling plan to not require a boat, such as testing in a marsh or estuary that can be navigated by foot. The handheld computers could certainly be used for other applications, such as those referenced in the background section of this paper, making their price reasonable for the educational benefit.
0 General Observations
The students as a class found the exercise to be enjoyable and educational with all but one ranking it above an eight on a scale of one to ten for fun, and above a seven on the same scale for level of learning (see Figure 2). The majority of the students reported that they would feel confident explaining the equipment that they had used to other students who had never seen it before. All students responded that they would recommend using the iPAQs in other classes.
There was a noticeable shift in the student's concept of science from the entrance survey to the exit survey. While most of students said that memorizing, reading the text, or taking tests was the most difficult part of science at the beginning, some students
responded that collecting enough data to draw a conclusion, or analyzing all the different
Student Self Reported Levels of Fun
I
Student Self Reported Levels of LearningI 0 CL )6 o 3 1- 0-1 2 3 4 5 6 7 8 9 10
'e 2: Students' responses to the questions in the exit survey asking them to rank their experience on a scale
one to ten, ten being excellent and one being terrible.
variables was the most challenging part of science in the exit survey.
During all of the activities, student's were engaged and excited about the new concepts. Students were paying attention during the lectures: none fell asleep or spent significant periods of time gazing out windows or doodling. Although they were reluctant
5 10 CLW3 4 -0 2 - - --E 1 Z 02 1 2 3 4 5 6 7 8 9 10 -Figur from
to ask or answer questions in front of the whole class, all students all students appeared to be thinking critically about the subject during one-on-one conversation.
* Specific learning objectives from each lesson
The degree to which students achieved the desired objectives for each lesson during the proof-of-concept trial was heavily dependent on the teaching style and the specific students that were participating. This being said, the following is an evaluation of how well each lesson and the program as a whole succeeded in achieving its stated goals and possible suggestions for improvements.
Lesson 1:
In the first lesson students were expected to understand the scientific process as it relates to experiments without an established answer, and to understand the basic properties of water and aqueous solutions, knowledge necessary for developing their hypotheses. The level of learning was evaluated by studying the hypotheses that the students presented in the second lesson. Although the students were very creative with their ideas, the majority of them did not have any justification for why they had chosen their hypothesis or what previous scientific work would lead to such an idea. This indicates that not enough time was spent discussing how to develop a hypothesis that is based on good background information. In future use of this curriculum, instructors should have a more structured approach to finding reference materials and perhaps provide sample hypotheses for the students.
Students were also expected to understand the basic properties of water and the geography of the study area by the end of the lesson. The concept of salinity and its affect on water density were covered in the most depth, but the assumption was made that high school students would already know the relationship between water temperature and
density. It became clear later in the program that this assumption was false, indicating that the temperature dependence of density should be discussed in the future. Also, the students commented that inadequate time was spent discussing the study area.
Lesson 2:
In the second lesson students were asked to finalize their hypotheses, discuss sampling strategies, and become familiar with the scientific equipment. The students were not comfortable with devising a sampling plan. This could be due in part to the limited amount of time spent discussing the characteristics of the study area. Because time was a limiting factor, it might have been more useful to do the sampling strategy together as a whole class with the discussion guided by the instructor. However, if time is less of an issue, students might learn more by struggling through the process and then analyzing what went was good and what could have been improved. This would be ideal in the case where the program is included in a semester long program with two sampling field trips.
The scavenger hunt was an effective way to introduce the scientific equipment. The students were intrigued by the iPAQs and asked questions about how they worked. Once again, if time were less of an issue, a longer version of the scavenger hunt could be used and students could be asked to perform some calculations with the information they get, like the mass of salt in a given volume of pond water if it is assumed to be sodium chloride, in order to further engrain the ideas about the properties of water.
The students limited their choices of hypotheses to only those that could be tested using the scientific equipment presented to them. Their ideas might have been more creative if they had been told to think outside the box and try to develop their own tools and methods for measuring parameters of interested.
The third lesson was the field day. The objectives were to gather useful data, and to spark students' interest in their local environment. Both objectives were fully achieved. The students on each of the boats collected 17 data points over a period of two and a half hours. The students were actively engaged in conversations about the scientific equipment, the iPAQs, their surroundings, and science in general. Some students were more excited than others, but a range of interest is to be expected within a group of students. Overall, everything went as well as could be hoped for.
Lesson 4:
The fourth lesson was devoted to data analysis. The students were given a brief overview of the difference between causation and correlation in scientific data.
Quantitative data analysis was not emphasized, although it was made clear that it is an important part of good science. Future trials could look at ways to incorporate this sort of analysis into the data evaluating process. Despite the lack of quantitative error
calculations, the student presentations in the final lesson clearly indicated that the students understood that their data had some error, that not all of the variation was necessarily
significant, and that one study could not prove anything definitively with limited data. The students appeared to be comfortable working with numbers and making graphs to express their findings visually.
Lesson 5:
The fifth lesson consisted of student presentations of their findings. Unfortunately, the expectations for the final presentations were not made abundantly clear, so the level of formality and quality varied greatly between student groups. Some groups prepared handouts and had clearly rehearsed their speech at least once with their group, while others were disorganized and had no visual aids. However, the majority of students made
thoughtful, informative presentation that illustrated some degree of preparation. A printed assignment with the presentation expectations, as well as having the instructor present his/her topic during the preceding class, would have most likely lead to a substantial improvement in the lower segment of the class.
Evaluation by the Instructor
The section evaluates what the proposed curriculum demands of the instructor in terms of time, training, and cost. Like any program requiring time off of campus, this curriculum poses certain logistical problems. The distance of the study area from campus, whether the program is being conducted as an in class or extracurricular activity, and the nature of the study area will greatly influence how feasible the field trip will be.
During the trial run in Naples, FL, the study area was over an hour from campus and required the use of boats to collect samples. However, because it was conducted as an after-school activity, students were allowed to drive themselves or be dropped off by a parent. Of course having students arrive on their own creates separate problems, such as getting lost or being late. Teachers who have conducted any sort of field trip should be familiar with these considerations, so I will not spend any more time on it here.
The value of experiential learning has been well document (e.g. Dahlgren et al., 1998); the new component of this curriculum is the use of a computer related tool (the iPAQs) as a supplement to the experience. Student responses indicated that the iPAQs did enhance their learning during the field day. However, it is important to evaluate whether the increase in learning is proportional to the extra effort required by the instructor.
For this particular application the iPAQs need to be equipped with ArcPad software from ESRI. Additionally, they need to be programmed using a simplified version of Visual Basic within the ArcPad application builder, also from ESRI, that must be installed on a
normal computer along with the rest of the ArcGIS suite. Programming the iPAQs for the specific project can be time consuming and frustrating. Ideally teachers would be able to use a pre-programmed version, but this limits the flexibility of the iPaq as a tool.
Besides programming, the iPAQs have other drawbacks. They have a relatively small processor that is slow when loading a large amount of data, such as a base map of the study site. This can be frustrating to students, who might then begin to press buttons randomly. Because the iPAQs are not exceptionally robust, pressing buttons often results in a fatal error to the program, requiring it to be restarted or making it useless until the software can be reloaded. The prospect of working with such a finicky tool would be a deterrent for busy teachers.
Another fundamental problem is the lack of computer facilities that would allow students to manipulate their data electronically. This means that the instructor must compile the data and physically hand it out to the students. This not only creates more work for the teacher, but also eliminates some of the inherent power of the iPAQs as tools.
One of the primary benefits of using iPAQs in actual field studies is that the data are already in a useful form as soon as they are collected, which justifies the minor annoyances of using an iPaq versus just using paper and a pencil. In this exercise, the students are asked to collect data electronically, and then analyze it by hand, therefore greatly reducing the practicality of using the iPAQs.
The benefit of the handhelds for the instructor are that students remain engaged in what they are doing; motivated students can search out additional challenges on their own by exploring how the program works and taking additional data, giving the teacher more time to work with students who are struggling; and the data and notes collected during the day are well-organized and legible because they are in an electronic form.
MITLibraries
77 Massachusetts Avenue Cambridge, MA 02139 http://Iibraries.mit.edu/askDISCLAIMER NOTICE
MISSING PAGE(S)25
monitoring capability so that teachers can asses how well students were working without constant surveillance.
Another educational application could be interactive homework or self-guided field trips. For example, students could each receive an iPaq programmed with a tutorial on how to complete an assignment and then be asked to visit a certain location and take specified measurements and analyze them. Similarly, if organizing a field trip during school hours is too difficult, students could be asked to do the field trip on their own but still receive the benefit of an "instructor" through using the iPAQs, rather like a museum offers audio tours. In both scenarios, the handhelds could be programmed to monitor the amount of time a student spends on a given activity and have a place for students to save questions and comments. These features would allow teachers to give individualized feedback depending on the student's level of understanding.
Conclusions
The students had a very positive overall reaction to both the experiential learning and the use of the iPAQs as educational tools. However, from an instructor's perspective, the iPAQs are extremely challenging to work with in their current form. They require a teacher to learn new skills and invest a significant amount of time, something that most teachers don't have. Unfortunately, because the systems are not robust, it would be impossible to give teachers pre-programmed devices without further training on troubleshooting and programming.
This proof-of-concept trial demonstrated that computerized learning aids for scientific and experiential learning have substantial potential to increase the interest level of students. However, the iPAQs in their current form are a not feasible option unless an
outside expert is brought in to lead the curriculum, as was the case in the trial. If a more robust platform for the software was developed that required less teacher training and more predictable operational functionality, the nature of science education could be impacted
Sources
Bell W.H., Fowler E.M., Stein J.A. (2003) Coastal Seas as a Context for Science Teaching: A Lesson From Chesapeake Bay. Marine Pollution Bulletin 47, 253-259.
Bick A. (2005) Academic Achievement Enhanced by Personal Digital Assistant Use. Milburn High School, Milburn NJ.
Bradley M.P., Hanson R., Walbeck E.S. (2004) Innovative Environmental Education Contributes to Improved Management Practices in the Mid-Atlantic Region of the United States. Environmental Monitoring and Assessment 94, 205-215.
Broussard S.R., Jones S.B., Nielsen L.A., Flanagan C.A. (2001) Forest Stewardship Education: Fostering Positive Attitudes in Urban Youth. Journal ofForestry 99(1), 37-42. Dahlgren M.A., Castensson R., and Dehlgren L.O. (1998) PBL from the Teachers' Perspective. Higher Education 36, 437-448.
Hudson S.J. (2001) Challenges for Environmental Education Issues and Ideas for the 21s' Century. BioScience 51(4), 283-288.
Jahan K., Everett J.W., Hesketh R.P., Jansson P.M., Hollar K. (2004) Environmental Education for All Engineers. Water Science and Technology 49(8), 19-25.
Klopfer E., Yoon S., and Rivas L. (2004) Comparative Analysis of Palm and Wearable Computers for Participatory Simulations. Journal of Computer Assisted Learning 20,
347-359.
Legualt L., Pelletier L.G. (2000) Impact of an Environmental Education Program on Students' and Parents' Attitudes, Motivation, and Behaviors. Canadian Journal of Behavioural Science 32(4), 243-250.
Pooley J. and O'Conner M. (2000) Environmental Education and Attitudes. Environment and Behavior 32(5), 711-723.
Simmons B. (2000) Towards Excellence in Environmental Education: A View from the United States. Water, Air, and Soil Pollution 123, 517-524.
Yuen S. and Yuen P. (2003) PDA's as Educational Power Tools. Tech Directions 62(9), 14-20.
Appendix 1: Instructions for the Demonstration of Salinity's Effect on Density Introduction to Salinity and Density Demonstration
Purpose: To give students a visual demonstration of the importance of salinity on water density.
Saltwater is denser than freshwater. If this experiment works correctly, the end result should be a clearly defined layer of colored saltwater below a layer of clear freshwater. Materials:
" One large, clear bowl. Ideally the bowl should have a wide, flat bottom, with vertical sides.
* Two tin cans. One should have both ends removed, the other should have only one end removed
" Food coloring
" Large quantity of salt " Vaseline
* beaker or paper cup small enough to fit inside the tin cans. Turkey baster is helpful Preparation:
" Fill the large, clear bowl with tap water and set it where the demonstration will take place. Ideally the water should be completely still when doing the experiment, so try to set it up at least half an hour before class.
" Fill the tin can with the bottom still on with water. Add a large amount of salt (until saturation, or use your best judgment). Add a substantial amount of dark colored food coloring such as red or green. Set aside.
" Take the tin can with both ends removed and put a generous amount of Vaseline around one rim. Put the can in the middle of the bowl filled with water and press down to create a water tight seal between the bowl and the can. Use the beaker, cup, and/or turkey baster to empty out the middle of the can.
Demonstration:
" Explain to students that saltwater will be placed in the can in the middle of the bowl, and then that the can will be removed, allowing the salty and fresh water to mix freely. Ask them to predict what the final solution will look like.
" Remove any excess freshwater that might have leaked into the center can. Pour the colored saltwater into the can in the center of the bowl.
" Slowly remove the can by lifting straight up. Allow the water to settle. * Let students observe and discuss the results.
Appendix 2: Entrance and Exit Surveys Entrance survey
1) Grade level 2) Gender
3) Have you ever done field work before? If so, what sort of data did you collect? 4) Are you interested in doing science after high school?
5) What is a native species? Can you name two species that are native to Naples? 6) What is an invasive species? Can you think of any invasive species in Naples? 7) How many hours per week do you use computers? How many hours per week do
you play video games?
8) Have you been to the Rookery Bay National Estuary Reserve before? 9) Can you describe why the canal system used to drain the Everglades was a
problem?
10) What is the most challenging part of science for you? Exit Survey
1) On a scale from 1-10, how much fun was this exercise (1 = no fun at all, 10 = the best thing I have ever done in school)? Please Comment.
2) On a scale from 1-10, how much did you learn from this program (1 = I learned nothing, 10 = I feel like a learned a lot)? Please Comment.
3) Would you consider being a scientist?
4) What do you think the hardest part about science is? 5) Would you recommend using iPAQs in other classes?
6) Do you think that you could explain to another student how to use the equipment that we used?
7) What was the best part/most exciting discovery of this project?
Appendix 3: Sample code developed for ESRI's ArcPad
Dim whichpage whichpage = 0
Dim Sourcel Dim Source2
'MaPath = "C: \Documen ts and Settings\Emma \Mg Documents\urop
stufF\Thesis\Florida Back up\" MapPath = "My Documents\Hunt\"
Sub Start
Application.Map.AddLayerFromFile Mappath & "Hunt shapefile.shp" Applet.Forms ("Formi") .show
Applet.Forms ("Formi") .show Applet.Forms ("Formi") .show End Sub
Sub Loadcorrectly
If whichpage = 0 Then
Applet.Forms ("Formi") .Pages ("Pagel") .Activate End If
If whichpage = 1 Then
Applet.Forms ("Formi") .Pages ("Page2") .Activate End If
If whichpage = 2 Then
Applet.Forms ("Formi") .Pages ("Page3") .Activate End If
whichpage = whichpage + 1
End Sub
Sub Nextstep
Set Layer = Application.Map.Layers ("hunt shapefile.shp") .Records
Application. Map. Layers ("hunt shapef ile. shp") . Editable = True
If whichpage = 1 Then Set Sourcel =
Applet. Forms ("Formi") .Pages ("Pagel") .Controls ("sourcel")
If Sourcel = "" Then
Applet. Forms ('"form1") .close
msgbox "You did not enter an animal, try again" Else
'Applet. Forms ("Forml ") .close
End If
Applet.Forms("?ormi") .sow
End If
If whichpage = 2 Then
Set Layer = Application.Map.Layers ("huntShapeFile.shp") .Records
Application.Map.Layers ("huntShapeFile. shp") . Editable = True Set Location = Application.CreateAppObject ("Point")
Location.X = 1
Location.Y = 1
Set Layer.Fields.Shape = Location
'Larer.Fields("Sou rceJ").Vaiue Sourcei.value
Layer.Fields ("Temp") .Value =
Applet. Forms (1"Form1") . Pages (1"Page2") .Controls (1"tempbox")
Layer.Fields ("Salinity").Value =
Applet.Forms ("Forml") .Pages ("Page2") .Controls ("Salbox") Layer.Fields ("DateTaken").Value = Date
Layer.update
IApp 7 e t. Fom s ("Form 1"). show End If
'Whichpage = whi chpage + 1 If whichpage = 3 Then
msgbox "You're done, go back to the classroom" whichpage = 0
End If
End Sub
Sub FillPicture
Applet.Forms ("Formi") .Pages ("Page3") .Controls ("ImageBox") .Value = "My
Documents\Hunt\labsink.jpg"
Appendix 4: Consolidated Curriculum Lesson Plan
Learning Standards: This unit could be used with a high school level biology, chemistry, earth or related science course. The lesson ideally addresses all of the Scientific Inquiry
Skills (SIS) Standards outlined in the Massachusetts Science and Technology/Engineering High School Standards, as well as standards from many other states. The two week option could be used as an after school supplemental program or a post AP test project, while the semester long program could be used as an integral part of a science class curriculum. Goals: Students should recognize the complexity and interconnectedness of the ecology of their local area and understand the scientific process needed to study it. Students should become familiar with scientific instruments and understand the concept of evaluating scientific error when there is no accepted answer for a given problem.
Background Knowledge: Students should have at least one semester background of a laboratory science. They should have a familiarity with the scientific process, and ideally some knowledge of the physical properties of water and/or an understanding of the requirements for living things, such as nutrients.
Two Week Option:
Day 1 (one hour): Introduction to the scientific process and properties of water
Materials: Copies of the entrance survey, handout on estuary mixing, and a handout with a chart of the area to be studied. A large plastic bowl with a flat bottom, two tin cans, one with both ends removed and one with only one end removed, a small beaker or Dixie cup, red food coloring, salt, and Vaseline. Students should have writing utensils and paper to take notes on.
Outline of Curriculum for Day One
Objectives Activities Time
of scientific knowledge and interests of the students in the class.
attendance, entrance survey
Students will identify why Ask students why science is 8 minutes the natural sciences are important to them and in
important to their daily general. Discuss a local lives, thereby acquiring the example of why science is necessary motivation to important (Example: in the study science. Everglades the canal system
disrupted fresh water, potentially impacting fish populations)
Students will expand their Ask students to define the 10 minutes understanding of the scientific process and write
scientific process, especially up the answers on the board. as it relates to experiments Suggest components that that do not have predefined they do not think of.
outcomes. Include:
-Search for previous literature
-Develop a hypothesis founded on sound logic -Design a methodology for testing that hypothesis -Collect relevant data -Analyze data and establish error bounds
-Suggest conclusions and further areas of study
Students will learn about the Discuss why water is 18 minutes properties of water and important to us. Discuss
dissolved substances. They two relatively simple will begin to understand parameters used to
how to predict what characterize it: salinity and chemical or biological temperature. How do these properties of a water system affect density?
will vary together. -Demonstration: Density of salty water (see Appendix 1)
-Mention other factors such as dissolved oxygen, turbidity, and nutrients -Distribute hand out: estuaries
Students will get an -Distribute hand out: map of 5 minutes understanding of the area study location
that they will be studying. Ask the students to predict They will be excited by the the variations in the
idea of studying the area.
Students will be prepared to create their own hypothesis for testing in the charted area.
parameters discussed before by looking at the chart and thinking about fresh water inputs, temperature, and mixing.
Discuss homework
assignment, remind students to think about the scientific process when developing their hypothesis
Day 2 (one hour): Introduction to the iPAQs and development of data collection methods. Materials: iPAQs programmed with scavenger hunt; salinity and temperature measuring devices; prizes for the scavenger hunt; all other equipment that you intend to use during the field study (e.g. Secchi disk used to determine the clarity of the water, YSI electronic meter for measuring temperature, salinity, and other parameters, phytoplankton net); extra copies of the map for students who have lost them.
Outline of Curriculum for Day
Objectives
Students should divide into groups based upon what their hypotheses were.
Two
Activity
Students will briefly share their hypotheses and the reasoning behind them to the class. They will then divide
into groups of 2-4 students with similar hypotheses
Time 12 minutes
Students will become Give a brief introduction to 25 minutes comfortable using the the various instruments.
scientific instruments that -iPaq Scavenger Hunt scientists use to test water.
Students will think about In their research groups, ask 10 minutes what sort of data they will students to write down what
need to test their hypotheses data they think that they will and what makes a good need and mark on the map sampling strategy. where they would like to
take samples.
Students will be prepared for Discuss what students 3 minutes the weekend field day should expect during the
field trip and what they should bring
-Distribute handout: directions
Day 3 (4 hours): Introduction to Rookery Bay and data collection
Materials: Motor boats and life jackets; scientific equipment (e.g. YSI's, iPAQs, Secchi disk, plankton net). Students should bring lunch, sunscreen/hat, etc.
Outline of Curriculum for Day Three
Objectives Activity
Students will feel Arriving. Divide students comfortable asking among the boats by what questions of their instructor project they are doing and and boat captain. for a good distribution of
"loud" and "quite" students. Students will learn to think Encourage students to look critically about their around. Ask them questions surroundings. related to the wild life,
aquatic conditions, the effect of weather, etc.
Students will learn how to Anchor the boats where take accurate scientific data students want to take data measurements. and deploy the equipment
being used. Ask students to think about how they could minimize the error in their measurements.
Students will be prepared for Collect equipment the following class. (including iPAQs) and
discuss the goals for the rest of the unit. Time 30 minutes N/A N/A 15 minutes
Day 4 (1 hour): Data analysis and discussion
Materials: A handout with the data that were collected on the field day, graph paper (or computers), handout with presentation guidelines.
Outline of Curriculum for Day I
Objectives
Students will understand the difference between
correlation and causation, and how to conduct an error analysis
Activities
Ask students to think of things that might be
correlated but have nothing to do with each other or are not directly related. Discuss the importance of repeating scientific studies
Time 15 minutes
MITLibraries
77 Massachusetts Avenue Cambridge, MA 02139 http://Iibraries.mit.edu/askDISCLAIMER NOTICE
MISSING PAGE(S)37-39
MITLibraries
77 Massachusetts Avenue Cambridge, MA 02139 http://Iibraries.mit.edu/askDISCLAIMER NOTICE
MISSING PAGE(S)38
MITLibraries
77 Massachusetts Avenue Cambridge, MA 02139 http://Iibraries.mit.edu/askDISCLAIMER NOTICE
MISSING PAGE(S)39
everything that a typical research paper would have, including the initial motivation and hypothesis, materials and methods, results, discussion, and conclusions.
Ideally this program could be run for multiple consecutive years so that program alumni could act as teaching assistants for following classes. This would also have the added benefit of providing an archive of final reports and data for new students to build off of. This curriculum could also be idea for Advanced Placement (AP) science classes as a final project after the AP test in the spring term.