Educational Fusion: A Distributed Visual
Environment for Teaching Algorithms
by
Aaron T. T. Boyd
Submitted to the Department of Electrical Engineering and
Computer Science in Partial Fulfillment of the Requirements
for the Degrees of
BACHELOR OF SCIENCE IN COMPUTER SCIENCE AND ENGINEERING AND
MASTER OF ENGINEERING IN ELECTRICAL ENGINEERING AND COMPUTER SCIENCE AT THE
MASSACHUSETTS INSTITUTE OF TECHNOLOGY MAS ACHUSE
June 4, 1999
@ Copyright 1999. Aaron T. Boyd. All rights reserved.
The author hereby grants to M.I.T. permission to reproduce and distribute publicly paper and elecroni c es of thi thesis and to grant others the right to do so.
Author
Dejartment of Electrical Engineering and Computer Science May 28, 1999
Certified by_
Seth Teller Assocate Professor of Computer Science and Engineering Thesis Supervisor
Arthur C. Smith Chairman, Department Committee on Graduate Theses
Educational Fusion: A Distributed Visual
Environment for Teaching Algorithms
by
Aaron T. T. Boyd
Submitted to the
Department of Electrical Engineering and Computer Science on
June 4, 1999
In partial fulfillment of the requirements for the degrees of
Bachelor of Science in Computer Science and Engineering and Master of Engineering in Electrical Engineering and Computer Science
Abstract
Educational Fusion is a Web based learning environment for teaching algorithmic concepts. Teachers and Students access Fusion from any computer with a JavaTM enable browser. Once logged in to the system, teachers and students alike are presented with a Concept Graph: a collection of modules, each representing an algorithm, that are
interconnected to express a collective algorithmic concept. Students are challenged to complete the Concept Graph by implementing a chosen set of the modules. Each module
provides a simulation environment that depicts the given algorithm, allowing students to visually test their implementations. Teachers use the same tools to monitor and evaluate the student's efforts. An extensive collaboration system allows for continuous communication between the educators and pupils, sharing of results, and automation of
teacher feedback.
The goal of Educational Fusion is to aid teachers, students, and lesson developers in the
educational process of teaching algorithms. Through Fusion's online collaborative
environment, teachers and students become more accessible to each other. A server side repository frees both teacher and student from the tedious responsibility of cataloguing
assignments. This accessibility and organization, combined with automated feedback tools, allows for a seamless interaction between students and teachers that helps overcome the obstacles of physical location and agenda coordination. The student's learning process is also enhanced through visualizations and automations that replace programming grunge work common to more traditional methods of teaching algorithmic concepts. Lesson developers benefit from modular lessons that lend themselves to
selective reuse. Furthermore, toolkits for producing these modules expedites initial development efforts.
Acknowledgments
First and foremost, I would like to thank Professor Seth Teller for the many opportunities he has provided me throughout my work with the Educational Fusion team. Thank you for the many conversations that fostered both critical thinking and real enthusiasm. Thank you also for your trust and patience that allowed me to take on and learn through responsibilities very new to me.
Thanks also to the other members of The Team. Thanks, Nick Tornow, for mentoring me and introducing me to the project. Thanks, Charlie Kilpatrick, for showing me just how much one can accomplish in only one day. Thanks, Bhuvana Kulkarni, for not letting my "absent mind" get the best of me, and for keeping an eye on what is practical. Thanks
Kevin Kennedy, for all your work, for making late nights enjoyable, and for your constant support. Thanks, Randy Graebner, for your persistence and reliability.
Of course, I must also thank the foundation of my life, my family. Thank you, Mom, for
buying me my first computer when I was still a toddler, for always being there, and for reminding me that everything doesn't come easy. Thank you, Dad, for always being able to make me relax, and for reminding me that everything does come easy. Thank you, Brother, for always helping out your little bro, and for somehow never being surprised when he needs help. Thank you, Sister, for the chats and for encouraging me.
Table of Contents
A bstract ... 2 A N ew Place to L earn ... 5 1.1 Motivation...6 1.1.1 Educator-Student Perspective ... 7 1.1.1.1 Administration ... 7 1.1.1.2 Collaboration... 9 1.1.2 Developer Perspective... 121.2 Outline of this Document ... 13
R elated W ork ... 14
2.1 Software Visualization ... 14
2.1.1 Program Visualization Systems ... 15
2.1.2 Algorithm Anim ation Systems... 17
2.2 Shared W orkspaces ... 20
System T our ... 22
3.1 Entering eduFuse...22
3.2 New Guests ... 23
3.3 Account Administration...23
3.4 The Concept Graph ... 24
3.5 Visualization Panels...26
3.6 Integrated Development Environment ... 30
3.7 Collaboration Facilities ... 32
3.8 Administrative Facilities ... 34
C lient-Server Foundation ... 35
4.1 Com munications ... 35
4.2 Routing... 36
4.3 Persistent File Storage... 37
Program Visualization in eduFuse: An Extended Data Flow Model...39
5.1 M odeling Iteration... 39
5.2 M odeling Recursion...41
5.3 Visual Ambiguities of a M odule ... 42
Algorithm Visualization in eduFuse: The Visualization Panel ... 44
6.1 Algorithm Connection Technique... 44
6.2 Incorporating Interesting Events ... 45
6.3 M anual M ode Issues ... 46
6.4 User M ode Issues...46
C ontextual C ollaboration... 48
7.1 Issues with Shared Events...48
7.2 Using Swing...49
L esson D evelopm ent ... 50
8.1 Building M odules...51
8.2 Building Visualization Panels ... 51
8.3 Lesson Development in Practice... 52
Conclusions and Future Direction ... 54
9.1 Adm inistration ... 54
9.2 Collaboration...54
9.3 Visualization ... 55
9.4 Lesson Development...55
Chapter 1
A New Place to Learn
Educational Fusion, hereafter referred to as eduFuse, is a Web-based online laboratory
for the delivery of lessons in algorithms. eduFuse can be accessed from any computer
with a JavaTM enabled Web browser. Once a student or educator has accessed
Educational Fusion, s/he enters an online environment where continuous collaboration is
possible in the shared context of an interactive research and implementation environment.
Students are presented with a Concept Graph (CG), a high level modular depiction of the
concept at hand. Each module abstracts a specific algorithm, and the interconnection of
modules functions as a visual program. Instead of being faced with a large, obscure body
of code and asked to fill in certain blanks, in eduFuse, students examine a large scale idea
through a graphic visualization and then implement specific parts of the picture. When
implementing a module, students are given a coding environment that automates
compilation, as well as a simulation environment that visually describes the correct
implementation and automates testing of their own implementation.
Teaching staff examine the same CGs viewed by students. To faculty, a CG is an
environment that allows for convenient navigation between different students' work. A
teacher can select a module on a given CG, and instantly bring up any user's code. The
This streamlined evaluation coupled with automated grading forms makes it easy for
faculty to produce well directed feedback.
Lesson developers use a toolkit to build modules and simulations for those modules. A
complete lesson is constructed by planning, laying out, and connecting a group of
modules in a CG. Reuse is supported by this modular design, and even an entire CG can
be abstracted away into a "module abstraction" and then integrated into another CG.
Throughout the past year, the author's work has been involved with nearly every aspect
of the eduFuse system. As my thesis efforts progressed, I began focussing on better
defining and implementing the Software Visualization, contextual collaboration, and
content development facilities of eduFuse. This thesis presents an overview of the entire
eduFuse platform, with special attention given to these three areas.
1.1 Motivation
The goal of Educational Fusion is to take advantage of today's electronic infrastructure to
enhance and optimize the educational process. Rapidly evolving multimedia and internet
technologies that comprise the web present means of enriching course materials and the
"distance learning" experience.
Users of the eduFuse environment can be categorized into three roles: student, educator, and lesson developer. We do not exclude the possibility of an individual assuming more
than one of these primary roles. In developing motivational guidelines for eduFuse
development, it has been helpful to consider the learning process from these perspectives:
1.1.1 Educator-Student Perspective
Comprehending algorithms is a challenging aspect of computer science education.
Learning by doing is central to developing a concrete understanding of this abstract
subject matter. In traditional pedagogy, educators request that students supplied with
textual and perhaps pictorial resources implement specific algorithms. Students then
begin an iterative process of learning, implementing, and testing until acceptable results
are obtained. Completed assignments are submitted to educators for review, and
eventually returned to students, hopefully with helpful comments. The eduFuse team
seeks to leverage internet and multimedia technologies to enhance key elements of this
learning process. Our efforts are focussed on improving three primary elements of a
complete education in algorithms: administration, collaboration, and visualization.
1.. 1.1 Administration
Students' and educators' interactions are governed by administrative structure.
Successful administration optimizes and conceals tasks that are incidental yet necessary
to the learning process. Ideal administration is transparent: it facilitates a goal so well
that the path to the goal goes unnoticed. Computer driven organization schemes and the
web suggest new paradigms for administration. eduFuse seeks to optimize and conceal
academic pragmatics, thereby allowing teaching staff and students to concentrate on
educational content.
For students, demonstrating comprehension of algorithms usually involves several
pragmatic responsibilities. To code an algorithm, students are frequently required to
to using a specific unfamiliar IDE, resulting in a major time commitment. Students also
must devise means for testing their algorithms. This can be especially time consuming
when algorithm input and outputs are of a complex or even graphical nature, requiring
yet more familiarity with the specific development platform [NT98]. Other
responsibilities incumbent of a student often include managing files, preparing and
handing in printouts of assignments, and filing away past homework. All of the
aforementioned efforts may be well matched for Software Engineering courses, which
stress the application side of computer science, but they are extraneous to learning
algorithm theory.
Of course, the corollary to these student responsibilities is a myriad of clerical tasks for
educators. Homework assignments must be carefully planned and clearly delivered.
Coursework that includes programming requires that an appropriate IDE is made
available and documentation is provided. Every implemented algorithm that is turned in
must be tested, graded, and returned with relevant comments. Finally, teachers must
keep a portfolio of each student's progress for later reference and evaluation.
eduFuse will provide the infrastructure for more convenient implementation and
management of coursework. Why should students continue to be restricted by single
platform IDEs when web based applications suggest the possibility for easily accessible,
platform independent IDEs? Why should students and educators continue to exchange
hard copies of assignments by hand when electronic content can be effortlessly relayed
over the internet? eduFuse will deliver a simple and well-focused platform-independent
IDE that is seamlessly integrated with test suites for verifying algorithms, and with
central location. Giving educators access to the same test suites that students use to
examine their algorithms will provide simplified evaluation in a context familiar to the
students. Finally, auto-generated feedback forms associated with each assignment
expedite evaluative communication to students.
1.1.1.2 Collaboration
Collaboration between educators and students is clearly an essential element of a
complete education. Unfortunately, scheduling difficulties and disparity of physical
locations inhibit the opportunities for teaching staff and students to meet. Distributed
computing technologies, while not able to replace the value of face to face interaction,
raise the potential for teachers and students to work collectively across distances.
eduFuse seeks to provide an online environment that feels more like a unified laboratory
than a multitude of disjoint work spaces. Obviously, a means for real-time question and
answer sessions is essential. The value of messaging is greatly enhanced when it exists in
conjunction with inherent context. When individuals communicate while immersed in
the same visual' experience, one can use words sparingly and still be very expressive.
Users connected to eduFuse should be able to communicate while sharing visual context.
1.1.1.3 Visualization
The nuances of algorithmic processes are often difficult to identify and decipher from
textual explanations and pseudo code. Intuition tells us that visual aids should help us
make the jump to our own mental visualization of an algorithm's operation.
The same could be said for experiences relating to one or more of the other four senses. The visual experience is the most applicable to eduFuse.
To understand something is called "seeing" it. We try to make our ideas "clear," to bring them into "focus," to arrange our thoughts. The ubiquity of visual metaphors in describing cognitive processes hints at a nexus of relationships between what we see and what we think. [Car+99]
Related work suggests, and we believe, that well constructed graphical visualizations
help explicate important details of algorithms. eduFuse should supply comprehensive
visualization facilities that bring to life each algorithm being examined.
It seems obvious that animations should help to explain the process of algorithms. After
all, algorithm animations offer a concrete representation of an otherwise abstract process.
Educators have generally shared this hypothesis, leading to the creation of a number of
instructional animation tools over the past decade. However, empirical research hoping
to confirm the benefits of algorithm animations has returned disappointing results. In a
study conducted with computer science graduates in 1993, researcher's found that
students who had been supplied with algorithm animations performed nearly the same on
a posttest as students who had used more typical learning resources [Sta+93]. A variety
of other experiments arrived at similar conclusions [Pan+96] [Keh+99].
Gradually, educators have begun to realize that a number of factors must be considered to
ensure effective use of algorithm animations [Keh+99][Pan+96]. Animations present an
expert's interpretation of an algorithm. Therefore, an educator can not expect a novice to
examine an algorithm animation and grasp, without any additional guidance, the
important details of the algorithm. In the conclusion of [Sta+93], the researchers suggest:
[An algorithm animation] is a mapping from the abstract computational algorithm domain to the animated computer graphics domain. For a
student to benefit from the animation, the student must understand both this mapping and the underlying algorithm upon which the mapping is based.
Subsequent studies have shown more promising results [Keh+99] [Sta+94]. In these
studies, students were supplied with questions derived to guide their interactions with
algorithm animation tolls. The result: students who used animations preformed markedly
better on questions concerning the algorithm's process.
eduFuse seeks to provide a learning environment which forces students to actively
interact with algorithm animations. More specifically, eduFuse lessons require students
to interact with animation tools in a way that highlights the primary operations and yields
insight to the mapping between those operations and the underlying algorithm.
Another challenge in learning algorithms is grasping a high level understanding of
composite algorithms composed of several sub-algorithms. For example, a computer
graphics course generally includes assignments that involve large-scale algorithms such
as rendering pipelines. Requiring students to completely implement these pipelines is as
much a lesson in the Software Engineering task of implementing large programs as it is a
lesson in graphics algorithms. At the same time, implementation is considered the most
efficient means of testing a student's understanding of this elaborate material. A common
compromise is "fill in the blanks" assignments, where students are asked to complete the
primary components of a larger body of code. Unfortunately, an understanding of how
these components fit together may elude the student even upon finishing such an
assignment. Comprehension of the interconnection of the underlying sub-algorithms is
difficult to obtain from the lengthy body of code presented to the student. We believe
EduFuse should provide graphic visualizations that effectively describe the overall
structure of lengthy algorithmic processes [NB97][JN94]. Integrating such high level
visualizations with "fill in the blanks" assignments will direct students attention to the
primary pieces of an algorithm while providing an understanding of how the pieces fit
together.
1.1.2 Developer Perspective
The goal of the lesson developer is to provide excellent content in minimal time. Lesson
developers are certainly familiar with reuse to achieve this goal. Each semester's new
lesson is generally a collection of the best, tried and true material from the year's past,
along with any new additions that will further enhance the student experience.
The more material a developer has access too, the more refined and complete the
resulting lesson will likely become. The web should drastically ramp up the range and
volume of lesson aids that are available to lesson creators. Unfortunately, we cannot
necessarily make this assumption for electronic teaching aids. Often, electronic lesson
tools are based upon proprietary computing environments that severely limit the use of
courseware at outside locations.
eduFuse seeks to foster the sharing, reuse, and improvement of lesson materials. The
eduFuse environment itself is platform independent and easily portable, so it is logical
that we should provide eduFuse content with the same advantages. Lessons developed
with eduFuse at one location should have the potential to be easily integrated with
eduFuse will also provide a simple development kit that automates, to whatever extent
possible, the creation of new content. Being an experienced software engineer should not
be a prerequisite for developing eduFuse lessons.
1.2 Outline of this Document
Now that the reader has an understanding of the motivation that drives the eduFuse
project, the chief technical issues that constrain its development will be introduced. The
next chapter describes several other projects that are centered around technologies
directly related to eduFuse.
Chapter 3 provides a tour of the system, painting a picture of the overall environment.
Chapter 4 describes the client-server technology that is the foundation for this
environment. The next 4 chapters expand upon four elements of the system that are
considered critical to eduFuse. Chapter 5 lays out the descriptive power of the Concept Graph, a tool used to describe high-level algorithmic processes. Chapter 6 examines the
algorithm visualization subsystem used to describe and verify low level algorithm
implementations. Chapter 7 describes the ever present eduFuse collaboration system, and
describes the technical issues that constrain its devlopment. Chapter 8 details the system
from a developer's perspective, illustrating the process that goes into creating lesson
materials and describing the efforts of past third party developers.
Finally, Chapter 9 will wrap up with a reexamination of the Administration,
Collaboration, and Visualization motivations, along with an assessment of the future of
Chapter 2
Related Work
eduFuse development is an amalgamation of work related to many areas of research.
Course administration tools, software visualization, and collaborative online
environments are all related to the "all-in-one" algorithms learning environment that is
the goal of eduFuse. To avoid recapitulation of past thesis research
[NDB97][BWP97][NJT98], I will omit a summation of related course administration
tools. The focus of the thesis work presented herein has lead more towards research in
the domains of Software Visualization and online collaboration.
2.1 Software Visualization
Several taxonomies have been suggested to define Software Visualization and its range of
subtopics. This document adheres to the definitions proposed by [PBS98]. The work of
Price, Baecker and Small defines Software Visualization as follows:
Software Visualization is the use of crafts of typography, graphics design, animation, and cinematography with modern human-computer interaction and computer graphics technology to facilitate both the human
understanding and effective use of computer software.
Software Visualization is broken into two fields: Algorithm Visualization and Program
Visualization. This distinction is based upon the level of abstraction of the two
low-level implementation details of programs, such as code structure and data types.
Algorithm Visualization deals with the more abstract problem of describing how an
algorithm works. Whereas Program Visualizations should explicate specific
implementation details, Algorithm Visualizations can be suggestive of a variety of coding
strategies. For example, an animation that illustrates a sorting algorithm might show a
number of sticks of different lengths being rearranged in a manner that reflects the
algorithm's process. This Algorithm Visualization will leave open to interpretation
whether to code the algorithm iteratively or recursively, with linked lists or with arrays.
eduFuse contains both Program Visualization and Algorithm Visualization elements.
Program Visualization is used to provide an interface for arranging modules in a data
flow that indicates both program control flow and the use of important data types.
Algorithm Visualization is used to delve into processes lying within the individual
modules. eduFuse is quite unique in its effort to combine these two aspects of Software
Visualization. Section 2.1.1 describes predominant research in Program Visualization.
Algorithm Visualization systems are generally of two types: static or dynamic. The goal
of eduFuse is to provide dynamic visualization, or Algorithm Animation, thus the focus
of our research has been on this subset of Algorithm Visualization. Section 2.1.2 is an
exploration of Algorithm Animation systems.
2.1.1 Program Visualization Systems
Development of the Application Visualization System (AVS) began in the late 1980s to
facilitate rapid production of programs for scientific data visualization. In its original
data-flow [UPS+89]. AVS has since grown to encapsulate functionality more along the
lines of primitive object oriented programming [AVS97][AVS98]. Modules in AVS are
considered very course-grain [RY92] because each node or module generally
encapsulates an entire program or object. AVS applications are generally built and used
by experts to analyze scientific data. AVS applications are not intended to describe the
algorithmic processes that produce views of the data, more important to AVS users is the
data itself.
ConMan [HAE98] is an interaction intensive data flow language for manipulating
graphical objects. Modules provide interactive tools for defining, transforming, and
viewing graphics data. The system helps describe to users the effect of various
operations on graphical data, and again, course-grain modules suppress the details of the
process of each operation.
eduFuse also provides a data-flow architecture based upon course-grain modules.
However, eduFuse modules are of finer grain than AVS, and perhaps even conMan, as in
eduFuse each low-level module is intended to encapsulate only a single function.
Generally speaking, these functions should be simple enough that their process can be
described well through interactive Algorithm Animation. IBM Data Explorer uses
modules of granularity about the same as those found in eduFuse [Gre+95].
The use offine-grain data flows for Program Visualization has also been an active area of
research. In fine-grain data flows, nodes generally represent primitive operators. Many
diagramming strategies have been developed to handle expressing state, naming space,
complex control flow and data usage details exist only within modules and thus do not
appear in the data flow [Gre+95]. The eduFuse data flow is of fine enough grain that
some complex control flow details need to be handled. Presently, our data flow does not address these details and thus contains ambiguities that obscure the operation of the
program being expressed. An understanding of finer grain data flow techniques may help
us to resolve some of these ambiguities.
2.1.2 Algorithm Animation Systems
There are several factors by which we can measure the educative potential of Algorithm
Animation systems [Pri+98]. Certainly of chief importance is the level of abstraction
afforded by the system [Ken+92]. The abstraction must provide enough detail to
explicate the process while abstracting pragmatic trivialities that may obscure the
process. The best abstraction level provides the quickest mental path to the semantics of
the algorithm. Also of importance is the level of interactivity the animation system
provides. As discussed in the motivational overview, active interaction is critical if not
required for unlocking the descriptive power of animations.
Connection technique, or the way in which an algorithm to be animated is connected with
a graphical subsystem, is perhaps the most fundamental constraint on any algorithm
visualization. After all, the connection technique is what encodes the mapping from
abstract to concrete. To better understand the technical issues involved with Algorithm
Animation systems, a range of these tools have been analyzed with special attention
The Brown Algorithms Simulator and Animator [Bro+84], BALSA, developed at Brown
University, was a pioneering effort in using animations to instruct undergraduate
algorithms courses. BALSA was the first system to implement interesting events as its
connection technique [Bro+98]. An animator working with BALSA instruments the
algorithm with a series of annotations demarcating interesting moments in the
algorithm's process. These annotations are method invocations that make calls to the
visualization system to animate each interesting event. For example, interesting events
supported by an animation of a sorting routine might include comparison, swaps, and
element in place. A major advantage of this interesting event approach is that it gives
animation designers direct control over the level of abstraction of the animation -interesting events can be suggestive of an event at any level in the algorithm's process
[Bro+98][Cox+92][Cox+93]. The primary drawback of this system is its invasiveness.
Each algorithm to be animated must be modified with extra subroutines to drive the
animation. This process alters the appearance of the code and assumes that events can be
clearly identified before execution of the code.
Several systems, including BALSA-II [Bro88], Zeus [Bro9l], and Samba [Sta97] have
followed Balsa's example. BALSA-II extended BALSA's user interaction capabilities
considerably by allowing users to step forward and backwards between interesting
events, thus controlling the pace of the animations. Samba a form of annotations that is
at a lower level of description than "interesting events." Samba animators annotate
algorithms with statements that output a primitive object/trajectory animation code
render the animation. This system allows for the rapid building or a wide range of
algorithm animations [Sta96][Sta99].
Another popular connection technique is the declarative method [GCR98][RC93]. Under
this methodology, an animator creates a number of rules that map an algorithm's state to
visual descriptions. For example, a graph algorithm may want to draw arcs whenever an
edge is added, this reasoning could be handled by the rule:
E[i,
j]
-> line(position(i), positionoj))Pavane [RCWP92] and LEONARDO [CDFP92] both implement a declarative approach
for Algorithm Animation. Pavane affords much greater functionality than LEONARDO.
Declarative rules in Pavane are based upon current state and history of past states, while
LEONARDO's rules are based solely on the current state of the algorithm. Since events
are generally described by successive states, Pavane is able to infer a rich set of events,
while LEONARDO is only able to capture direct mappings of state. However, in
comparison with the "interesting event" method, the use of rules by Pavane to capture
events may present obscure reasoning.
One advantage of the declarative method is that the algorithm does not have to be altered
or examined to produce an animation. Thus, the animator does not need any knowledge
of the algorithm being visualized. This is especially helpful when events that should be
visualized are difficult to isolate or non-deterministic, as with concurrent programs. The
drawback is that compilation overhead is increased as some compile time mechanism is
needed to process the rules into computations that can be executed at run time.
declarative approach. Such is the case when an animator would like a single visual event
to be representative of several minor state changes.
2.2
Shared Workspaces
In the past, most shared workspaces, including HP's SharedX, Sun's ShowMe
SharedApp, and Microsoft's NetMeeting, revolve around a central application model
[MS98][Beg+97]. The benefit of this model is that only one client need contain an
application to afford real time collaboration within the application. The downside is that
large amounts of visual data must be continuously updated and transmitted across the
internet to give the remote clients the appearance of having a local copy of the shared
application. These high bandwidth communications are suitable for LANs, but cause
severe performance issues for WANs.
The advent of Java suggests a new approach to shared workspaces [Beg+97]. When a
user runs a Java applet, a complete copy of the applet is transmitted to the user's
computer. Thus, the central application model immediately seems a poor fit for Java
applets. Each user already has an identical copy of the applet, so sharing the related
visual data is unnecessary. If each applet begins from the same starting point, and all
events produced by the clients are shared among all of the applets, each client will have
the appearance of a shared applet. The introduction of Remote Method Invocation, RMI,
enhances the ease of constructing these shared environments [Sun98].
Collaborative Active Textbooks Using Java (JCAT) is an educational system for
system is based upon "interesting event" methodology, where an underlying algorithm
sends notification of events to the animation portion of the applet. Utilizing RMI, a
central control applet can transmit these interesting events to all client applets viewing
the animation. In an electronic classroom, this would allow a professor to control the
steps of an animation as each student watched from his own browser.
Since eduFuse is completely written in Java, it takes advantage of the distance
collaboration this web based language makes inherently possible. JCAT takes
rudimentary advantage of the Java event sharing paradigm. The JCAT system is not
applicable outside the realm of an electronic classroom, as all instructive context would
be lost. eduFuse aims to provide complete desktop sharing along with a comprehensive
package of messaging tools so that a collaborative context can be maintained in light of
Chapter 3
System Tour
This chapter presents a high level description of the system components that educators
and students interact with during a standard eduFuse session. The reader is encouraged
to experience eduFuse first hand while reading this overview. The eduFuse team's
demonstration server can be found at our homepage, http://edufuse.lcs.mit.edu.
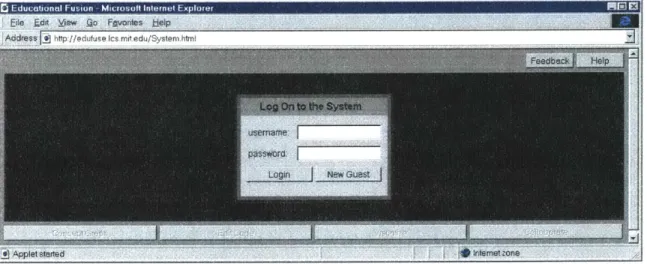
3.1 Entering eduFuse
Selecting the 'Login' link from the eduFuse homepage initiates the system's Java applet,
presenting the user with a login dialog as seen in Figure 3-1. Students, educators, and
system administrators use this single point of entry.
The black area occupying the majority of the client applet will be the user's window to
the eduFuse laboratory. The help button at the top of the screen provides help based
upon the immediate context of this window. The adjacent feedback button invokes a
dialog for ready submission of bug reports. The four buttons along the bottom of the
applet, hereafter referred to as navigation buttons, remain disabled until logged in.
3.2 New Guests
eduFuse visitors are encouraged to create their own account by selecting the 'New Guest'
option. This presents a form for obtaining the identity of the guest, as seen in Figure 3-2.
Guest accounts are presently given the same privileges as student accounts.
Figure 3-2: Guest Information Form
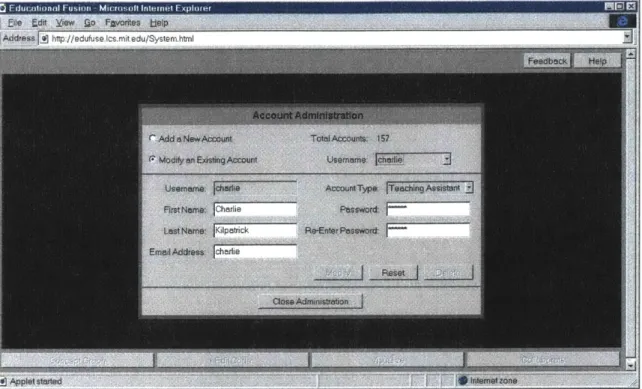
3.3 Account Administration
Each eduFuse server has an administrator account. When the administrator logs in, s/he
This web-based interface allows for convenient and remote management of all account
properties.
Figure 3-3: Account Administration Dialog
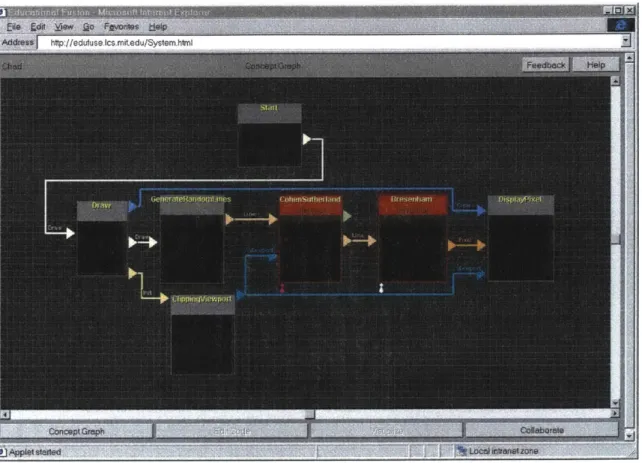
3.4 The Concept Graph
After a user has logged in, s/he is immediately presented with a CG, such as the one
being viewed in Figure 3-4. A user can always return to the CG view via the 'Concept
Graph' navigation button.
A CG is a high-level visualization of the algorithmic concept at hand. The CG in Figure
3-4 presents the process of clipping a line and displaying it on a rasterized display. The
overall structure of the algorithm is shown as a data-flow of linked modules. A simple
and insert other pre-built modules. Changes to the CG can be saved to the user's own file
space on the server.
Each module is a visual abstraction of an algorithm that is part of the overall process.
Color-coded triangles along the sides of the modules represent typed input and outputs.
Type checking is done automatically when a user attempts to create links between
modules.
Figure 3-4: A Concept Graph
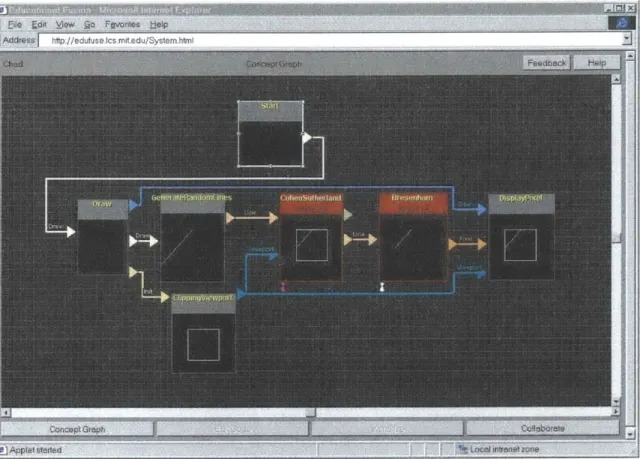
A CG can be executed by clicking on its root module. Data then propagates through the CG and each module displays a visual representation of its operation upon execution.
Figure 3-5: The Same CG After Execution
Students are challenged to implement specific modules. All modules contain a reference
algorithm. Modules considered central to the lesson also contain a user implementation
of the algorithm. In Figure 3-5 there are two such modules. The CohenSutherland and Bresenham modules currently have their reference algorithms loaded. Simply clicking on
the word 'reference' or 'yours' toggles between the reference and user implementation of
the algorithm. Module displays reflect the actual operation of the currently selected
implementations. The effects of broken implementations are readily seen in the displays
of the corresponding and downstream modules. Color provides pronounced indication of
the module's mode, where red indicates 'reference' and green indicates 'yours.' Simply
put, students are challenged to turn all red modules to green and still have a working CG.
Each module that allows for student implementation also has an associated Visualization
Panel (VP). While the CG presents a high level understanding of the overall algorithmic
process, the goal of each VP is to provide an understanding of an important
sub-algorithm. To access a VP the user selects a module and presses the 'Visualize'
navigation button.
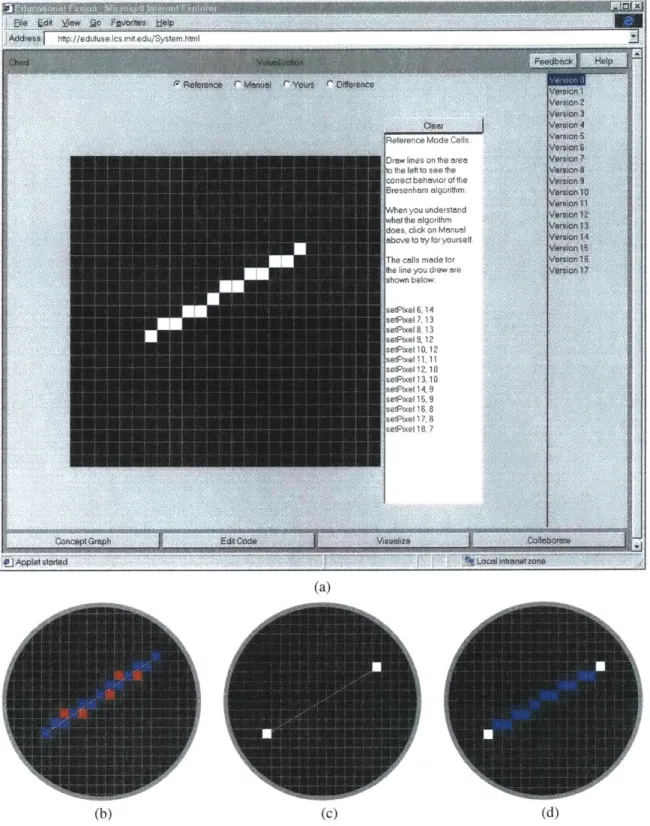
Figure 3-6 presents a user's view of the VP for Bresenham's line clipping algorithm. The
educational value of this and all VPs hinges on the implementation of four different
pedagogical modes: 'reference' mode, 'manual' mode, 'yours' mode, and 'difference'
(a)
(b) (c) (d)
Figure 3-6: A visualization panel for Bresenham's algorithm with a caption for each of the four
pedagogical modes: a) reference; b) manual; c) yours; d) difference.
Reference mode presents the user with a correct implementation of the algorithm. Users
called, and a rasterization of the line is computed and shown. The text window to the
right of the display gives the viewer a trace of calls to the method setPixel that were
directly responsible for the rasterization, thus providing symbolic notation along with the
visual expression. Repeating this experiment and examining the graphical and trace
results allows students to understand what output will result from a given input.
Manual mode allows the user to further test this understanding. Again, the user suggests
input to the algorithm by sweeping out a line. The user then conjectures the output by
selecting appropriate pixels on the rasterized view. Evaluation of each trial pixel is
performed by comparison with the underlying reference algorithm's output. With each
mouse click, a pixel is lit either blue or red, indicating correct and incorrect respectively.
Yours mode should be used after the user has gained a general understanding of the
algorithm through experimentation with the first two modes. This mode provides a
visualization of the output of the user's implementation. The user sweeps out a line, the
line definition is sent to the user's implementation, and the algorithm's output is
displayed. The version list bordering the right side of the VP allows a user to select from
any of his compiled implementation attempts. In yours mode, a user can easily examine
the output produced by his algorithm on a variety of input tests.
Difference mode allows a user to verify the correctness of his implementation. After the
user has swept out a line, both the user's implementation and the reference
implementation of the algorithm are called, and the results are visually compared. White
indicates correct pixels, blue indicates pixels that should have been output, and red
allows a user to quickly identify where his implementation has erred. Repeated tests on
different input cases may yield similar errors that suggest the nature of the problem to the
user.
3.6 Integrated Development Environment
By now, the reader is probably wondering how the students supply their implementations
to the eduFuse environment. Programming in eduFuse does not require a student to setup
his own coding environment and submit compiled files. Instead, an IDE is seamlessly
integrated with the eduFuse environment. When a student is ready to edit an
implementation of an algorithm, s/he simply clicks the 'Edit Code' navigation button, and
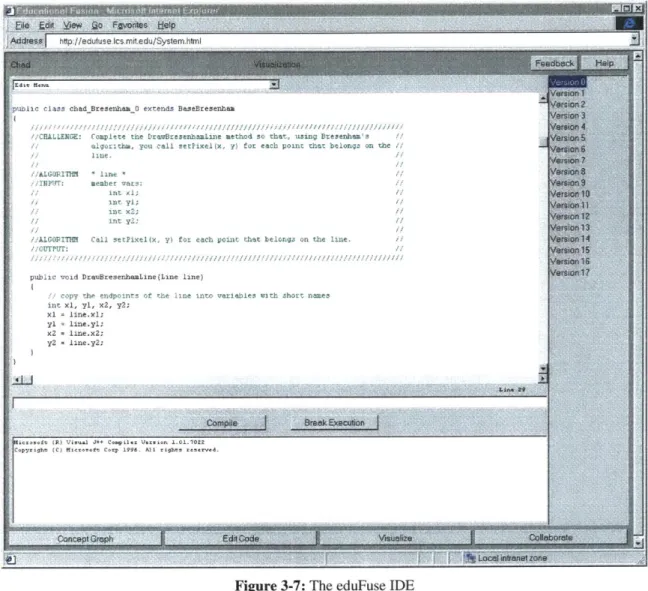
Figure 3-7: The eduFuse IDE
The main window of the IDE presents the code for the user's implementation of the
algorithm. Presently, eduFuse only supports Java, but interpreters such as JScheme make
inclusion of other languages plausible in the near future. Figure 3-7 shows the body of
code that a student is initially challenged to fill in with an implementation of
Bresenham's line drawing algorithm. Notice that the function takes an input of type
Line, and output is sent by making calls to the setPixel method. The reader may
confirm that these are the same input and output types expressed visually by the CG and
VP. This consistency between the graphical and symbolic notations makes it easy for
When a user is ready to compile his code, s/he simply presses the compile button located
beneath the editor window. The code is sent to the server and compiled. If the
compilation is not successful, compilation errors appear in the window at the bottom of
the screen. If the compilation is successful, the class file is made available to the eduFuse
client.
As when examining a VP, a version list is presented along the right of the IDE. Each
compile attempt adds a version to the list, and all versions are persistently stored on the
server for convenient review or modification at any time.
3.7 Collaboration Facilities
When a user enters eduFuse, s/he is immediately presented with visual indication of all
users currently in the same lesson environment. Each user is portrayed by and avatar that
sits beneath the module that the user is currently working with. Avatars are color coded
to indicate the type of account each user has. For example, in Figure 3-4, the user can
observe that a professor, indicated by purple, is currently working with the
CohenSutherland module. The user's own avatar is always white.
eduFuse provides a complete set of messaging utilities. Included are quick messages, private and group chat sessions, and a TA help queue to be used when educators do not
have time to instantly respond. All discussions can be logged to a history file for later
review.
Messages can be sent or discussion windows launched by right clicking on the
histories, can be accessed from the collaboration panel, which is entered by clicking the
'Collaborate' navigation button [Ken99].
The true strength of collaboration in eduFuse is due to the shared visual contexts which
discussions can be centered around. If a student is having trouble with a module, the
student sends a message to a TA, who can subsequently load the student's
implementation of the module for review.
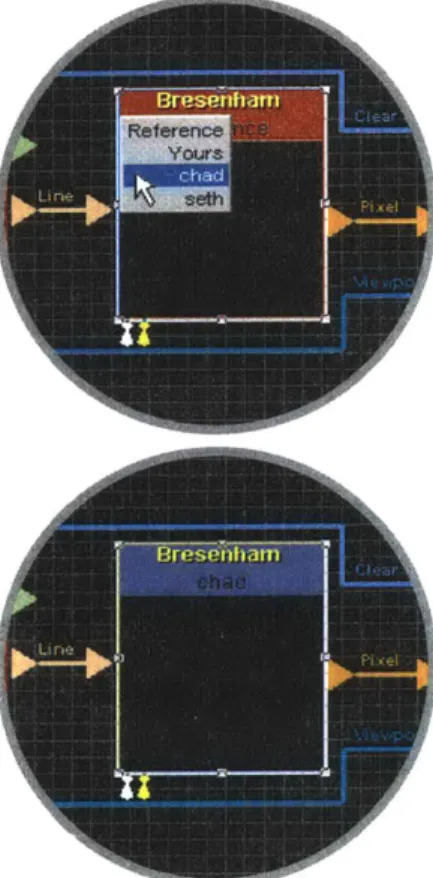
When an educator clicks on a module's mode indicator, a popup menu presents 'reference' and 'yours' options
along with a list of all users who have implemented the
module. Selecting a user's name loads the module with
that user's implementation, and colors the module blue
to indicate the foreign implementation. Figure 3-8
depicts this interaction. A teacher can review a student's
implementation as it appears on the CG, or through use
of the IDE and associated VP. Meanwhile the student
and educator can be engaged in active conversation
through a discussion window.
Figure 3-8: A teaching assistant
loads a student's implementation for review.
3.8 Administrative Facilities
eduFuse offers vast simplification of the myriad of administrative tasks that would
normally surround a course in algorithms. Most of these enhancements are not provided
by independent features, rather, they are inherent to the design of the eduFuse
environment.
The Concept Graph is not only a visual program, it is a visually navigable library of
coursework. All assignments are persistently stored and conveniently organized to the
advantage of both student and educator. Parties on both sides of the lesson table are
detached from the task of archiving course content. Moreover, there still exists, but in
different form, a process of turning in and handing back assignments, since student work
is always persistently viewable by both student and teacher.
One feature that has been added to facilitate traditional grading of homework is Feedback
Forms. Each module has a Feedback Form associated with it. After reviewing a
student's work on a module, an educator can summon the Feedback Form by pressing the
'Grade' button that appears in his IDE window. Feedback Forms are standard HTML
documents, with fields that direct an educator's comments to topics appropriate for the
algorithm under consideration. When the educator is finished with the form, s/he presses
a submit button, and the form is emailed to the student via the address in the student's
Chapter 4
Client-Server Foundation
The eduFuse laboratory is constructed on top of a client-server architecture intended to
readily facilitate collaboration and persistent storage or coursework. Both the client and
server are platform independent as they are both written purely in Java.
4.1 Communications
Before users enter the eduFuse environment, a session connection must be established
with the eduFuse server. The HTML that presents the client-side applet provides a port
number through which the client applet communicates with the eduFuse server. The
client sends a connection request to the server via the supplied port, and a dedicated
socket is established for stream based communications. All communications between the
server and client will be facilitated by this socket.
An alternative to streaming is CGI posting. CGI posting requires a new TCP/IP
connection to be established for each request, while streaming keeps a socket
continuously open between the client and server. For this reason, a series of stream based
requests can be fulfilled much faster than a series of CGI requests. eduFuse uses stream
The major draw back of streams is that they cannot be established across firewalls. Thus,
eduFuse currently cannot be accessed from the other side of a firewall.
Plans are in place for replacing our custom stream handling routines with Java Remote
Method Invocation (RMI). Currently, a common interface lying on top of the
client-server stream is used for all messages placed on the stream. This interface was developed
to make it easy to produce new client-server queries. Since the interface is now used for
all client-server queries, simply sliding RMI beneath this interface will direct all
communications through RMI. RMI automatically determines if a firewall is present, and
chooses accordingly between CGI posting and stream-based communications.
4.2 Routing
Each user is assigned a unique user ID (UID) when his account is created. When a user
logs in to eduFuse, the UID is paired with the user's socket number and placed in a server
side hash table. Conflict resolution exists to handle when the same user logs in multiple
times. All clients are notified of a new user's arrival, and the entering user receives
notification of each resident client.
Each client maintains a hash table of username and UID pairs. When a client wants to
send a message to a specific user, the client applet looks up the recipient's UID and
attaches it to the message sent to the server. The server then uses the UID to look up the
4.3 Persistent File Storage
C atetio n
Mp~Din
Graphics
IntroToAlg
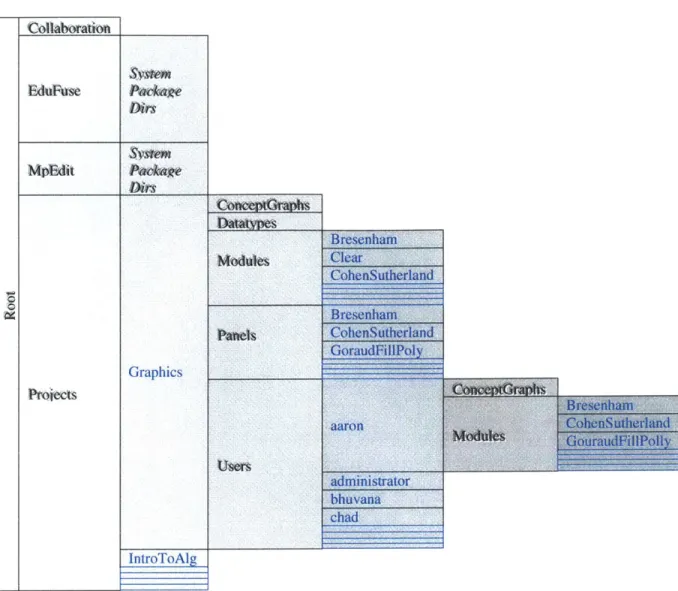
Figure 4-1: A diagram of the eduFuse file hierarchy. Each cell in the diagram represents a folder.
Cells to the right are nested in adjacent cells to the left. Black cell names indicate system folders, while blue cell names indicate data folders particular to this demonstration installation of the eduFuse system.
The eduFuse server contains a wealth of persistent course data, as detailed by Figure 3-2.
For each course, the eduFuse server provides a repository for lesson materials, student
coursework, and account information.
Serialization is used to persistently store CGs on the server [Boy97]. Each visual element
of a CG has a textual description that is read and written by the client upon loading and
storing the CG. Serialization makes it possible to transmit the description of the CG
between server and client. The first time a CG is opened, a reference version is retrieved
Chapter
5
Program Visualization in Edufuse: An
Extended Data Flow Model
The goal of the Concept Graph Data Flow model is twofold [Abr+95][Kod+91]. First, it
should clearly describe the control flow of a program. Second, the data used by each
component of the flow should be clearly indicated. If both of these factors are achieved,
the high level operation of a CG program is clearly explained.
Data flows apply well to programs based upon a linear execution. Control flow and data
usage can easily be described statically when execution proceeds sequentially from
beginning to end. Unfortunately, only simple programs, or very coarse-grain views of
programs, can be observed as a linear sequence of events.
When iteration or recursion is part of a program's process, more complex diagramming
techniques, or even dynamic visualizations, are needed to help trace control flow and the
use of data. In this section we analyze how well the CG data flow model applies to
complex control structures, namely iterations and recursions, and suggest extensions
where appropriate.
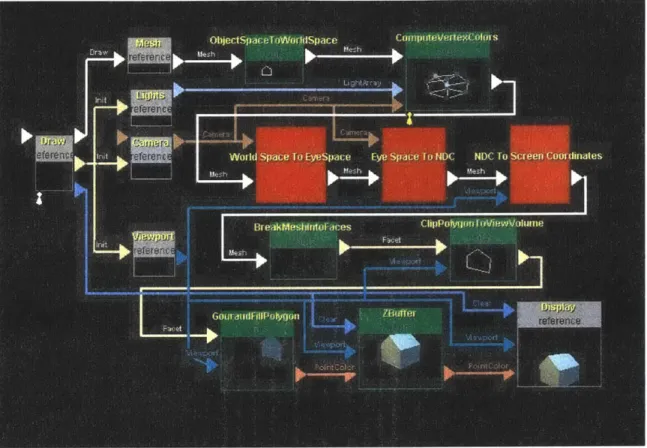
There are two iterative process in Figure 5-11. Can you spot the loop within a loop?
Unless you are very familiar with data flow processes, chances are you cannot identify
the iterations from this static capture of a Concept Graph. The outer loop starts at the
'BreakMeshIntoFaces' module and completes at the 'Display' module. The inner loop
starts at the 'GouraudFillPoly' module, and again ends at the 'Display' module.
Figure 5-1: A Concept Graph with Iterations
In viewing the CG's dynamic execution, these loops are much more obvious, as the
viewer sees the displays of the modules update with corresponding frequency. The static
clues are the data types passed at the beginning of these loops. In the CG data flow,
control flow is data driven[AVS91][Gre+95] [Kod+91]. Thus, an iterative process begins
down stream up to a collection module are then executed multiple times. The collection
module receives multiple input sets for single or no output sets. In this case, 'Display' is
the collection module.
Loops tend to break an important property of data flows. In order to prevent ambiguity, each module should be a pure function [Gre+95]. That is to say, the output of each module is fully defined by its input. However, iterative computations are stateful as they rely on values computed in past executions of the loop. The 'Zbuffer' and 'Display' module both contain state in the form of a buffer.
Outside of the CG's loops, all state is seen transmitted through the Concept Graph. In order to capture this same clear logic within the loops, modules need to pass data upstream. For example, if the 'ZBuffer' module contained an output of type 'Buffer' connected to its own input of type 'Buffer,' then the module would not hide state.
Control flow could be made clearer by dynamically highlighting links when fired. This would make iterative processes inherently animated by the eduFuse system, instead of having to rely upon module displays produced by third party module designers.
5.2 Modeling Recursion
Data flow systems do not generally attempt to model recursion [AVS89][AVS97] [AVS98][Gre+95][Kod+91]. The reason for this seems to be based upon the fact that recursion does not have an obvious static graphical representation. Self reference seems to require symbolic notation - one can not draw an object within itself. Indeed, many conjecture that recursion is not a visual concept, it is a symbolic one [Nic94].
Figure 5-2: A Concept Graph with Recursion
However, the author believes that dynamic visualization is capable of capturing the
notion of self reference. Figure 4-21 is a concept graph of a recursive ray tracer. The
recursive step is shown using notation that the author has suggested should be used for
iterative manipulation, not recursion. eduFuse offers an abstraction technique that allows
a module to define itself in terms of abstracted modules. Solid colored modules without a
display, as seen in Figure4-1, are examples of such modules. Clicking on one of these
modules reveals another CG contained inside. Recursion can be elegantly expressed by
using this abstraction technique and placing a module within itself. During execution,
dynamically expanding abstraction modules would reveal this recursion in action.
eduFuse modules have very flexible execution scheduling. Each module defines its own
routine for collecting inputs and deciding when to fire its underlying algorithm. While
this affords useful flexibility that makes the CG data flow capable of handling a wide
range of algorithms, it also makes control flow visually ambiguous. Figure 5-3 depicts this problem.
44
44
4
4
Figure 5-3: The CG observer can not directly infer when a module's algorithm will fire.
Overly constraining the firing policy will result in less CG flexibility, making it more
difficult to efficiently express complex control flows. The author believes that some
flexibility should be maintained, and could be visualized by offering a variety of input or
module types. Certainly, this is an area for further exploration.
1 This Concept Graph was also produced by Charlie Kilpatrick, Wesleyan University '00.
fre
algorithm
-Chapter 6
Algorithm Visualization in eduFuse: The
Visualization Panel
The goal of the Visualization Panel is twofold. First, by presenting students with a
simple means of verifying their algorithms, we hope to make better use of students' time
by removing the "grunge" work usually associated with the testing cycle. Second, the
four pedagogical modes should guide the user to a better understanding of the algorithm's
process. We have succeeded in the former goal, but the latter more challenging goal has
not yet been realized. We are confident that the four pedagogical modes inherent to each
visualization panel do focus our efforts in the right direction. The problem, then, lies in
the implementation of those modes.
In light of the motivation and research presented in the beginning of this document, it is
clear that the visualization panels must contain animation if they are to yield insight into
an algorithm's process. Simply viewing an algorithm's inputs and outputs presents the
novice only with an understanding of the algorithm's purpose. An expert can make
inferences from flawed output, but the ignorant student has no understanding from which
to draw conclusions about the underlying operations.
VPs are components of the eduFuse system that communicate with modules to produce a
visualization of the underlying algorithm's animation. VPs are coupled with modules
through the module's inputs and outputs. Thus, a VP links with a module in the same
way that other modules in the CG do. The VP associated with a module can be changed
at any time, so multiple VPs can be produced for the same algorithm. The functionality
of the module and VP are elegantly separated to allow for nearly independent
development of algorithm code and algorithm visualization.
6.2 Incorporating Interesting Events
To produce animations with VPs, a clear connection technique for animation, not just static visualization of inputs and outputs, must be implemented. An approach based on
"interesting events" would provide appropriately abstract events for animation. The
module architecture should be extended to allow for modules to announce interesting
events. More specifically, ports could be easily added to a module for each interesting
event in the same way that ports are added for each data output, the only difference being
that interesting event ports would not be visualized on the CG. In the same way that a
VP has been made to map itself to an algorithm's output data, VPs could also be mapped
to the interesting events produced by modules. To insure that a VP is appropriate for a module, the interesting events received by the VP should be a subset of the interesting events produced by the module.
Once the base classes for algorithms and modules are extended with this infrastructure,
would greatly enhance the expressiveness of both the Reference and Manual pedagogical modes.
6.3 Manual Mode Issues
A Manual mode based on interesting events would present the student with the challenge
of correctly guiding the process of an algorithm. The VP designer is challenged with providing an effective interface for capturing interesting events from the user. Manual mode demonstrations now should be able to provide students with a mental picture of the all important mapping from underlying operations to animation since the student himself suggests the operations. Under this new scenario, Manual mode would perhaps be the first pedagogical mode offered to the user, requiring that it be "solved" before unlocking the other three pedagogical modes..
Direct Manipulation is the study of graphically defining algorithms [Sta+98]. Instead of a mapping from algorithm to animation, Direct Manipulation investigates the potential of mapping an interactively input animation description to an algorithm. This work provides insight into how to effectively design Manual modes that map user interactions to interesting events.
6.4 User Mode Issues
Allowing users to instrument their own code with interesting events would allow user's to animate their own implementations. However, several issues challenge the effectiveness of using interesting events for debugging. First, erred interesting events could drive an animation in unsuspected ways. What happens if the animation is asked to
swap an array element with another array element that does not exist? Additionally,
interesting events may hide programming errors that are of a finer granularity than the
events[Baz+98].
In light of these serious challenges, allowing users to animate their own implementations
should not be an initial goal for the use of interesting events in eduFuse. Concentration should be focused on using interesting events to make reference mode and manual mode
powerful tools for expressing the process of an algorithm. Students should continue to
use verification of their code at an input/output as a final test to see if they can implement
Chapter
7
Contextual Collaboration
Since the inception of eduFuse, one of the most compelling visions that has driven it's development is the desire to provide an online laboratory that is truly a shared workplace. The first thesis written on eduFuse presented the idea of NetEvents [Boy97], later termed Network Transparent Events [Tor98]. The concept behind this event model is the same as Event Broadcasting: desktops are synchronized and then all events received by one desktop are received by all desktops, thus maintaining synchronized views.
7.1 Issues with Shared Events
Nick Tornow developed a prototype system for desktop sharing in his thesis work [Nic98]. Several synchronization issues have prevented the full realization of this work.
The Concept Graph was one of the few pieces of the eduFuse environment where synchronization was not a problem. There are two underlying reasons. First, synchronizing eduFuse lesson data is straightforward. CGs were already made serializable to facilitate storage on the eduFuse server. This same serialization can be used to package up a CG and transmit it to another client, effectively performing synchronization. Thus, successful desktop sharing was achieved in the CG context.