HAL Id: hal-00317225
https://hal.archives-ouvertes.fr/hal-00317225
Submitted on 1 Jan 2004
HAL is a multi-disciplinary open access
archive for the deposit and dissemination of
sci-entific research documents, whether they are
pub-lished or not. The documents may come from
teaching and research institutions in France or
abroad, or from public or private research centers.
L’archive ouverte pluridisciplinaire HAL, est
destinée au dépôt et à la diffusion de documents
scientifiques de niveau recherche, publiés ou non,
émanant des établissements d’enseignement et de
recherche français ou étrangers, des laboratoires
publics ou privés.
equatorial mesosphere/lower thermosphere over
Ascension Island
D. Pancheva, N. J. Mitchell, P. T. Younger
To cite this version:
D. Pancheva, N. J. Mitchell, P. T. Younger. Meteor radar observations of atmospheric waves in the
equatorial mesosphere/lower thermosphere over Ascension Island. Annales Geophysicae, European
Geosciences Union, 2004, 22 (2), pp.387-404. �hal-00317225�
Geophysicae
Meteor radar observations of atmospheric waves in the equatorial
mesosphere/lower thermosphere over Ascension Island
D. Pancheva1, N. J. Mitchell1, and P. T. Younger1
1Department of Electronic & Electrical Engineering, University of Bath, Bath, BA2 7AY, UK
Received: 18 November 2002 – Revised: 9 June 2003 – Accepted: 18 June 2003 – Published: 1 January 2004
Abstract. Some preliminary results about the planetary
wave characteristics observed during the first seven months (October 2001-April 2002) of observations over Ascension Island (7.9◦S, 14.4◦W) are reported in this study. The zonal wind is dominated by the 3–7-day waves, while the
merid-ional component – by the quasi-2-day wave. Two wave
events in the zonal wind are studied in detail: a 3–4-day wave observed in the end of October/November and the 3–6-day wave in January/February. The moderate 3- and 3.2-3–6-day waves are interpreted as an ultra-fast Kelvin wave, while for the strong 4-day wave we are not able to make a firm de-cision. The 6-day wave is interpreted as a Doppler-shifted 5-day normal mode, due to its very large vertical wavelength (79 km). The quasi-2-day wave seems to be present almost continuously in the meridional wind, but the strongest bursts are observed mainly in December and January. The observed period range is large, from 34 to 68 h, with some cluster-ing around 43–44 and 50 h. The estimated vertical wave-lengths indicate shorter wave-lengths during the equinoxes, in the range of 25-30 km, and longer ones, ∼ 40–50 km, in Jan-uary/February, when the 48-h wave is strongest.
Key words. Meteorology and atmospheric dynamics (mid-dle atmosphere dynamics, waves and tides)
1 Introduction
It is well known that the circulation of the equatorial mid-dle atmosphere, unlike that at extra-tropical latitudes, is not dominated by annual oscillation (Andrews et al., 1987). At heights below 35 km the winds are dominated by a quasi-biennial oscillation (QBO), while above 35 km - by a semi-annual oscillation (SAO) (Ebdon, 1960; Reed, 1962). It is found by rocket and satellite measurements that the SAO has maximum amplitudes near the stratopause (∼50 km) and mesopause (∼85 km), with a minimum near 65 km, and the stratospheric SAO (SSAO) and mesospheric SAO (MSAO) Correspondence to: D. Pancheva (eesdvpbath.ac.uk)
are in anti-phase (Hirota, 1978; Hamilton, 1982; Garcia et al., 1997). The QBO and SAO are centred at or near the equator, and their cycles start first at upper levels and then descend steadily with time. Descending wind regimes are usually a characteristic of a circulation driven primarily by waves propagating from below. So, upward coupling of en-ergy and momentum by waves generated in regions of intense tropospheric convection is expected to be important for deter-mining the state of the equatorial middle atmosphere. There is some evidence that waves, such as Kelvin and Rossby-gravity waves, play a crucial role in driving the QBO in the lower stratosphere (Lindzen and Holton, 1968) and the SSAO (Dunkerton, 1979). Recent studies, however, have suggested that additional momentum deposition by gravity waves is necessary to quantitatively explain the behaviour of the QBO (Dunkerton, 1997). It has been suggested that mo-mentum deposition associated with breaking or dissipating Kelvin waves, atmospheric tides and gravity waves are also important for the MSAO (Hirota, 1978; Dunkerton, 1982), despite the fact that the precise mechanisms are poorly un-derstood. The role of the equatorial Kelvin waves in produc-ing the zonal mean eastward flow associated with the lower stratospheric QBO, SSAO and MSAO, however, has been de-bated recently.
Some numerical simulations (for example, Hitchman and Leovy, 1988) indicated that Kelvin waves were apparently too weak to fully drive the eastward phase of the SSAO. Sev-eral mechanisms are likely to be responsible for the SSAO and MSAO. This debate has strongly stimulated the obser-vations of the equatorial atmospheric waves and especially Kelvin waves.
Recently, a few studies using both satellite and ground-based measurements revealed the characteristics of Kelvin waves, especially in the mesosphere/lower thermosphere (MLT) region (Lieberman and Riggin, 1997; Riggin et al., 1997; Smith, 1999; Kovalam et al., 1999; Yoshida et al., 1999; Sridharan et al., 2002). On the basis of the HRDI data obtained by the UARS mission, Lieberman and Rig-gin (1997) concluded that the 3-day Kelvin waves are an
im-portant source of eastward momentum in the lower thermo-sphere ∼100 km, but also that they are likely to be ineffective in the MSAO near ∼85 km. Smith (1999), also using HRDI data, presented evidence for a quasi-stationary Kelvin wave of zonal wave number 1 that is forced in situ in the upper mesosphere and propagates upward from there. She found that the momentum transport by this Kelvin wave is small and does not make a significant contribution to the MSAO. Kovalam et al. (1999) and Sridharan et al. (2002) using the medium frequency (MF) radar data, determined that the role of the Kelvin waves in the mesospheric momentum budget is small. The results of Yoshida et al. (1999) based on the meteor radar and radiosonde observations in Indonesia sug-gested a possible interaction between the Kelvin waves ob-served in the MLT region and the MSAO, although an exact mechanism is uncertain. They also investigated the Kelvin waves in the stratosphere, but their semiannual periodicity was not detected there.
The quasi-2-day wave that can attain large amplitudes par-ticularly in the meridional wind component of the equatorial MLT region is another strong feature that could be respon-sible for the momentum budget of the middle atmosphere. This oscillation has been extensively reported in radar neu-tral wind observations (Muller, 1972; Salby and Roper, 1980; Craig et al., 1980; Plumb et al., 1987; Tsuda et al., 1988; Raghava Reddi et al., 1988; Harris and Vincent, 1993; Palo and Avery, 1995; Thayaparan et al., 1997a; Gurubaran et al., 2001), in rocket-sonde winds in the upper stratosphere (Coy, 1979) and in the satellite coverage of the middle at-mosphere (Rodgers and Prata, 1981; Burks and Leovy, 1986, Wu et al., 1993, Ward et al., 1996; Lieberman, 1999). The longitudinally-spaced radar comparisons suggest that the 2-day wave is westward propagating with zonal wave numbers ranging between 2 and 5 (Muller and Nelson, 1978; Meek et al., 1996; Thayaparan et al., 1997b), while satellite anal-yses indicate westward propagation mainly with zonal wave numbers between 2 and 4 (Lieberman, 1999).
The 2-day wave is a global-scale oscillation with ampli-tude maximum between 80 and 100 km in July-August in the Northern Hemisphere and January-February in the Southern Hemisphere. Amplitudes are larger in the Southern Hemi-sphere, being up to a factor of two more than those found in the Northern Hemisphere. The observations in the equatorial and low latitudes (Harris and Vincent, 1993; Palo and Av-ery, 1995; Gurubaran et al., 2001) indicate that the activity is stronger in both summer and winter in the meridional com-ponent and is found to be much stronger in January–February than in June–July. In the Southern Hemisphere the period is close to 48 h, while in the Northern Hemisphere it is rang-ing between 43 and 53 h. The vertical wavelength calculated from the rate of change of phase with height is found to range from 20 to more than 150 km.
Two mechanisms have been proposed as a cause for the presence of the 2-day wave in the middle atmosphere. One is based on the normal mode theory (Salby, 1981) that in-terprets the wave as a manifestation of the (3,0) Rossby-gravity mode. Hagan et al. (1993) have extended the
re-sults of Salby (1981) by changing the mean wind field to include the summer mesospheric jet. They found that the stratospheric and mesospheric zonal mean winds strongly af-fect the salient features of the 2-day wave observed in the MLT region. Plumb (1983) and Pfister (1985) gave an al-ternative explanation of the 2-day wave, suggesting that the wave is excited in a baroclinically unstable summer meso-spheric jet. It is known that both mechanisms cannot explain some wave features, such as hemispheric differences in the amplitude and the wave period. Therefore, more observa-tions are needed to clarify certain key quesobserva-tions related to the generating mechanisms, the effects of mean wind on the wave features and the role of the 2-day wave in the momen-tum budget of the middle atmosphere.
Understanding of dynamics of the equatorial MLT region has improved recently because of the installation of several MF and meteor radars in India, Indonesia, Christmas Island (Republic of Kiribati) and Peru. They cover mainly a longitu-dinal range east of 78◦E and west of 80◦W, so a range with more than 150◦ continuous length is left without any mea-surements. This gap was partly filled with the installation of the meteor radar at Ascension Island (7.9◦S, 14.4◦W) in 2001. The description of the radar, and distribution and pro-cessing of the raw data, as well as the first results for the mean wind and tides observed above Ascension Island, are presented in Mitchell et al. (2002). In this study we report some preliminary results about the planetary wave character-istics observed during the first seven months of observations between October 2001 and the end of April 2002.
2 Data analysis
The meteor radar at Ascension Island operates at frequency near 43.5 MHz. It measures wind over an altitude range of 80–100 km, with velocities sampled at ∼3 km height reso-lution and a maximum data rate around 90 km. The mean hourly horizontal wind velocities are used in this analysis. To reveal the underlying winds and tides, we used a best-fit procedure to extract these waves from the time series. Data were analysed using a simple linear least-squares fit which included a mean wind, and 24-, 12- and 8-h harmonic com-ponents. The data points were weighted in the fitting process according to the number of individual measurements com-posing each hourly mean. The harmonic components were determined in segments of 24- h duration. The mean wind and tidal characteristics are obtained only when the segment consists of more than 16 measurements. Then the segment was incremented through the time series in steps of 1 h and the analysis repeated, yielding hourly-spaced values for the mean wind, and 24-, 12- and 8-h tidal amplitudes and phases. Each height is treated separately in this analysis. To estimate the confidence levels we assumed that the residual fitting er-ror is described by a Gaussian-white noise. The Student T-test was then used to estimate the confidence levels.
The waves studied in this paper were found to be highly dynamic with amplitude and phase changes over relatively
18
27 57 87 117 147 177 207
TIME (05 Oct. 2001-30 Apr. 2002)
82 84 86 88 90 92 94 96 HEIGH T (km) -90 -80 -70 -60 -50 -40 -30 -20 -10 0 10
Mean Zonal Wind; Ascension Island
Oct Nov Dec Jan Feb Mar Apr
Fig. 1
Fig. 1. Time-height cross section of the smoothed zonal wind (by 10-day run-ning means) observed over Ascension Island between October 2001 and April 2002. Solid line indicates zero veloc-ity. The white regions indicate missing data.
short time scales. The wavelet transform was used to investi-gate the changing composition of the planetary-wave field. This approach is becoming a favoured tool for analysing time series in which the assumption of stationarity does not hold. Decomposing the time series into time-frequency space, the wavelet transform is able to determine both the constituent frequencies and how those frequencies vary in time, producing a two-dimensional time-frequency image (Torrence and Compo, 1998). The analysis presented here used the continuous Morlet wavelet, which consists of a plane wave modulated by a Gaussian envelope. The Mor-let waveMor-let was selected because of its simplicity and resem-blance to the modulated planetary-wave“packets”, which are frequently observed in the ionosphere and MLT region vari-ability (Pancheva and Mukhtarov, 2000). Additional spectral information was gained by applying the high-resolution cor-reloperiodogram analysis (Kopecky and Kuklin, 1971).
A weakness of the wavelet transform used here is that it re-quires regularly spaced data points in the time series in con-sideration, i.e. there should be no gaps in the data. In the present work, small data gaps of 2–4 h in duration were filled by an interpolation based on data on either side of the gap using a least-squares fit of a second-degree polynomial with exponentially decreasing weights away from the gap in the data. Larger gaps of between 4 and 8 h in duration were filled by applying a daily tidal fit, and the gaps were then filled with the fitted values, plus a random error distributed uniformly in the range of ± 1 standard deviation. If the length of the gap was longer than 8 h (there are only a few cases), the following procedure was used, which is appropriate for cases where the frequency of the dominant signals in a time series is known in advance (as in our case with 12- and 24-h tides). First, the data neighbouring the gap interval, with a length at least two times longer than the gap, were examined to determine the mean amplitudes and phases of the strongest periodic com-ponents (i.e. the tides in our case). The gap was then filled with data derived from these results, with the constraint that the variance of the data used to fill the gap must have the same variance as that of the neighbouring intervals.
A complex demodulation method is usually used for effec-tive investigation of one frequency range at a time (Bloom-field, 1976). We applied this method for studying the quasi-2-day wave, whose period changes mainly between 40 and 60 h. This technique allows for the amplitude and phase of an oscillation to be described as a function of time. The ba-sic idea of this method and its application to the quasi-2-day wave is described in detail by Harris and Vincent (1993) and Thayaparan et al. (1997a).
3 Results
3.1 Mean zonal wind
The focus of this paper is on characteristics of the planetary waves, but to set the results in context we first consider the behaviour of the mean zonal wind. Figure 1 shows a time-height cross section of the smoothed mean zonal wind (by 10-day running means) between 5 October 2001 and 30 April 2002. The thick solid line indicates zero velocity. The white regions indicate missing data, a 14-day interval in the second half of November 2001 and an 8-day interval at the begin-ning of January, 2002, obtained because of an interruption in data recording. It is evident that most of the time the wind is westward with a strong maximum in March/April reaching −90 m/s at altitudes around 85 km and a secondary maximum in October. During the equinoctial months, the zonal wind is westward in the whole altitude range, while in November it is westward only at the altitudes higher than 85 km and in December only below 90 km. During these two months, a strong wind shear with opposite sign is ap-parent. The wind is eastward almost in the whole altitude range at the end of December and January, with maximum in January reaching 10 m/s at 85 km height. There is a signa-ture for downward descent of the wind contours which is a characteristic of wave driven circulation.
19
ZONAL WIND; ASCENSION ISLAND
27 57 87 117 147 177 207 2 4 6 8 10 12 14
PER
IOD (days)
0 3 6 9 12 15 18 21 24 27 30 33 36 h=97 km 27 57 87 117 147 177 207 2 4 6 8 10 12 14PER
IOD (days)
0 3 6 9 12 15 18 21 24 27 30 33 36 h=93.5 km 27 57 87 117 147 177 207 2 4 6 8 10 12 14PE
RI
OD
(da
ys
)
0 3 6 9 12 15 18 21 24 27 30 33 36 h=90.5 km 27 57 87 117 147 177 207 2 4 6 8 10 12 14PER
IOD (d
ay
s)
0 3 6 9 12 15 18 21 24 27 30 33 36 h=87.5 km 27 57 87 117 147 177 207 2 4 6 8 10 12 14PE
RI
OD (d
ay
s)
0 3 6 9 12 15 18 21 24 27 30 33 36 h=84.5 km 27 57 87 117 147 177 207 . 2 4 6 8 10 12 14PE
RI
O
D
(d
ay
s)
0 3 6 9 12 15 18 21 24 27 30 33 36 h=81 km O N D J F M A2001
2002
Fig. 2a
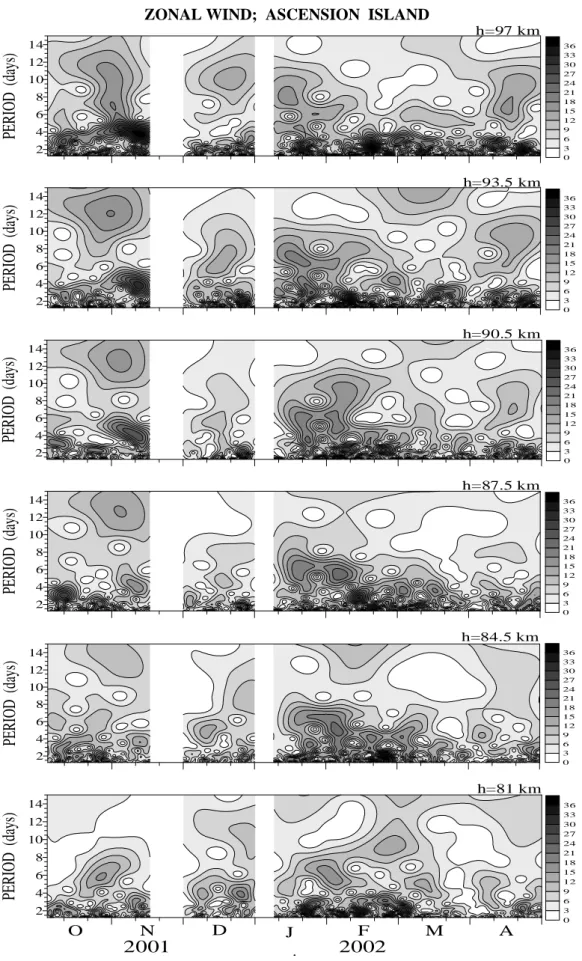
Fig. 2a. Wavelet transform of the zonal wind observed by meteor radar in the interval 05 October 2001–30 April 2002. The spectra are calculated in the period interval 1.5-15 days and for six altitudes shown on the right upper corner of each figure.
20
MERIDIONAL WIND; ASCENSION ISLAND
27 57 87 117 147 177 207 2 4 6 8 10 12 14
PER
IOD (days)
0 5 10 15 20 25 30 35 40 45 50 55 60 h=97 km 27 57 87 117 147 177 207 2 4 6 8 10 12 14PER
IO
D
(d
ay
s)
0 5 10 15 20 25 30 35 40 45 50 55 60 h=93.5 km 27 57 87 117 147 177 207 2 4 6 8 10 12 14PER
IO
D
(d
ay
s)
0 5 10 15 20 25 30 35 40 45 50 55 60 h=90.5 km 27 57 87 117 147 177 207 2 4 6 8 10 12 14PER
IOD (d
ay
s)
0 5 10 15 20 25 30 35 40 45 50 55 60 h=87.5 km 27 57 87 117 147 177 207 2 4 6 8 10 12 14PER
IOD (days)
0 5 10 15 20 25 30 35 40 45 50 55 60 h=84.5 km 27 57 87 117 147 177 207 2 4 6 8 10 12 14PE
R
IOD
(day
s)
0 5 10 15 20 25 30 35 40 45 50 55 60 h=81 km O N D J F M A2001
2002
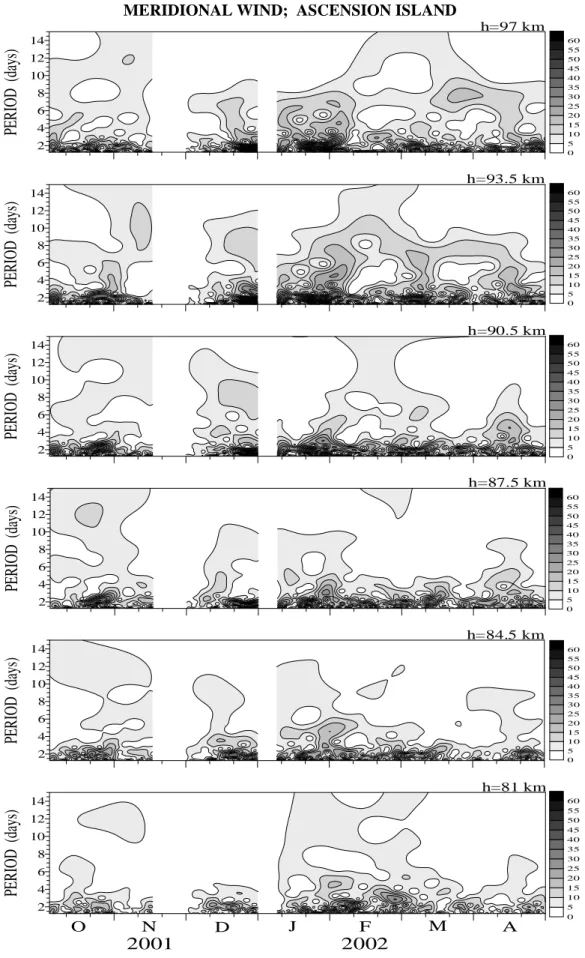
Fig. 2b
Fig. 2b. The same as Fig. 2a, but for the meridional wind.21
3-4-Day Wave; Zonal Wind (AI)
26 28 30 32 34 36 38 40 42 44 -100 -80 -60 -40 -20 0 20 40 60 VELO CITY (m/ s)
Mean Zonal Wind; Ascension Island
81.5 km 84.5 km 87.5 km 90.5 km 93.5 km 97 km 30 1 3 5 7 9 11 13 15 17 October November 2001 0 24 48 72 96 120 144 168 192 216 240 PERIOD (hours) 0 5 10 15 20 25 30 35 40 AM PLITU D E SP ECTRU M (m/ s)
Zonal Wind; Ascension Island (29.Oct.-16.Nov.2001)
95%
Fig. 3
Fig. 3. Variability of the mean zonal winds observed at six altitudes indi-cated by different colours (black for h=81 km; purple for h=84.5 km; blue for h=87.5 km; magenta for h=90.5 km; red for h=93.5 km and green for h=97 km) during the interval 29 Oct.– 16 Nov. 2001 (upper panel). Amplitude spectra of the zonal winds observed in the same time interval and calculated from the hourly data by the correloperi-odogram analysis. The examined peaks centred at 3 and 4 days are marked by arrows (bottom panel).
3.2 General picture of planetary wave activity between Oc-tober 2001 and April 2002
Figure 2a presents the wavelet transform of the hourly-mean zonal wind measured at six altitudes shown at the right up-per corner of each plot. The strongest oscillation observed at all altitudes is a 3–4-day wave evident at the end of Oc-tober/November 2001. Its amplitude increases with altitude and reaches a maximum of 42 m/s (the observed velocities are limited or“clipped” to be less than 36 m/s, in order to reduce the dynamic range at all altitudes for plotting pur-poses). At the end of October/November a 12–13-day wave is also evident at almost all altitudes. The next strong oscilla-tion evident at all altitudes is that observed in January/early February with a period of ∼ 6−7 days. Its amplitude reaches a maximum of 24 m/s at altitude 87.5 km. There are a few strong 2-day wave bursts, but they do not show coherent be-haviour with height. We will study in detail the 3–4-day wave evident at the end of October/November, 2001 and the 6–7-day wave in January/February 2002.
Figure 2b presents the wavelet transform of the mean meridional wind. The dominant feature of the meridional
wind component is the quasi-2-day wave. This seems to be present almost continuously, but the strongest bursts are ob-served mainly in December/January. The amplitude of the quasi-2-day wave reaches a maximum of 90 m/s (the ob-served velocities are clipped to be less than 60 m/s). We will study all 2-day wave bursts evident in the entire altitude range, but the results for only three of them (the strongest bursts) will be shown.
3.3 Zonal winds
3.3.1 3–4-day wave observed at the end of
Octo-ber/November 2001
The strongest oscillation observed in the zonal winds at the end of October/November, well apparent in Fig. 2a, is the 3–4-day wave. The upper plot of Fig. 3 shows the variabil-ity of the mean zonal winds observed at six altitudes, in-dicated by different colours (black for h=81 km; purple for h=84.5 km; blue for h=87.5 km; magenta for h=90.5 km; red for h=93.5 km and green for h=97 km; the same colour in-dications for different altitudes are used in all figures), dur-ing the end of October/November, 2001. The 3–4-day wave
22
3- and 4- Day Wave Characteristics; Zonal Wind (AI) 29 October – 16 November 2001 0 5 10 15 20 25 30 35 WAVE AMPLITUDE (m/s) 80 84 88 92 96 100 H E IG HT (k m )
96-Hour Wave (Zonal Wind) AI; (29.Oct.-16.Nov.2001) 4 6 8 10 12 14 16 18 WAVE AMPLITUDE (m/s) 80 84 88 92 96 100 H E IG HT (k m )
72-Hour Wave (Zonal Wind) AI; (29.Oct.-16.Nov.2001)
0 5 10 15 20 25 30 35 40 45 WAVE PHASE (UT) 80 84 88 92 96 100 H E IG HT (k m )
96-Hour Wave (Zonal Wind) Vertical wavelength = 39 km
5 10 15 20 25 30 35 WAVE PHASE (UT) 80 84 88 92 96 100 H E IG HT (k m )
72-Hour Wave (Zonal Wind) Vertical wavelength = 49 km
Fig. 4
Fig. 4. Least squares amplitude (up-per row) and phase (lower row) best fits for waves with periods 72 and 96 h ob-served during 29 Oct.–16 Nov. 2001. Error bars indicate the 67% confidence.
is well evident and its vertical propagation could be clearly noticed, especially around 7 November, when the wave is well developed at all altitudes. The amplitude spectra of the zonal winds at all altitudes observed in the time interval 29 October–16 November 2001 and calculated from the hourly data by the correloperiodogram analysis (Kopecky and Kuk-lin, 1971) are shown on the bottom plot. The spectra were calculated after the parabolic trend was removed. Two peaks are well indicated, a stronger one at 4 days and another at 3 days (both peaks are marked by arrows). The 95% con-fidence level for all altitudes are shown as well. The 4-day wave is very strong, even stronger than the diurnal tide during the investigated time interval, and its amplitude increases sig-nificantly with height. The vertical wavelength of the 3- and 4-day wave is estimated by the change in phase with height. To determine the amplitudes and phases of these waves, a best-fit procedure was applied to the mean hourly data of the above time interval studied. The height profiles of the ampli-tude and phase of the 4-day wave are shown on the left side of Fig. 4, while the respective profiles for the 3-day wave are shown on the right side of the same figure. Both waves are vertically propagating, and the vertical wavelength of the 4-day wave is found to be 39 km, while that of the 3-4-day wave is 49 km.
3.3.2 The 3- and 6-day waves observed in
Jan-uary/February 2002
The next oscillation that is outlined well in the wavelet spec-tra of the zonal winds (Fig. 2a) is the 6-7-day wave during January/February 2002. The upper plot of Fig. 5 shows the variability of the mean zonal winds observed at six altitudes during January/early February 2002. There are four well out-lined ∼6-day cycles, however, shorter period oscillations are also evident. The bottom plot of Fig. 5 shows the ampli-tude spectra calculated from the detrended hourly data in the interval 8 January–21 February 2002. It confirms the com-plicated character of the observed disturbances on the upper plot. Besides the peak at 6.2 days there is also a peak around 3.2 days (periods for the different altitudes are clustered be-tween 76-80 h), as well as an oscillation that is changeable (between 90–115 h) with height period. The applied best fit procedure included all three oscillations, however, the re-sult for the 4–5-day wave was not stable, probably because the period was too variable at different altitudes. The height profiles of the amplitude and phase of the 3.2-day wave are shown on the left side of Fig. 6, while the respective pro-files for the 6.2-day wave are shown on the right side of the same figure. Again, both waves are vertically propagating, and the vertical wavelength of the 3.2-day wave is 50 km, or the same as that found for the 3-day wave observed in
Octo-23
3-6-Day Wave; Zonal Wind (AI)
1 5 9 13 17 21 25 29 -60 -50 -40 -30 -20 -10 0 10 20 30 40 50 VELOCITY (m/s)
Mean Zonal Wind; Ascension Island
97 93.5 81 84.5 90.5 87.5 8 12 16 20 24 28 1 5 January 2002 February 0 24 48 72 96 120 144 168 192 216 240 PERIOD (hours) 0 5 10 15 20 25 30 35 AM PL ITUD E SPECTRUM (m /s)
Zonal Wind; Ascension Island (08.Jan.-21.Feb.2002)
95%
Fig. 5
Fig. 5. Variability of the mean zonal winds observed at six altitudes dur-ing the interval January/early February 2002 (upper panel). Amplitude spectra calculated from the hourly values of the zonal winds measured at six altitudes during the time interval 08 January-21 February (bottom panel). The exam-ined peaks centred at ∼3 and 6 days are marked by arrows.
ber/November 2001. The vertical wavelength of the 6.2-day wave, however, is much longer than that of the 3.2-day wave, and it is estimated to be 79 km.
3.4 Quasi-2-day wave in the meridional winds
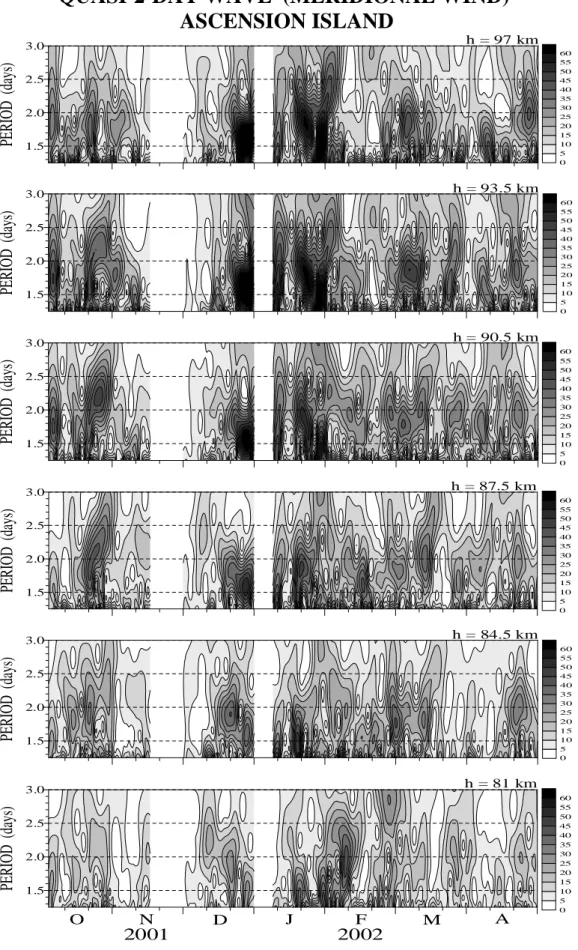
We will study the quasi-2-day wave observed only in the meridional winds because their amplitudes are at least two times larger than those in the zonal winds and because the observed oscillations in the zonal winds rarely show coher-ent behaviour with height (an exception is the quasi-2-day wave observed in the zonal winds at all altitudes during the end of December 2001). It is known from previous observa-tions that the period of the quasi-2-day wave changes mainly between 40 and 60 h. To study in detail the variability of the period of the 2-day wave, we perform again the wavelet transform on the hourly meridional wind but in the period range between 30 and 72 h. The result is shown in Fig. 7 (the observed velocities are again clipped to be less than 60 m/s). The period of the quasi-2-day wave observed above Ascen-sion Island during the time interval studied changes between 1.5 and 2.5 days. Several bursts centred around the second
half of October, the end of December, January/early Febru-ary, beginning of March and the end of April are well ap-parent at all altitudes. All of them are investigated but detail results will be shown only for the first three of them.
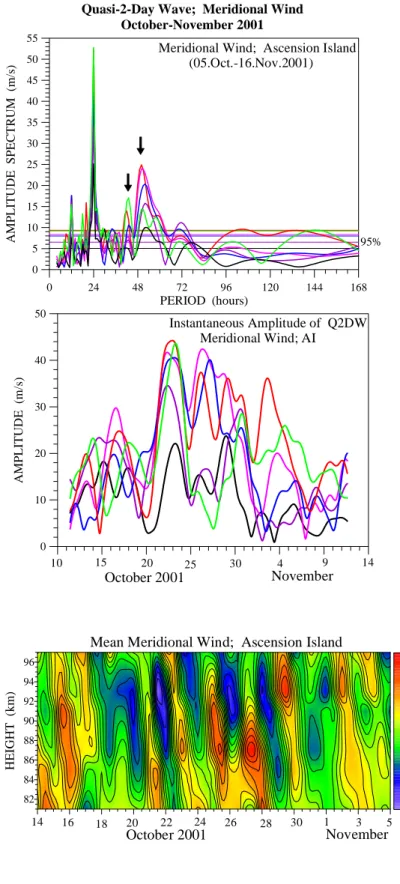
The upper plot of Fig. 8a shows the amplitude spectra for all altitudes calculated from the hourly meridional wind measured during 5 October–16 November 2001. Two peaks around 43 and 51 h are evident. To evaluate the temporal variation of the amplitudes of the quasi-2-day waves, the method of complex demodulation (Bloomfield, 1976) was applied. An effective band-pass filter was used with lim-its from 40 to 58 h for the 48-h demodulation period. The bottom plot of figure 8a shows the temporal variation of the instantaneous amplitudes of the quasi-2-day waves observed in the meridional wind at all altitudes. The waves are strong between 15 October–5 November 2001. Figure 8b shows the time-height cross section of the mean meridional wind ob-served during 15 Oct.–5 Nov. 2001. The quasi-2-day waves with amplitudes larger than 30 m/s and with downward phase velocity are well evident without any filtration of data. The vertical profiles of the amplitude and phase of the 51-h wave are shown on the left side of Fig. 9, while those of the 43-h
24
3- and 6-Day Wave Characteristics; Zonal Wind (AI) 08 January – 21 February 2002 0 2 4 6 8 10 12 14 WAVE AMPLITUDE (m/s) 80 84 88 92 96 100 H E IG HT (k m )
3.2-Day Wave (Zonal Wind) AI; (08.Jan.-21.Feb.2002) 0 4 8 12 16 20 WAVE AMPLITUDE (m/s) 80 84 88 92 96 100 H E IG HT (k m )
6-Day Wave (Zonal Wind) AI; (08.Jan.-21.Feb.2002)
40 50 60 70 80 90 WAVE PHASE (UT) 80 84 88 92 96 100 H E IG HT (k m )
3.2-Day Wave (Zonal Wind) Vertical wavelength = 50 km
100 110 120 130 140 150 160 WAVE PHASE (UT) 80 84 88 92 96 100 H E IG HT (k m )
6-Day Wave (Zonal Wind) Vertical wavelength = 79 km
Fig. 6
Fig. 6. Least-squares amplitude (upper row) and phase (lower row) best fits for waves with periods 3.2 and 6 days ob-served during 8 Jan.–21 Feb.2002.
wave are shown on the right side. The vertical wavelengths of both waves are very close, 31 km and 25 km for the 51-and 43-h wave, respectively.
According to Fig. 7 the strongest 2-day wave burst is ev-ident in the second half of December 2001, with a mean period shorter than 48 h. The upper plot of Fig. 10 shows the amplitude spectra of the meridional wind for December 2001. Two peaks in the quasi-2-day range are well evident. The stronger peak has a period of 40 h and its mean ampli-tude during the whole month is ∼25 m/s, however, the in-stantaneous amplitude found by complex demodulation or the amplitude from the wavelet transform reaches maximum of ∼90 m/s. The second peak is situated at 50 h with mean amplitude for the whole month of 14 m/s. The bottom plot of Fig. 10 shows the time-height cross section of the mean meridional wind between 16–31 December. Both waves can be distinguished from this plot. The longer period 2-day wave (∼50 h) is evident between 16–23 December, while the shorter one (∼40 h) can be observed later. The vertical slope of phase velocity for the 50-h wave is higher than that for the 40-h wave. The vertical profiles of the amplitude and phase of the 40-h wave are shown on the left side of Fig. 11, while those of the 50-h wave are shown on the right side. The vertical wavelengths of both waves are very different, 85 km and 26 km for the 40- and 50-h wave, respectively, a result that has been already noticed in the bottom plot of Fig. 10.
The last quasi-2-day wave case study shown in this pa-per is observed during January/February 2002. The wavelet spectra from Fig. 7 indicate that this event is very compli-cated and is composed of several different waves. The upper plot of Fig. 12 shows the amplitude spectra of the merid-ional wind calculated from the detrended data in the interval 8 January–7 February 2002. Five peaks are clearly indicated with periods 34, 43, 48, 54 and 67–70 h and the strongest peaks are those at 48 and 34 h. The bottom plot of Fig. 12 again shows the time-height cross section of the mean merid-ional wind observed in the studied interval. The variability of the meridional wind is very strong; it changes from north-ward 70 m/s to southnorth-ward –40 m/s. Downnorth-ward phase veloci-ties with different slopes are evident on this plot. The results from the best fit analysis only for the vertically upward prop-agating 2-day waves in the entire altitude range are shown in Fig. 13. These are waves with periods 34, 43, 48 and 54 h, while the result for the 67–70-h wave (not shown here) in-dicates vertically upward propagation only above 87–88 km. The vertical wavelengths of upward propagating 43-, 48- and 54-h waves are commensurable (with lengths, respectively, 47 km, 50 km and 48 km), while that for the 34-h wave is significantly shorter (31 km).
25
QUASI-2-DAY WAVE (MERIDIONAL WIND)
ASCENSION ISLAND
27 57 87 117 147 177 207 1.5 2.0 2.5 3.0PE
RIOD
(da
ys)
0 5 10 15 20 25 30 35 40 45 50 55 60 h = 97 km 27 57 87 117 147 177 207 1.5 2.0 2.5 3.0PER
IOD (d
ay
s)
0 5 10 15 20 25 30 35 40 45 50 55 60 h = 93.5 km 27 57 87 117 147 177 207 1.5 2.0 2.5 3.0PER
IOD
(d
ay
s)
0 5 10 15 20 25 30 35 40 45 50 55 60 h = 90.5 km 27 57 87 117 147 177 207 1.5 2.0 2.5 3.0PE
R
IOD
(
day
s)
0 5 10 15 20 25 30 35 40 45 50 55 60 h = 87.5 km 27 57 87 117 147 177 207 1.5 2.0 2.5 3.0PER
IOD (d
ay
s)
0 5 10 15 20 25 30 35 40 45 50 55 60 h = 84.5 km 27 57 87 117 147 177 207 1.5 2.0 2.5 3.0PER
IOD
(d
ay
s)
0 5 10 15 20 25 30 35 40 45 50 55 60 h = 81 km O N D J F M A2001
2002
Fig. 7
Fig. 7. Wavelet transform of the meridional wind observed by meteor radar in the interval 05 Oct. 2001–30 Apr. 2002. The spectra are calculated in the period interval 30–72 h and for six altitudes.
26
Quasi-2-Day Wave; Meridional Wind October-November 2001 0 24 48 72 96 120 144 168 PERIOD (hours) 0 5 10 15 20 25 30 35 40 45 50 55 AMP L ITUDE S P E C TRUM (m /s)
Meridional Wind; Ascension Island (05.Oct.-16.Nov.2001) 95% 5 10 15 20 25 30 35 40 0 10 20 30 40 50 A M PL IT UD E (m/ s) Instantaneous Amplitude of Q2DW Meridional Wind; AI 10 15 20 25 30 4 9 14 October 2001 November Fig. 8a
Fig. 8a. Amplitude spectra calculated from the hourly values of the merid-ional winds measured at six altitudes during the interval 5 Oct.–16 Nov. 2001 (upper panel). The studied peaks cen-tred at 43 and 51 h are marked by ar-rows. Amplitudes of the quasi-2-day waves obtained by the complex demod-ulation method and observed at six dif-ferent altitudes are shown on the lower panel. 27 10 12 14 16 18 20 22 24 26 28 30 32 82 84 86 88 90 92 94 96 H E IGHT (km ) -40 -30 -20 -10 0 10 20 30
Mean Meridional Wind; Ascension Island
14 16 18 20 22 24 26 28 30 1 3 5
October 2001 November
Fig. 8b
Fig. 8b. Time-height cross section of the mean meridional wind observed during 15 Oct.–5 Nov. 2001. The quasi-2-day waves with downward phase ve-locity are well evident.
4 Discussion
The first results of the planetary wave characteristics ob-served by meteor radar above Ascension Island during Oc-tober 2001–April 2002 are reported in this paper. Two “case studies” of 3–7-day waves observed in the zonal wind and
several 2-day wave bursts in the meridional wind are de-scribed in detail.
Wavelet analysis of motions in the 3–10 day period range shows a predominance of energy in the zonal component (Fig. 2). This behaviour is frequently ascribed to the pres-ence of Kelvin waves in the equatorial atmosphere. Kelvin
28
Quasi-2-Day Wave Characteristics; Meridional Wind (AI) October – November 2001 0 5 10 15 20 25 30 35 WAVE AMPLITUDE (m/s) 80 84 88 92 96 100 H E IG HT (k m )
51-Hour Wave (Meridional Wind) AI; (15.Oct.-05.Nov.2001) 0 5 10 15 20 25 WAVE AMPLITUDE (m/s) 80 84 88 92 96 100 H E IG HT (k m )
43-Hour Wave (Meridional Wind) AI; (15.Oct.-05.Nov.2001)
5 10 15 20 25 30 35 40
WAVE PHASE (UT)
80 84 88 92 96 100 H E IG HT (k m )
51-Hour Wave (Meridional Wind) Vertical wavelength = 31 km
0 5 10 15 20 25 30 35
WAVE PHASE (UT)
80 84 88 92 96 100 H E IG HT (k m )
43-Hour Wave (Meridional Wind) Vertical Wavelength = 25 km
Fig. 9
Fig. 9. Least-squares amplitude (up-per row) and phase (lower row) best fits for waves with periods 51 and 43 h ob-served during 15 Oct.–5 Nov. 2001
waves are equatorially trapped, eastward propagating waves that cause oscillations in the zonal wind component only (Andrews et al., 1987). In the longitude-height plane Kelvin waves have the structure of buoyancy waves (Holton, 1992). They have downward (in time) and eastward (in space) phase propagation, which implies upward propagation of energy. The zonal and vertical scales are related to the frequency of Kelvin waves through the dispersion relation of two-dimensional gravity waves. Most of their variance is found in zonal wave numbers 1–3. They occur in three discrete speed ranges or, equivalently, three frequency bands. They are defined as: (i) “slow” (or Wallace-Kously) waves, with a phase speed range of 20-40 m/s (or period range 12–20 days) and vertical wavelength of about 10 km (Wallace and Kousky, 1968); (ii) “fast” waves, with a phase speed of 50– 80 m/s (period range 6–10 days) and vertical wavelength of ∼20 km (Hirota, 1978), and (iii) “ultra-fast” waves with a phase speed ∼120 m/s (period range 3-4 days) and vertical wavelength of 40-50 km (Salby et al., 1984; Forbes, 2000).
Figure 3 shows a very strong 3–4-day wave event observed at the end of October and November, unfortunately incom-plete because of an interruption in data gathering after 16 November. Spectral analysis shows that this event is com-posed of two waves: 3- and 4-day waves with increasing height amplitudes, reaching values of 15 m/s and 32 m/s, re-spectively. Figure 5 presents a “case study” of a 6-7-day wave event observed in January/February, composed of three different waves: 3.2-, 4–5- and 6-day waves. The vertical wavelengths of the 3- and 3.2-day waves are 49 and 50 km,
respectively, and they are observable only in the zonal wind component. We are not able to study the zonal structure of these waves, because we have measurements only at a sin-gle point, but the obtained vertical wavelengths and the fact that these 3- and 3.2-day waves exist only in the zonal com-ponent suggests the signature of an ultra-fast Kelvin wave. A few papers published recently have been devoted to the observational characteristics of the ultra-fast Kelvin waves and especially to their vertical wavelength. Vincent (1993) found that over Christmas Island the 3.5-day Kelvin wave has a mean vertical wavelength of ∼ 65 km and later Ko-valam et al. (1999), investigating longer period observations at the same place, clarified that the vertical wavelength varies between 53 and 88 km. Riggin et al. (1997) investigated the waves with a period of ∼ 3 days over Christmas Island and Jakarta during January-October 1993 and found that they have very long vertical wavelengths. This probably suggests that the wave was predominantly a zonal wave number 1. Sridharan et al. (2002) found that the vertical wavelength for the 3.2–3.7-day wave observed over Tirunelveli lies mostly in the range 30–60 km. Despite the relatively short data set, the obtained results in this paper for the vertical wavelength of the 3- and 3.2-day waves are in reasonable accord with earlier observations and are very close to the numerical mod-elling results (Forbes, 2000). The 4-day wave with amplitude larger than 30 m/s is the strongest wave observed in the zonal wind during the studied time interval. The estimated vertical wavelength is 39 km. It resembles the typical wavelengths of the ultra-fast Kelvin wave (Salby et al., 1984). As
sim-29
Quasi-2-Day Wave; Meridional Wind (AI) December 2001 0 24 48 72 96 120 144 168 PERIOD (hours) 0 5 10 15 20 25 30 AM PLIT U D E SP ECTRUM (m/s)
Meridional Wind; Ascension Island (01-31 December 2001) 95% 16 17 18 19 20 21 22 23 24 25 26 27 28 29 30 TIME (16 - 31 December 2001) 82 84 86 88 90 92 94 96 HEIGHT (km) -50 -40 -30 -20 -10 0 10 20 30 40 50
Mean Meridional Wind; Ascension Island
Fig. 10
Fig. 10. Amplitude spectra calcu-lated from the hourly values of the meridional winds measured at six alti-tudes during the interval 1–31 Decem-ber 2001 (upper panel). The investi-gated peaks centered at 40 and 50 h are marked by arrows. Time-height cross section of the mean meridional wind observed during 15–31 Dec. 2001 is shown on the lower panel.
ilar waves are completely absent in the meridional wind at the end of October/November, we may assume that the 4-day wave is an ultra-fast Kelvin wave. However, the 4-4-day wave could also be a normal (2,1) mode. Isoda et al. (2002) observed a 4-day wave above Pontianak and Christmas Is-land during the July/August period, which was identified as a global-scale westward propagating normal mode with zonal wave number 2. As we do not have any information about the zonal structure of this wave, in order to check these two possibilities, we can use some information about the plane-tary wave activity in the stratosphere. The preliminary anal-ysis of United Kingdom Meteorological Office (UKMO) as-similated geopotential height at 1 hPa pressure level (altitude of about 50 km) for 2001 above the equator does not show substantial amplification of the 4-day eastward propagating wave with zonal wave number 1 (A. Pogoreltsev, private communication). At the same time there is some amplifica-tion of the normal mode (2,1) 4-day wave at mid-latitudes in November. According to Pogoreltsev et al. (2002) it suggests that this mode could be observed in the zonal wind at the low latitude MLT region as well. If the normal (2,1) mode 4-day wave exists in the geopotential height at the mid-latitude stratosphere it could also be observed in the meridional mid-latitude MLT region (Pogoreltsev et al., 2002). The
prelimi-nary analysis of the meridional wind at Collm (52◦N) and at the high latitude station ESRANGE (68◦N), however, does not show the presence of 4-day wave in November. We have to mention, however, that the UKMO data are daily averaged data and are not so reliable for studying the 4-day wave. Con-sequently, on the basis of available information for the 4-day wave observed at the end of October/November, we cannot make a firm decision about the origin of this wave. It resem-bles the ultra-fast Kelvin wave with respect to its very large amplitude (more than 30 m/s) and to its short vertical wave-length (usually the normal mode planetary waves have larger than 40 km vertical wavelength). Such Kelvin waves, how-ever, have not been found in the equatorial stratosphere (A. Pogoreltsev, private communication).
The significant role of the equatorial Kelvin waves in pro-ducing the zonal mean eastward flow was mentioned above. The zonal eastward acceleration is given by the convergence of the vertical flux of horizontal momentum. Following the approach of Kovalam et al. (1999) (actually based on the Rig-gin et al., 1997 method) we made some preliminary calcula-tions for the body force per unit mass for the 3- and 3.2-day waves which are interpreted here as ultra-fast Kelvin waves. It was found that the eastward forcing provided by these waves around height 93.5 km is, respectively, ∼0.24
30
Qasi-2-Day Wave Characteristics; Meridional Wind (AI) 15 – 31 December 2001 0 10 20 30 40 50 60 WAVE AMPLITUDE (m/s) 80 84 88 92 96 100 HEI GHT (k m )
40-Hour Wave (Meridional Wind) AI; (15-31 December 2001) 0 2 4 6 8 10 12 14 16 18 20 WAVE AMPLITUDE (m/s) 80 84 88 92 96 100 H E IG HT (k m )
50-Hour Wave (Meridional Wind) AI; (15-31 December 2001)
14 15 16 17 18 19 20 21 22 23 24
WAVE PHASE (UT)
80 84 88 92 96 100 H E IG HT (k m )
40-Hour Wave (Meridional Wind) Vertical wavelength = 85 km
15 20 25 30 35 40 45 50
WAVE PHASE (UT)
80 84 88 92 96 100 H E IG HT (k m )
50-Hour Wave (Meridional Wind) Vertical wavelength = 26 km
Fig. 11
Fig. 11. Least-squares amplitude (up-per row) and phase (lower row) best fits for waves with periods 40 and 50 h ob-served during 15–31 Dec. 2001.
and ∼ 0.21 m/s−1day−1; consequently, it is not sufficient enough to produce net eastward motion of the background at-mosphere. If we assume that the 4-day wave observed at the end of October/November can be interpreted as an ultra-fast wave number 1 Kelvin wave, then its mean eastward forc-ing is significantly stronger, ∼ 1.33 m/s−1day−1, and could play some role in the momentum budget. This eastward ac-celeration is similar to that found by Kovalam et al. (1999) for Pontianak in May 1996 and significantly stronger than monthly mean accelerations obtained for Christmas Island. This acceleration is also stronger than the monthly mean ac-celerations found by Sridharan et al. (2002) for Tirunelveli.
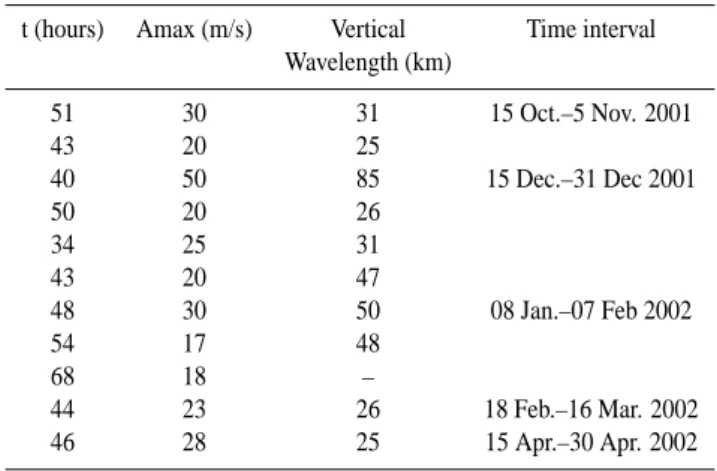
The 6-day wave observed in January/February has a max-imum amplitude of 16–18 m/s at heights below 90 km and a very large vertical wavelength of 79 km. This large wave-length does not correspond to the Kelvin wave interpreta-tion. The zonal wave number 1 fast Kelvin waves have an intrinsic phase speed of less than 100 m/s, which means ver-tical wavelengths shorter than 25–30 km. Therefore, proba-bly the observed 6-day wave is a Doppler-shifted 5-day nor-mal mode. The summarised characteristics of the quasi-2-day wave bursts observed in the meridional wind are pre-sented in Table 1. This wave seems to be present almost continuously, but the strongest bursts are observed mainly in December and January (Fig. 7). The 2-day waves are a dom-inant feature of the meridional wind above Ascension Island, indicating the upward transport of energy. The events con-sidered here are evident very well without any filtering of the data. The observed period range is large, from 34 to 68 h,
with some clustering around 43–44 and 50 h. Similar re-sults were obtained by earlier observations. Harris and Vin-cent (1993) found that the predominant periods above Christ-mas Island are 44 and 50 h, but in January/February the pe-riod shifts to 48 h. Gurubaran et al. (2001) obtained pepe-riods between 46 and 53 h over Tirunelveli with seasonal depen-dence. The earlier calculations of the vertical wavelength during the solstices (from the rate of change of phase with height) are found to range from 20 to more than 150 km. Our estimates for the vertical wavelength indicate shorter lengths during the equinoxes, in the range of 25–30 km, and longer ones, ∼ 40–50 km, in January/February, when the 48-h wave is t48-he strongest. Craig et al. (1980) found recurring vertical wavelength of ∼ 50 km observed above Townsville (19◦S, 147◦E) during December/January. Palo and Avery (1995) also found similar results for the vertical wavelength of the quasi-2-day wave in January/February above Christ-mas Island; it varies between 36 and 44 km when the period approaches 48 h. Although the zonal wave number cannot be determined from a single station, the lack of power in the zonal wind near 48 h in January/February and the esti-mated similar vertical wavelengths apparent at other equa-torial sites are consistent with the (3,0) Rossby-gravity nor-mal mode associated with the quasi-2-day wave. Harris and Vincent (1993), however, reported a longer, ∼70 km, mean vertical wavelength observed in December above Christmas Island. We also a observed very strong 40-h wave with very large (85 km) vertical wavelength in December, but we found at this time a 50-h wave with very short (26 km) vertical
31
Quasi-2-Day Wave; Meridional Wind (AI) January – February 2002 0 24 48 72 96 120 144 168 PERIOD (hours) 0 5 10 15 20 25 30 35 40 AMP L IT UD E SP EC TR UM ( m /s )
Meridional Wind; Ascension Island (08.Jan.-07.Feb.2002) 95% 8 12 16 20 24 28 82 84 86 88 90 92 94 96 HE IG H T (k m ) -40 -30 -20 -10 0 10 20 30 40 50 60 70
Mean Meridional Wind; Ascension Island
15 19 23 27 31 4 8
January 2002 February
Fig. 12
Fig. 12. Amplitude spectra calculated from the hourly values of the merid-ional winds measured at six altitudes during the interval 8 Jan.–7 Feb. 2002 (upper panel). The investigated peaks centred at 34, 43, 48, 54 and 67–70 h are marked by arrows. Time-height cross section of the mean meridional wind observed during 15 Jan.–7 Feb. 2002 is shown on the lower panel.
wavelength as well. We cannot interpret the 40- and 50-h waves observed in December now; we can mention only that there is some power in the zonal wind as well, but only at period 40 h (Fig. 2a and an additional spectral analysis not shown here).
As mentioned before, the quasi-2-day wave event in Jan-uary/February is very complicated and is composed of sev-eral different waves (upper plot of Fig. 12). The 48-hour wave with vertical wavelength of 50 km was interpreted as a (3,0) Rossby-gravity normal mode. We also found that at the same time the zonal wind is dominated by the 6-day wave with vertical wavelength 79 km which was associated with a Doppler-shifted 5-day normal mode. If we assume that there is a nonlinear interaction between both waves, then the sum secondary wave has to have a period of 35 h and a vertical wavelength of 30.6 km, while the difference secondary wave has, respectively, 72 h and 135 km. In our case we observe a very strong 34-h wave with vertical wavelength of 31 km (the same as the sum secondary wave) and a moderate 67–70-h wave wit67–70-h upward propagation but only above 87–88 km. Therefore, this is a signature that at least the 34-h wave ob-served in January/February could be interpreted as a s sum socondary wave.
Table 1. Characteristics (period, maximum amplitude and vertical wavelength) of the quasi-2-day wave observed at Ascension Island (AI) during the interval 05 October 2001–30 April 2002.
t (hours) Amax (m/s) Vertical Time interval Wavelength (km) 51 30 31 15 Oct.–5 Nov. 2001 43 20 25 40 50 85 15 Dec.–31 Dec 2001 50 20 26 34 25 31 43 20 47 48 30 50 08 Jan.–07 Feb 2002 54 17 48 68 18 – 44 23 26 18 Feb.–16 Mar. 2002 46 28 25 15 Apr.–30 Apr. 2002
Another interesting feature observed in the meridional wind during the amplification of the quasi-2-day wave is the anti-correlation between the 2-day wave and the diurnal tide (Harris and Vincent, 1993; Gurubaran et al., 2001). Very
32
Quasi-2-Day Wave Characteristics; Meridional Wind (AI) 08 January – 07 February 2002 0 5 10 15 20 25 WAVE AMPLITUDE (m/s) 80 84 88 92 96 100 HE IG HT (k m )
34-Hour Wave (Meridional Wind) AI; (08.Jan.-07.Feb.2002) 0 5 10 15 20 25 WAVE AMPLITUDE (m/s) 80 84 88 92 96 100 H E IG HT (k m )
43-Hour Wave (Meridional Wind) AI; (08.Jan.-07.Feb.2002) 0 5 10 15 20 25 30 WAVE AMPLITUDE (m/s) 80 84 88 92 96 100 H E IG HT (k m )
48-Hour Wave (Meridional Wind) AI; (08.Jan.-07.Feb.2002) 0 2 4 6 8 10 12 14 WAVE AMPLITUDE (m/s) 80 84 88 92 96 100 H E IG HT (km )
54-Hour Wave (Meridional Wind) AI; (08.Jan.-07.Feb.2002)
0 4 8 12 16 20 24 WAVE PHASE (UT) 80 84 88 92 96 100 H E IG HT (k m )
34-Hour Wave (Meridional Wind) Vertical wavelength = 31 km
0 5 10 15 20 25 30 35 40 WAVE PHASE (UT) 80 84 88 92 96 100 H E IG HT (km )
43-Hour Wave (Meridional Wind) Vertical wavelength = 47 km
15 20 25 30 35 40 WAVE PHASE (UT) 80 84 88 92 96 100 H E IG HT (km )
48-Hour Wave (Meridional Wind) Vertical wavelength = 50 km
20 25 30 35 40 45 50 55 WAVE PHASE (UT) 80 84 88 92 96 100 H E IG HT (km )
54-Hour Wave (Meridional Wind) Vertical wavelength = 48 km
Fig. 13
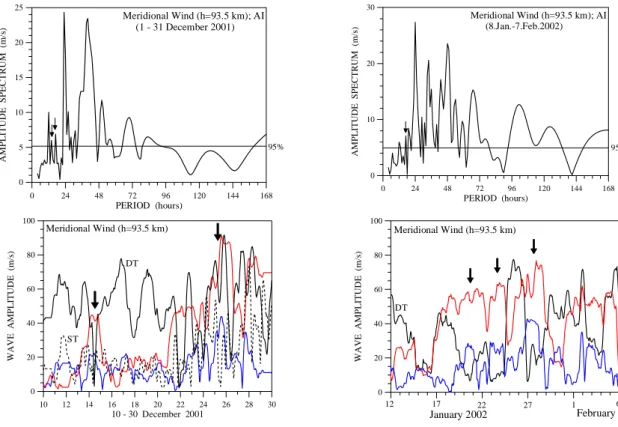
Fig. 13. Least-squares amplitude (upper row) and phase (lower row) best fits for waves with periods 34, 43, 48 and 54 h observed during 8 Jan.–7 Feb. 2002. 33 0 24 48 72 96 120 144 168 PERIOD (hours) 0 5 10 15 20 25 AMP L IT UD E SPE CTRU M ( m /s ) 95% Meridional Wind (h=93.5 km); AI (1 - 31 December 2001) 0 24 48 72 96 120 144 168 PERIOD (hours) 0 10 20 30 A M PLITU D E SPE C T RUM (m /s ) 95% Meridional Wind (h=93.5 km); AI (8.Jan.-7.Feb.2002) 10 12 14 16 18 20 22 24 26 28 30 10 - 30 December 2001 0 20 40 60 80 100 WAVE AMP L ITUD E (m /s) Meridional Wind (h=93.5 km) DT ST 5 10 15 20 25 30 0 20 40 60 80 100 W A VE A M P L IT UD E (m /s ) Meridional Wind (h=93.5 km) DT 12 17 22 27 1 6 January 2002 February Fig. 14
Fig. 14. Amplitude spectrum of the meridional wind observed from 1–31 December 2001 for altitude 93.5 km. Marked by arrows peaks have periods respectively 14.5 and 17 h (upper left plot). Variability of the amplitudes of the diurnal (black solid line) and semidiurnal (black dashed line) tides obtained by the best fit procedure and the amplitudes of the 40-h (red line) and 16-h (blue line) waves obtained by the complex demodulation method (bottom left plot). Amplitude spectrum of the meridional wind observed in 8 January–7 February 2002 for altitude 93.5 km (upper right plot). Variability of the amplitudes of diurnal tide (black solid line), 48- (red line) and 16-h (blue line) waves obtained by the best fit procedure (bottom right plot).
often the enhanced 2-day wave activity is accompanied by weak diurnal tide and vice versa. Usually the 16-h oscillation is also apparent. The upper left plot of Fig. 14 shows the am-plitude spectrum of the meridional wind observed in Decem-ber for altitude 93.5 km. The 40-h wave was the strongest 2-day wave observed in this interval. If there is a coupling between the 40-h wave, on the one hand, and the diurnal (DT) and semidiurnal (ST) tides on the other, the secondary waves should have periods, respectively, of 15 and 17 h. Peaks with periods 14.5 and 17 h marked by arrows can be found in the spectrum. The bottom left plot shows the variability of the amplitudes of the diurnal (black solid line) and semidiurnal (black dashed line) tides obtained by the best fit procedure described in Sect. 2. There are also the amplitudes of the 40-h (red line) and 16-h (blue line) waves obtained by the complex demodulation method (we cannot separate 15- and 17-h waves). The variability of the 16-h wave is very sim-ilar to that of the 40-h wave and usually their amplification is accompanied by a rapid decrease in the tidal amplitudes (shown by thick arrows). The right plots of the figure show a similar example observed, however, in January/February. The amplitude spectrum of the meridional wind observed at height 93.5 km shows a strong 16-h wave that is a secondary wave generated by the DT and the 48-h wave (in this case the ST is very weak with amplitude even smaller than that of the 16-h wave). The bottom plot shows the variability of the DT, 48- and 16-h waves. Again, a clear anti-correlation is evi-dent between the variability of the DT and the variability of the 48- and 16-h waves. These results support the suggestion that the secondary wave (16-h wave) grows at the expense of the DT.
5 Conclusion
The first observations reported in this work provide addi-tional information about the characteristics of the planetary waves (1.5–10 days) measured by meteor radar at a differ-ent geographical location. The overall characteristics of the waves observed above Ascension Island are found to be gen-erally in accord with the observations in other equatorial lo-cations. The zonal wind is dominated by the 3–7-day waves, while the meridional component by the quasi-2-day wave. Two wave events in the zonal wind are studied in detail: 3–4-day wave observed at the end of October/November and the 3–6-day wave in January/February. The moderate 3- and 3.2-day waves are interpreted as an ultra-fast Kelvin wave, while for the strong 4-day wave we are not able to make a firm de-cision. It resembles the ultra-fast Kelvin wave with respect to its very large and increasing height amplitude (the amplitude larger than 30 m/s is hardly typical for the normal modes) and short vertical wavelength (usually the normal mode plan-etary waves have a greater than 40 km vertical wavelength). But such Kelvin waves have not been found in the equatorial stratosphere (A. Pogoreltsev, private communication). The 6-day wave is interpreted as a Doppler-shifted 5-day normal mode due to its very large vertical wavelength (79 km). The
quasi-2-day wave seems to be present almost continuously in the meridional wind, but the strongest bursts are observed mainly in December and January. The observed period range is large, from 34 to 68 h, with some clustering around 43–44 and 50 h. The estimated vertical wavelengths indicate shorter lengths during the equinoxes, in the range of 25–30 km, and longer ones, ∼40–50 km, in January/February, when the 48-h wave is t48-he strongest wave. To clarify t48-he origin of t48-he quasi-2-day wave we need simultaneous observations at sev-eral equatorial sites accompanied by numerical modelling us-ing realistic conditions.
Acknowledgements. Topical Editor Ulf-Peter Hoppe thanks a ref-eree for her/his help in evaluation his paper.
References
Andrews, D. G., Holton, J. R. and Leovy, C. B.: Middle Atmo-sphere Dynamics, Academic Press, New York, 1987.
Bloomfield, P.: Fourier Analysis of Time Series: An Introduction, John Wiley, New York, 1976.
Burks, D. and Leovy, C. B.: Planetary waves near the mesospheric easterly jet, Geophys. Res. Lett., 13, 193–196, 1986.
Coy, L.: A possible 2-day wave oscillation near the tropical stratopause, J. Atmos. Sci., 36, 1615–1618, 1979.
Craig, R. L., Vincent, R. A., Fraser, R. I., and Muller, H. G.: The quasi-2-day wave in the Southern Hemisphere mesosphere, Na-ture, 289, 319–320, 1980.
Dunkerton, T. J.: On the role of the Kelvin wave in the westerly phase of the semiannual zonal wind oscillation, J. Atmos. Sci., 36, 32–41, 1979.
Dunkerton, T. J.: Theory of mesopause semiannual oscillation, J. Atmos, Sci., 39, 2681–2690, 1982.
Dunkerton, T. J.: The role of gravity waves in the quasi-biennial oscillation, J. Geophys. Res., 102, 26 053–26 076, 1997. Ebdon, R. A.: Notes on the wind flow at 50 mb in tropical and
sub-tropical regions in January 1957 and January 1958, Q. J. R. Me-teorol. Soc., 86, 540–543, 1960.
Forbes, J. M.: Wave coupling between the lower and upper atmo-sphere: case study of an ultra-fast Kelvin wave, J. Atmos. Sol.-Terr. Phys., 62, 1603–1621, 2000.
Garcia, R. R., Dunkerton, T. J., Lieberman, R. S., and Vincent, R. A.: Climatology of the semiannual oscillation of the tropical middle atmosphere, J. Geophys. Res., 102, 26 019–26 032, 1997. Gurubaran, S., Sridharan, S., Ramkumar, T. K., and Rajaram, R.: The mesospheric quasi-2-day wave over Tirunelveli (8.7◦N), J. Atmos. Sol.-Terr. Phys., 63, 975–985, 2001.
Hagan, M. E., Forbes, J. M., and Vial, F. : Numerical investiga-tion of the propagainvestiga-tion of the quasi- 2-day wave into the lower thermosphere, J. Geophys. Res., 98, 23 193–23 205, 1993. Hamilton, K. P.: Rocketsonde observations of the mesospheric
semiannual oscillations at Kwajalein, Atmos-Oceans., 20, 281– 286, 1982.
Harris, T. J. and Vincent, R. A.: The quasi-2-day wave observed in the equatorial middle atmosphere, J. Geophys. Res., 98, 10 481– 10 490, 1993.
Hirota, I.: Equatorial waves in the upper stratosphere and meso-sphere in relation to the semiannual oscillation of the zonal wind, J. Atmos. Sci., 35, 714–722, 1978.
Hitchman, M. H. and Leovy, C. B.: Estimation of the Kelvin wave contibution to the semiannual oscillation, J. Atmos. Sci., 45, 1462–1475, 1988.
Holton, J. R.: Introduction to Dynamic Meteorology, 3rd Ed., Aca-demic Press, 1992.
Isoda, F., Tsuda, T., Nakamura, T., Murayama, Y., Igarashi, K., Vincent, R. A., Reid, I. M., Nurayanto, A., and Manurung, S. L.: Long-period wind oscillations in the mesosphere and lower thermosphere at Yamagawa (32◦N, 131◦E), Pontianak (0◦N, 109◦E) and Christmas Island (2◦N, 157◦W), J. Atmos. Sol.-Terr. Phys., 64, 1055–1067, 2002.
Kopecky, M. and Kuklin, G.: About 11-year variation of the mean life duration of a group sun spots, Issled. Geomagn. Aeronom. Foz. Solntsa, 2, 167, 1971.
Kovalam, S., Vincent, R. A., Reid, I. M., Tsuda, T., Ohnishi, K., Nuryanto, A., and Wiryosumarto, H.: Longitudinal variations in planetary wave activity in the equatorial mesosphere, Earth Plan-ets Space, 51, 665–674, 1999.
Lieberman, R. S. and Riggin, V.: High resolution Doppler im-ager observations of Kelvin waves in the equatorial mesosphere and lower thermosphere, J. Geophys, Res., 102, 26 117–26 130, 1997.
Lieberman, R. S.: Eliassen-Palm Fluxes of the 2-day wave, J. At-mos. Sci., 56, 2846–2861, 1999.
Lindzen, R. S. and Holton, J. R.: A theory of the quasi-biennial oscillation, J. Atmos. Sci., 25, 1095–1107, 1968.
Mitchell, N. J., Pancheva, D., Middleton, H., and Hagan, M.: Mean winds and tides in the Arctic mesosphere/lower thermosphere re-gion and comparison with the GSWM, J. Geophys. Research., 107, A1, 2002.
Meek, C. E., Manson, A. H., Franke, S. J., Singer, W., Hoffmann, P., Clark, R. R., Tsuda, T., Nakamura, T., Hagan, M., Fritts, D. C., Isler, J., and Portnyagin, Y.: Global Study of northern hemi-sphere quasi-2-day wave events in recent summers near 90 km altitude, J. Atmos. Terr. Phys., 58, 1401–1411, 1996.
Muller, H. G.: Long-period meteor wind oscillations, Philos. Trans., Roy. Soc. London, 271, 585–598, 1972.
Muller, H. G. and Nelson, L.: A travelling quasi-2-day wave in the meteor region, J. Atmos. Terr. Phys., 40, 761–766, 1978. Palo, S. E. and Avery, S. K.: Observations of the meridional
quasi-two-day wave in the mesosphere and lower thermosphere at Christmas Island. The Upper Mesosphere and Lower Thermo-sphere: A Review of Experiment and Theory, Geophys. Monogr. Series, No 87, Amer. Geophys. Union, 101–110, 1995.
Pancheva, D. and Mukhtarov, P. : Wavelet analysis on transient be-haviour of tidal amplitude fluctuations observed by meteor radar in the lower thermosphere over Bulgaria, Ann. Geophysicae., 18, 316–331, 2000.
Pfister, L.: Baroclinic instability of easterly jets with applications to the summer mesosphere, J. Atmos. Sci., 42, 313–330, 1985. Plumb, R. A.: Baroclinic instability of the summer mesosphere: a
mechanism for the quasi-two-day wave? J. Atmos. Sci., 40, 262– 270, 1983.
Plumb, R. A., Vincent, R A., and Craig, R. L.: The quasi-2-day wave event of January 1984 and its impact on the mean meso-spheric circulation, J. Atmos. Sci., 44, 3030-3036, 1987. Pogoreltsev, A. I., Fedulina, I. N., Mitchell, N. J., Muller, H. G.,
Luo, Y., Mekk, C. E., and Manson, A. H.: Global free oscil-lations of the atmosphere and secondary planetary waves in the
MLT region during August/September 1993 time conditions, J. Geophys. Res., doi: 10.1029/2001JD001535, 2002.
Raghava Reddi, C., Geetha, A., and Lekshmi, K. R.: Quasi-2-day wave in the middle atmosphere over Trivandrum, Ann. Geophys., 6, 231–238, 1988.
Reed, R. J.: Some features of the annual temperature regime in the tropical stratosphere, Mon. Wea. Rev., 90, 211–215, 1962. Riggin, D., Fritts, D. C., Tsuda, T., Nakamura, T., and Vincent,
R. A.: Radar observations of a 3- day Kelvin wave in the equato-rial mesosphere, J. Geophys, Res., 102, 26 141–26 157, 1997. Rodgers, C. D. and Prata, A. J.: Evidence for a travelling 2-day
wave in the middle atmosphere, J. Geophys. Res., 86, 9661– 9664, 1981.
Salby, M. L. and Roper, R.: Long-period oscillations in the meteor region, J. Atmos. Sci., 37, 237–244, 1980.
Salby, M. L.: The 2-day wave in the middle atmosphere: Observa-tion and theory, J. Geophys. Res., 86, 9654–9660, 1981. Salby, M. L., Hartmann, D. L., Bailey, P. L., and Gille, J. C.:
Evi-dence for equatorial Kelvin modes in Nimbus-7 LIMS, J. Atmos. Sci., 41, 220–235, 1984.
Smith, A.: Observation of low frequency Kelvin waves in the meso-sphere, Earth Planets Space, 51, 649–656, 1999.
Sridharan, S., Gurubaran, S., and Rajaram, R.: Radar observations of the 3.5-day ultra-fast Kelvin wave in the low-latitude meso-sphere region, J. Atmos. Sol-Terr. Phys., 64, 1241–1250, 2002. Thayaparan, T., Hocking, W. K., and MacDougall, J.: Amplitude,
phase and period variations of the quasi-2-day wave in the meso-sphere and lower thermomeso-sphere over London, Canada (43◦N, 81◦W), during 1993 and 1994. J. Geophys. Res., 102, 9461– 9478, 1997a.
Thayaparan, T., Hocking, W. K., MacDougall, J., Manson, A. H., and Meek, C. E.: Simultaneous observations of the 2-day wave at London (43◦N, 81◦W) and Saskatoon (52◦N, 107◦W) near 91 km altitude during the two years of 1993 and 1994. Ann. Geo-phys., 15, 1324–1339, 1997b.
Torrence, C. and Compo, G.: A practical guide to wavelet analysis, Bull. Amer. Meteor. Soc., 79, 61–78, 1998.
Tsuda, T., Kato, S., and Vincent, R. A.: Long period oscillations observed by the Kyoto meteor radar and comparison of the quasi-2-day wave with Adelaide MF radar observations, J. Atmos. Terr. Phys., 50, 225–230, 1988.
Vincent, R. A.: Low frequency dynamics of the equatorial meso-sphere, in: Coupling Processes in the Lower and Middle Atmo-sphere, edited by Trane, E. V. et al., 125–136, Kluwer Academic Publisher, Netherlands, 1993.
Wallace, J. M. and Kousky, V.: Observational evidence of Kelvin waves in the tropical stratosphere, J. Atmos. Sci., 25, 900–907, 1968.
Ward, W. E., Yang, D. Y., Solheim, B. H., and Shepherd, G. G.: Observations of the 2-day wave in WINDII data during January 1993, Geophys. Res. Lett., 23, 2923–2926, 1996.
Wu, D. L., Hays, P. B., Skinner, W. R., Marshall, A. R., Burrage, M. D., Lieberman, R. S., and Ortland, D. A.: Observations of the quasi-2-day wave from the high resolution Doppler imager, Geophys. Res. Lett., 20, 2853–2856, 1993.
Yoshida, S., Tsuda, T., Shimuzu, A., and Nakamura, T.: Seasonal variations of 3.0–3.8-day ultra fast Kelvin waves observed with a meteor radar and radiosonde in Indonesia, Earth Planets Space, 51, 675–684, 1999.