HAL Id: hal-02904492
https://hal.inrae.fr/hal-02904492
Preprint submitted on 22 Jul 2020HAL is a multi-disciplinary open access archive for the deposit and dissemination of sci-entific research documents, whether they are pub-lished or not. The documents may come from teaching and research institutions in France or abroad, or from public or private research centers.
L’archive ouverte pluridisciplinaire HAL, est destinée au dépôt et à la diffusion de documents scientifiques de niveau recherche, publiés ou non, émanant des établissements d’enseignement et de recherche français ou étrangers, des laboratoires publics ou privés.
Self-reported smell and taste changes are early
indicators of the COVID- 1 19 pandemic and of the
effectiveness of political decisions 2 3 4
Denis Pierron, Veronica Pereda-Loth, Marylou Mantel, Maëlle Moranges,
Emmanuelle Bignon, Omar Alva, Julie Kabous, Margit Heiske, Jody Pacalon,
Renaud David, et al.
To cite this version:
Denis Pierron, Veronica Pereda-Loth, Marylou Mantel, Maëlle Moranges, Emmanuelle Bignon, et al.. Self-reported smell and taste changes are early indicators of the COVID- 1 19 pandemic and of the effectiveness of political decisions 2 3 4. 2020. �hal-02904492�
Self-reported smell and taste changes are early indicators of the
COVID-1
19 pandemic and of the effectiveness of political decisions
2 3 4
Denis Pierron1$€, Veronica Pereda-Loth1$,
5
Marylou Mantel2, Maëlle Moranges2, Emmanuelle Bignon3, Omar Alva1, Julie Kabous1, Margit Heiske1, Jody
6
Pacalon3, Renaud David4, Caterina Dinnella5, Sara Spinelli5, Erminio Monteleone5, Michael C. Farruggia6,
7
Keiland W. Cooper7, Elizabeth A. Sell8, Thierry Thomas-Danguin9, Alyssa J. Bakke10, Valentina Parma11, John
8
E. Hayes10, Thierry Letellier1, Camille Ferdenzi2*,
9
Jérôme Golebiowski3,12*€, Moustafa Bensafi2*€
10 11 12 13 14
$co-first authors, *co-last authors
15
€corresponding authors: denis.pierron@univ-tlse3.fr or jerome.golebiowski@univ-cotedazur.fr or
16 moustafa.bensafi@cnrs.fr 17 18 19 20 21 22 23
1- Équipe de Médecine Evolutive, faculté de chirurgie dentaire UMR5288 CNRS/Université Toulouse III, France 24
2- Lyon Neuroscience Research Center, CNRS UMR5292, INSERM U1028, University Claude Bernard Lyon 1, 25
Bron, France 26
3- Université Côte d’Azur, CNRS, Institut de Chimie de Nice UMR7272, Nice, France 27
4- Université Côte d’Azur, CHU de Nice, Nice Memory Clinic, Nice, France 28
5- University of Florence, Italy 29
6- Interdepartmental Neuroscience Program, Yale University, 333 Cedar Street, New Haven, CT, USA 30
7- University of California, Irvine, USA 31
8- University of Pennsylvania, department of psychology, USA 32
9- Centre des Sciences du Goût et de l'Alimentation, INRAE, CNRS, Dijon, France. 33
10- The Pennsylvania State University, Philadelphia (PA), USA 34
11- Temple University, Philadelphia (PA), USA 35
12- Department of Brain and Cognitive Sciences, Daegu Gyeongbuk Institute of Science and Technology, Daegu 36
711-873, South Korea 37
38 39
In response to the COVID-19, many governments have taken unprecedented measures in
1
peacetime, to avoid an overflow of intensive care units and critical care resuscitation units
2
(CCRUs). Due to the heavy societal and economic impact of measure such as the lockdown1, 3
accurate means to characterize the spread of the disease would be extremely helpful for the
4
reopening strategies. Concurrently, smell and taste changes have been identified as among the most
5
specific symptoms of COVID-192,3. 6
Here, we show that self-reports of smell/taste changes are more closely associated with hospital
7
overload and are much earlier than the current governmental indicators. We also show a decrease
8
of new onset as early as 5days after the lockdown enforcement, which is consistent with a rapid
9
effect of the lockdown on the pandemic. Cross-country comparisons show countries with the most
10
stringent lockdown measures (France and Italy) present a faster decline in new reports of the onset
11
of smell/taste changes after the lockdown than a country with less stringent measures (United
12
Kingdom). Public health decision makers could thus monitor self-reported changes in the ability
13
to smell or taste i/as an early and specific indicator of the COVID-19 pandemic, and ii/to evaluate
14
the success of reopening strategies.
15 16
Following similar decisions in China and Italy, a strict lockdown was enforced in France beginning 17
March 17, 2020 to block the progression of COVID-19 and to alleviate pressure on hospitals4. One issue
18
currently faced by governments is the progressive relaxation of the lockdown, which needs to be 19
conducted carefully and systematically to prevent subsequent outbreaks while facilitating economic 20
activity and recovery. On May 7, the French government categorized each geographical area according 21
to their COVID-19 prevalence. Red or green labels were assigned to each area. Compared to green areas, 22
red areas were characterized by: i) higher active circulation of the virus, ii) higher level of pressure in 23
hospitals (i.e. CCRU occupancy), and iii) lower capacity to test new cases (Figure 1A). In each area, 24
these labels were used to define steps associated with the end of the lockdown. To assess the active 25
circulation of the virus, the French Ministry of Health uses a specific metric as an indicator: the ratio of 1
consultations for suspicion of COVID-19 to general consultations at the emergency room (ER) in 2
hospitals (see Methods). 3
Changes in smell and taste are prominent symptoms of COVID-193,5–7, as has consistently been
4
demonstrated in many European and Middle-Eastern countries (Iran8, Spain9, France10, Italy11,
5
Germany12, and UK3, among others). These chemosensory changes generally occur before the
6
manifestation of more severe symptoms11, and may constitute more specific signs of the disease than
7
fever or dry cough2,3. Monitoring self-reported changes in smell and taste could thus provide early and
8
specific information on the spread of COVID-19 in the general population, and support health system 9
monitoring to avoid daily CCRU admission overflows. 10
Using data obtained by a global, crowd-sourced online study deployed in 30+ languages (Global 11
Consortium for Chemosensory Research survey, GCCR, see Methods), we tested whether changes in 12
smell/taste at the population level could be used as an early indicator for local COVID-19 outbreaks. As 13
pre-registered (see Methods), our first aim was to examine the link between the number of self-reported 14
smell/taste changes and indicators of pressure in the hospitals (COVID-related hospitalization, CCRU 15
admissions, and mortality rates) for each French administrative region over the last 3 months. The second 16
aim was to examine temporal relationships between the peak of smell and taste changes in the population, 17
and the peak of COVID-19 cases and the application of lockdown measures. The possibility that smell 18
and taste changes could serve as an early indicator of the number of COVID-19 cases – and hence hospital 19
stress – was tested by comparing France with Italy and the UK, which implemented lockdown with 20
different timing and levels of stringency. 21
22
Changes in smell and taste are associated with overwhelmed healthcare systems 23
The relationship between self-reports of changes in smell and taste by French residents (diagnosed 24
COVID-19+ or not, see Methods) and the estimators of local healthcare system stress was evaluated 25
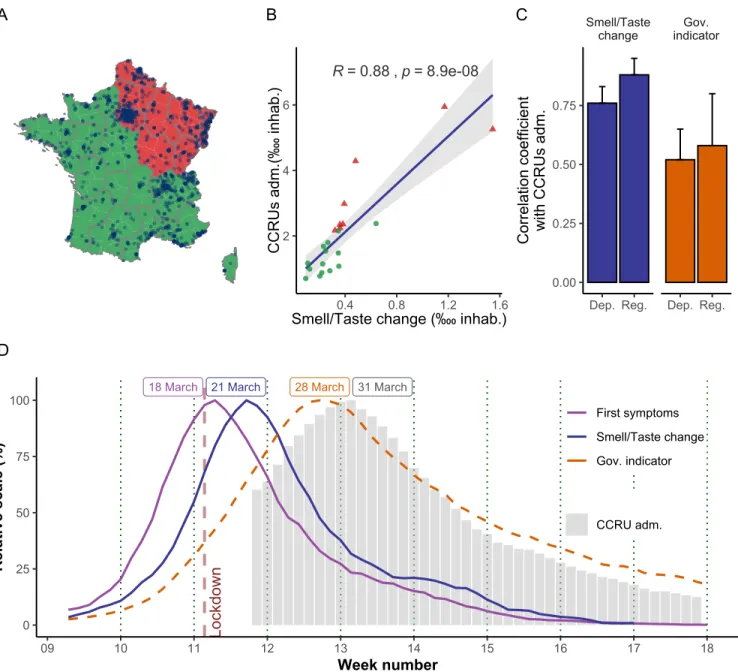
using a geographical approach. Figure 1A depicts the geographical distribution in red and green regions 1
(as defined by the government) and the participants who self-reported changes in their smell and taste. 2
The red areas of France account for 40.8 % of the population. Green areas are clustered into a group with 3
both a low number of self-reported chemosensory changes and a low number of admissions to CCRUs 4
(Figure 1B). Red areas show an opposite trend (Chi-square < 1x10-200 and Biserial correlations p-value
5
< 1.3x10⁻²). A strong relationship exists between self-reported changes in smell and taste and the number
6
of admissions to CCRUs (Rsmell = 0.88, p = 8.9x10-08). This correlation remained significant even after
7
removing the two most impacted areas (Alsace and Ile de France, Rsmell = 0.72; p < 3x10-04), negating
8
the possibility that our findings are carried solely by these two regions. 9
Strikingly, use of self-reported chemosensory changes produced a stronger correlation than the current 10
governmental indicator of virus circulation (Figure 1C). Overall, smell/taste changes are systematically 11
better correlated than the current governmental indicator with the number of COVID-19 admissions to 12
hospitals (Rsmell = 0.81, p = 6.71x10-06 vs Rgov = 0.60, p=3.35 x 10-03) or the number of COVID-19 related
13
deaths (Rsmell = 0.75, p = 5.62x10-05 vs Rgov = 0.58, p=4.97 x 10-03 see Supplementary File S1).
14
Furthermore, when smaller geographical areas were considered (France is divided into 96 administrative 15
units, called departments) the correlations remained highly significant (e.g., admissions to CCRUs: Rsmell
16
= 0.76, p < 5x10-19) (Figure 1C). Moreover, the three relationships (change in smell/taste versus
COVID-17
19 related hospitalization, resuscitations and death) also remained highly significant when considering 18
only individuals who were not diagnosed for COVID-19 but presented symptoms (e.g., admissions to 19
CCRUs: Rsmell = 0.83, p = 1.65 x10-06). The potential sampling bias due to a link between the regional
20
media coverage of our survey and the associated self-reported chemosensory changes by region was 21
ruled out after confirming that these two variables were not correlated (R < 0.01, p > 0.9). 22
1
Figure 1. Changes in smell and taste as indicators of overwhelmed healthcare systems: geographic 2
and time-related approaches. A) French regions were assigned a green or red label which reflects the 3
local post-lockdown protocols. Dots represent people self-reporting smell and taste changes. B) The
4
number of COVID-19 related CCRU admissions (as of May 11, 2020) is correlated with the number of
5
self-reported chemosensory changes (between March 1 and May 11, 2020, total n=3832). Green dots
6
correspond to regions with a post-lockdown level labelled green, and red triangles are red regions. The
7
two red triangles with CCRU admissions > 5 are Alsace and Ile de France. C) Correlation coefficients
8
between the number of CCRU admissions per area and i) the number of people reporting smell and taste
9
changes (n=3832, blue), and ii) the governmental indicator (orange). The analysis is done both at the
10
level of the French metropolitan regions (Reg) and French metropolitan departments (Dep). Confidence
11
interval are represented. D) Evolution of smell/taste change symptom onset over time in France (blue
12
line, n=1476), the governmental indicator (orange dashed line), and COVID-19 occupancy levels in
13
CCRUs (grey bars) around the lockdown period (vertical brown line). Data are presented as 7-day
14
running averages, normalized to the day with the highest value.
15 A R = 0.88 , p = 8.9e-08 2 4 6 0.4 0.8 1.2 1.6 Smell/Taste change (‱ inhab.)
C C R U s ad m. (‱ in ha b. ) B Smell/Taste
change indicatorGov.
Dep. Reg. Dep. Reg. 0.00 0.25 0.50 0.75 C orre la tio n co ef fici en t w ith C C R U s ad m. C 31 March
18 March 21 March 28 March
Lo ckd ow n 0 25 50 75 100 09 10 11 12 13 14 15 16 17 18 Week number R el ati ve s ca le (% ) First symptoms Smell/Taste change Gov. indicator CCRU adm. D
Notably, relationships between pandemic markers and online searches related to chemosensation were 1
also significant in France. Google queries related to smell or taste loss (“perte odorat”, “perte goût” in 2
French) were correlated with the three measures of an overwhelmed healthcare system discussed above 3
(e.g., CCRU admissions: Rsmell = 0.8, p < 4x10-03, see Supplementary File S1).
4 5
Changes in smell and taste are early markers of the effects of political decisions 6
In a second step, we set out to examine the temporal dynamics in France of self-reported changes in 7
smell/taste, the current governmental indicator, and the number of CCRU admissions due to COVID-19 8
before and after the lockdown period. As shown in Figure 1D, the peak of the onset of changes in 9
smell/taste appeared 4 days after the lockdown and for these individuals, the first reported COVID-19 10
symptoms occur even earlier. The governmental indicator only peaked 11 days after the lockdown, while 11
the peak of CCRU admissions was shifted by 14 days. This is consistent with epidemiological surveys 12
suggesting that COVID-19 related changes in smell and taste occur in the first few days after 13
infection4,13,14. The robustness of the smell and taste changes over time was assessed in two ways. We
14
first showed that the peak of smell/taste changes remained the same regardless of the completion date for 15
the online survey (Supplementary Figure 1A). Second, we observed the exact same peak when 16
analyzing a separate French survey performed on 950 individuals and focusing on smell alterations in 17
the French population independently of COVID-19 (see Methods): the peak of olfactory changes again 18
occurred 4 days after the lockdown decision, and this was independent of the completion dates 19
(Supplementary Figure 1B). 20
Consistently, analyses of online Google searches highlight that on the same days where survey 21
participants report experiencing their first symptoms (around March 18) there is a peak of queries for 22
terms associated with early COVID-19 symptoms (fever, cough, aches, Supplementary Figure 2A). A 23
few days later the peak of online queries for “taste loss” and “smell loss” is synchronized with the report 24
of smell and taste changes (Supplementary Figure 2B). One week later the queries for shortness of 25
breath preceded the peak of CCRU admissions (Supplementary Figure 2C). These results suggest that 26
a significant fraction of French COVID-19 patients followed the same pathological timeline, 1
experiencing the first symptoms at the very start of the lockdown, which might be representative of a 2
peak of contamination a few days before the lockdown. This is consistent with the objective of the 3
lockdown, which was to decrease the number of new people infected after its implementation. Therefore, 4
the period immediately before the lockdown represents the expected peak of new infections. For France, 5
a large population may have been infected on the weekend two days before the lockdown, due to a 6
crowded sunny weekend, the French election day, as well as busier train stations and supermarkets in 7
anticipation of a shortage of supplies during the lockdown4.
8
These data suggest the short-term efficacy of a lockdown could be monitored by tracking changes in 9
smell and taste in the population. To assess whether such prediction might apply to other countries, we 10
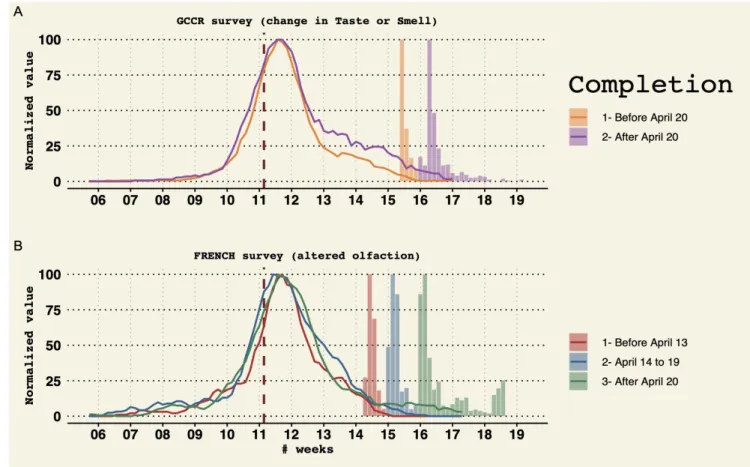
performed similar analyses using data from Italy and the UK, where the lockdown measures were 11
established with different levels of severity in government policies (according to the government 12
stringency index, see Figure 2). We monitored the dynamics of confirmed COVID-19 cases, self-13
reported first symptoms, and self-reported taste and smell changes and compared them as a function of 14
the government stringency index. Right after the lockdown, we observed that the two countries with the 15
higher stringency index experienced a more rapid decrease in both self-reported smell and taste changes 16
and COVID-19 first symptoms. In addition, and as expected, the evolution of confirmed COVID-19 17
cases differs according to the stringency index. The governments of Italy and France rapidly increased 18
their stringency index, which lead to a sharp decrease in COVID-19 symptoms and cases. On the 19
contrary, in the UK, the number of people reporting symptoms showed a slower decrease, possibly due 20
to a less severe lockdown policy, and the number of confirmed cases remained high in the observed 21
period. In each country, self-reported smell and taste changes can be regarded as a good marker to predict 22
the dynamics of confirmed COVID-19 cases. When the chemosensory onset decreases sharply (France 23
and Italy), so does the number of confirmed cases with a delay from ~ weeks. On the contrary, a slow 24
decrease of chemosensory changes is associated with a plateau of confirmed cases (UK). 25
1
2 3
Figure 2. Evolution of COVID-19 indicators before and after the lockdown in France, Italy and the UK. 4
The daily proportion of first symptoms is shown as a violet line (France, n=4720, Italy, n=1241, UK,
5
n=750). The daily proportion of smell/taste changes is shown as a blue line (France, n=1487, Italy,
6
n=264, UK, n=263). The daily proportion of COVID-19 confirmed cases is shown as red dashed line.
7
Each panel shows both raw data (thin line) and the corresponding 7-day running average (thick line).
8
The government response stringency index is shown as the background color.
9 10 11 12 13 Lockdown Lockdown Lockdown United Kingdom Italy France 05 06 07 08 09 10 11 12 13 14 15 16 17 18 19 0.0% 2.0% 4.0% 6.0% 0.0% 2.0% 4.0% 6.0% 0.0% 2.0% 4.0% 6.0% Week number D ai ly pro po rti on 0 25 50 75 Government response stringency index Reports Smell/Taste change First symptoms National number of confirmed COVID-19 cases (ECDC)
Discussion
1 2
The present study reveals for the first time strong spatial and temporal relationships between self-reported 3
smell and taste changes and indices of health care system stress, such as admissions to CCRUs. This is 4
consistent with cumulative evidence showing a high prevalence of chemosensory alterations in patients 5
affected by COVID-19, at least in European (France10,14, Italy11, UK3 15) and Middle Eastern
6
countries13,16. Participants declared smell and taste changes only 3-4 days after their first symptoms.
7
Such early chemosensory estimators may represent a cost-effective and easy way to implement 8
alternative surveillance methods to large-scale virology tests, which are difficult to perform, costly, and 9
time-consuming, especially during a pandemic. 10
Following lockdown, the rapid decrease of self-reported changes in smell and taste in France may be 11
representative of the effectiveness of this decision in reducing contamination rates. Interestingly, data 12
from Italian participants show very similar patterns with one-week difference compared to the French 13
data. This might reflect highly similar responses by the Italian and French governments. In contrast, the 14
prevalence of chemosensory changes in the UK shows a more gradual decrease. The UK government 15
began with advice to avoid pubs, clubs and theatres, and to work from home from March 16 and 16
implemented restrictions around March 18. A lockdown was then declared on March 23, although this 17
was still less stringent than those in France or Italy. Notably, new COVID-19 cases in the UK showed a 18
plateau phase which is not observed in France and Italy. Considering French and Italian data, our analyses 19
suggest that collecting online information about changes in smell and taste from residents may be a 20
valuable indicator of the effectiveness of reopening strategies related to the COVID-19 pandemic. 21
In summary, in areas where smell and taste changes are notable COVID-19 symptoms (e.g., European, 22
American and Middle Eastern countries), public health decision-makers may want to consider the 23
proportion of individuals who self-report changes in their ability to smell or taste as an early indicator of 24
future health system demand. Continuous monitoring of changes in smell and taste perception may be a 25
highly cost-effective, minimally invasive, and reliable way to keep track of any future COVID-19 1
outbreaks. We suggest recommendations for the more accurate implementation of such indicators, 2
especially for future outbreaks that may overlap with other seasonal viral diseases which share many of 3
the symptoms (fever, cough etc.) but whose treatment or prevention (vaccination) are less demanding in 4
terms of critical care than COVID-19. All recent COVID-19 surveys, including our own, suffer from 5
biases in the profile of respondents, as they may be more willing and interested in participating in 6
scientific research. Still, with a larger diffusion and promotion of a similar, but simplified interface, 7
through both traditional and online media, decision-makers may benefit from a tool informing them in 8
real time about the changes in smell and taste in the general population. In the very short-term, this will 9
enable the verification of the effects of important governmental decisions (e.g., lockdown), and in the 10
long-term, it will help to predict future admission pressure in hospitals. This information could help 11
decision-makers to take important measures at the local level in case of a new outbreak, as in the case of 12
France, in the assigning of green and red areas, which has a great impact on economic and social 13
activities. 14
References
1
1. Gilbert, M., Dewatripont, M., Muraille, E., Platteau, J.-P. & Goldman, M. Preparing for a 2
responsible lockdown exit strategy. Nat. Med. 26, 643–644 (2020). 3
2. Yan, C. H., Faraji, F., Prajapati, D. P., Ostrander, B. T. & DeConde, A. S. Self-reported olfactory 4
loss associates with outpatient clinical course in Covid-19. Int. Forum Allergy Rhinol. alr.22592 5
(2020) doi:10.1002/alr.22592. 6
3. Menni, C. et al. Real-time tracking of self-reported symptoms to predict potential COVID-19. Nat. 7
Med. (2020) doi:10.1038/s41591-020-0916-2.
8
4. Salje, H. et al. Estimating the burden of SARS-CoV-2 in France. Science (2020) 9
doi:10.1126/science.abc3517. 10
5. Eliezer, M. et al. Sudden and Complete Olfactory Loss Function as a Possible Symptom of 11
COVID-19. JAMA Otolaryngol. Neck Surg. (2020) doi:10.1001/jamaoto.2020.0832. 12
6. Gautier, J.-F. & Ravussin, Y. A New Symptom of COVID-19: Loss of Taste and Smell. Obesity 13
28, 848–848 (2020). 14
7. Pellegrino, R. et al. Corona Viruses and the Chemical Senses: Past, Present, and Future. Chem. 15
Senses (2020) doi:10.1093/chemse/bjaa031.
16
8. Bagheri, S. H. R. et al. Coincidence of COVID-19 epidemic and olfactory dysfunction outbreak. 17
http://medrxiv.org/lookup/doi/10.1101/2020.03.23.20041889 (2020) 18
doi:10.1101/2020.03.23.20041889. 19
9. Beltrán-Corbellini, Á. et al. Acute-onset smell and taste disorders in the context of Covid-19: a 20
pilot multicenter PCR-based case-control study. Eur. J. Neurol. n/a, (2020). 21
10. Bénézit, F. et al. Utility of hyposmia and hypogeusia for the diagnosis of COVID-19. Lancet Infect. 22
Dis. (2020) doi:10.1016/S1473-3099(20)30297-8.
23
11. Giacomelli, A. et al. Self-reported Olfactory and Taste Disorders in SARS-CoV-2 Patients: A 24
Cross-Sectional Study. Clin. Infect. Dis. (2020) doi:10.1093/cid/ciaa330. 25
12. Haehner, A., Draf, J., Draeger, S., With, K. de & Hummel, T. Predictive value of sudden olfactory 26
loss in the diagnosis of COVID-19. medRxiv 2020.04.27.20081356 (2020) 27
doi:10.1101/2020.04.27.20081356. 28
13. Levinson, R. et al. Anosmia and dysgeusia in patients with mild SARS-CoV-2 infection. 29
http://medrxiv.org/lookup/doi/10.1101/2020.04.11.20055483 (2020) 30
doi:10.1101/2020.04.11.20055483. 31
14. Klopfenstein, T. et al. Features of anosmia in COVID-19. Med. Mal. Infect. (2020) 32
doi:10.1016/j.medmal.2020.04.006. 33
15. Lechien, J. R. et al. Olfactory and gustatory dysfunctions as a clinical presentation of mild-to-34
moderate forms of the coronavirus disease (COVID-19): a multicenter European study. Eur. Arch. 35
Otorhinolaryngol. 1–11 (2020) doi:10.1007/s00405-020-05965-1.
36
16. Moein, S. T. et al. Smell dysfunction: a biomarker for COVID-19. Int. Forum Allergy Rhinol. n/a, 37
(2020). 38
39 40
Methods
1 2
1- Online survey
3
This study is mainly based on data from the Global Consortium for Chemosensory Research survey 4
(GCCR)17 – a global, crowd-sourced online study deployed in 30+ languages18. The data analyzed here
5
represent the collection from April 7 to May 14. The protocol complies with the revised Declaration of 6
Helsinki and was approved as an exempt study by the Office of Research Protections at The Pennsylvania 7
Study University (Penn State) in the U.S.A. (STUDY00014904). 8
Participants in the GCCR questionnaire were recruited by word of mouth as well as through social and 9
traditional media (flyers, social media, television, radio) during the COVID-19 pandemic. It was well 10
covered by the French press, as over 70 articles mentioned the project, at both the regional and national 11
level (see Supplementary File S1). Respondents received no monetary incentive for their participation. 12
Inclusion criteria were as follows. i) Questionnaire completion was allowed only to participants who 13
indicated they had suffered from a respiratory disease in the past two weeks, whether they noticed a 14
change in their taste/smell or not. ii) Participants aged 18 years old or younger were excluded. 15
For the analyses conducted in this article, only individuals reporting a change in smell and/or taste 16
perception were included, based on the question “Have you had any of the following symptoms with 17
your recent respiratory illness or diagnosis?”. Moreover, to exclude unreliable entries, participants must 18
have reported a quantitative difference of at least 5 on a 0-to-100 rating scale between their ability to 19
smell and/or taste before and during their recent respiratory illness or diagnosis. We then extracted from 20
full dataset individuals who reported living in France, Italy or the UK. As the country of residence was 21
assessed completed as a text entry, we allowed for typical variations (e.g. “United Kingdom” or “UK”), 22
spelling mistakes, use of different languages (e.g. “Italie” or “Italia”), as well as subdivisions (e.g. 23
“Scotland”) and major cities (“Paris”). Metropolitan France is split into 13 so-called “regions” since 24
2016. In this study we however considered the former system where France was split into 22 regions 25
since the organization of the health system mostly remains based on the structure built before 2016. An 1
alternative, finer granularity, splits metropolitan France into 96 so-called “departments”. To retrieve the 2
French department and region of the participants, we used the city of residence they reported in the 3
questionnaire and combined them with the French public website19 (after a semi-manual correction of
4
spelling). Participants came from all metropolitan departments but three (Mayenne, Creuse, Cantal). 5
Consequently, the number of responses analysed in France was between n=1476 and 4720 depending on 6
the analysis conducted (i.e., on whether the information of interest was present or missing and the date 7
range of analysis, (see Supplementary File S2 for details). For comparison purposes, n=264 to 1241 8
participants from Italy and n=243 to 750 participants from the UK were included. The majority of the 9
participants were women (FR:66.38%, IT:69.3%, UK:76.0%), and the average age was around 40 10
[FR=40.7(sd=12.4), IT=41.1(sd=11.4), UK=41.09(sd=12.1)]. In the French dataset, a total of 15% of 11
individuals tested positive for COVID-19 (lab result) and 44% were clinically diagnosed by a practitioner 12
based on their symptoms. The remaining 41% were not diagnosed for COVID-19 but declared a change 13
in perception of either smell or taste. The number of participants was normalized by region, by using the 14
number of inhabitants in each region as estimated by the French public statistics office, INSEE20. Finally,
15
the time of onset of smell and taste change was assessed by the optional question: “Please describe the 16
progression or order you noticed your symptoms” and the time of onset of the recent disease by the 17
question: “At what date did you first notice symptoms of your recent respiratory illness? Provide your 18
best guess or leave blank if you do not remember.” 19
20
2- Complementary and independent French Survey
21
The data of another online survey were used to evaluate the robustness of the temporal evolution of smell 22
and taste changes. This survey was conducted in the French population between April 8 and May 8, 2020 23
and aimed at characterizing chemosensory disorders in people with and without COVID-19, as well as 24
the consequences on quality of life. The data of 950 respondents were eligible for comparison with the 25
GCCR survey, i.e., responses where both the date of completion and the date of smell loss onset were 1
provided. Only responses that were complete and from people who were responding to the questionnaire 2
for the first time and were aged over 18 were included. This survey was approved by the CNRS ethics 3
committee. Data collection was strictly anonymous. 4
5
3- Online trends
6
Trends of online queries by French region were performed using Google Trends, a tool returning the 7
popularity of a search term in a specific state or region (https://trends.google.com/). Google is by far the 8
most used search engine in France (>90% of internet searches)21. We looked for the popularity of the
9
terms (listed in figure S2, using default selection of “All categories” and “Web search”), within the 10
timeframe of February 1, 2020 to May 10, 2020 (from the month of the first official COVID-related 11
death in Europe to the end of lockdown in France). It should be noted that Google Trends does not 12
provide the actual numbers of searches but rather a relative score from 0 to 100 (100 corresponding to 13
the day with the greatest number of searches during the specified time period). To compare Google 14
Trends scores between French regions, we transformed them by computing the relative number of queries 15
per day in the region of interest. For example, despite a value of 100, the peak day might represent only 16
5% of the total number of queries related to the topic across the timeframe of interest (see above). 17
18
4- Healthcare system data
19
The French governmental indicator to estimate the circulation of the virus was calculated from the ratio 20
of consultations for suspected COVID-19 to general consultations at the emergency room (ER) in 21
hospitals. Areas with values higher than 10% are considered having a high circulation. This indicator 22
contributes to the assignment of a red/green label. 23
Data dealing with the health status across countries (number of COVID-19 cases and deaths for each 24
day) were downloaded on May 22, 2020 from the European Centre for Disease Prevention and Control 25
databank22. Data regarding the healthcare system stress in France (hospitalizations, CCRU entries and
1
deaths) were also downloaded on May 22 from the French Public Health website23. Here, we use the
2
term of CCRU (Critical Care Resuscitation Unit) to translate the French hospital service of 3
“Reanimation”. Raw data were normalized across regions with regard to their number of inhabitants as 4
estimated by INSEE. The temporal evolution of the stringency of government response was retrieved 5
from the Oxford COVID-19 index24. Here, the stringency level of a country is computed according to
6
which measures of a list of items (e.g., school closures, cancellation of public events, international travel 7
controls, etc.) are undertaken. For the post-lockdown situation, the color assigned by the French 8
government to each department was downloaded on May 12 from the government website25. Only data
9
before May 11 (aka the initial lift of the lockdown) were included in the analyses. 10
11
5- Statistical analyses
12
Statistical analyses were pre-registered at the Open Science Framework (OSF) 26. Data were analyzed
13
using R software (4.0) and its standard packages (maps, ggplot, etc.). Data were grouped at the national 14
level (France, Italy, UK). In France they were also grouped at the regional level (according to the division 15
into 22 regions in place prior to the 2016 reform27). The rationale behind this is that the healthcare system
16
is still structured following this organization, with University Hospitals in regional main cities serving 17
patients of the surrounding departments. Participants from overseas French territories were not included 18
in the geographical analysis because of too few data (n<10). The relationship between 1) GCCR 19
responses (or online queries), and 2) public health data was determined using parametric (e.g. Pearson 20
correlations) as allowed by the normal distribution of the variable of interest. The association between 21
GCCR participant and red/green post-lockdown status was tested using Chi-square tests and Biserial 22
correlations. Complementary analyses not planned in the pre-registration included: i/ the analysis using 23
the independent French online survey (see section 2 of the methods), ii/ the correlation between regional 24
media coverage and the number of responses to the online survey per region, iii/ the correlation at the 25
level of departement, iv/ the correlation excluding extreme points, and v/ the correlation with the 1
government indicator. Pre-registered statistical analyses not presented here include: i/ Mann-Kendall 2
trend test and Change-point Detection test to detect time series changes, and ii/ part of the google trend 3 analysis. 4 5 References (Methods) 6
17. Home Page. Global Consortium for Chemosensory Research (GCCR) https://gcchemosensr.org/ 7
(2020). 8
18. Parma, V. et al. More than smell. COVID-19 is associated with severe impairment of smell, taste, 9
and chemesthesis. medRxiv 2020.05.04.20090902 (2020) doi:10.1101/2020.05.04.20090902. 10
19. Accueil. data.gouv.fr https://www.data.gouv.fr/fr/. 11
20. Estimation de la population au 1er janvier 2020. Institut National de la Statistique et des Etudes
12
Economiques https://www.insee.fr/fr/statistiques/1893198 (2020).
13
21. Search Engine Host Market Share France. StatCounter Global Stats 14
https://gs.statcounter.com/search-engine-host-market-share/all/france. 15
22. Homepage. European Centre for Disease Prevention and Control https://www.ecdc.europa.eu/en. 16
23. Homepage. Géodes - Santé publique France https://geodes.santepubliquefrance.fr/#c=home. 17
24. Hale, T., Webster, S., Petherick, A., Philips, T. & Kira, B. Government Response Tracker. 18
https://www.bsg.ox.ac.uk/research/research-projects/coronavirus-government-response-tracker. 19
25. Info Coronavirus COVID-19. Gouvernement.fr https://www.gouvernement.fr/info-coronavirus. 20
26. Pierron, D. et al. Relationship between self-reported chemosensory loss and health service 21
functioning in the COVID-19 crisis: from containment to hospitalization and mortality. (2020) 22
doi:None. 23
27. Territorial reform. Gouvernement.fr https://www.gouvernement.fr/en/territorial-reform (2014). 24
Acknowledgements
1
This work was supported financially by EXTREM-O (CNRS, CNES), the CORODORAT grant (IDEX-2
Lyon - Universite de Lyon), by the French government, through the UCAJEDI “Investments in the 3
Future” project managed by the ANR grant No. ANR-15-IDEX-01. The authors thank Sébastien Buthion, 4
Conceição Silva, Brigitte Perucca, Clément Blondel, Stéphanie Younès, François Maginot and their 5
teams from the CNRS communication units as well as the Global Consortium for Chemosensory 6
Research (GCCR). Deployment of the GCCR survey in multiple languages was supported by 7
discretionary funds from the Pennsylvania State University (Penn State), including a gift from James and 8
Helen Zallie in support of Sensory Science at Penn State. 9
10
Authors contributions
11
Conceived, designed the study and wrote the paper: D.P., V.P-L., C.F., J.G., M.B. 12
Data acquisition and curation: all authors 13
Performed Analysis: D.P., V.P-L., C.F., J.G., M. B., M.Ma., M.Mo., E.B. 14
Edited and approved the final manuscript: all authors 15 16 17 18 19 Competing interests 20
The authors declare no competing interests 21
22 23
Supplementary figures
1
2 3
Figure S1. Evaluation of the robustness of reported smell and taste changes over times. Colored lines
4
represent the proportion of reported onset of smell and taste normalized to the highest value of each
5
series. The barplot indicate the proportion of the date of completion of the survey (normalized to the
6
highest value of each series). Color represent groups of participants according completion time. French
7
lockdown is represented by the vertical brown dashed line. A) Peaks of smell/taste changes date in the
8
French participants who answered to the GCCR questionnaire based on according to different dates of
9
completion (before or after April 20). B) date distribution of independent French survey performed on
10
950 individuals and focusing on smell alterations in the french population independently of
COVID-11
19(see Methods).
12 13 14
1 2
Figure S2. Google trends in France for COVID-19 symptoms. The French lockdown start is shown by a
3
brown dashed line. A): The peak of the onset of first symptoms declared in the GCCR survey (blue bars,
4
1 day after the lockdown) corresponds to peaks of online queries for fever (red line), cough (blue line)
5
and aches (yellow line). B): The peak of onset of altered smell/taste (green bars, 4 days after the
6
lockdown) corresponds to peaks of online queries for “smell loss” (yellow) and “taste loss” (green). C):
7
Online queries for “shortness of breath” (red curve) preceded by three days the peak of the number of
8
admissions to CCRU.