HAL Id: halshs-03022092
https://halshs.archives-ouvertes.fr/halshs-03022092
Preprint submitted on 24 Nov 2020HAL is a multi-disciplinary open access archive for the deposit and dissemination of sci-entific research documents, whether they are pub-lished or not. The documents may come from teaching and research institutions in France or abroad, or from public or private research centers.
L’archive ouverte pluridisciplinaire HAL, est destinée au dépôt et à la diffusion de documents scientifiques de niveau recherche, publiés ou non, émanant des établissements d’enseignement et de recherche français ou étrangers, des laboratoires publics ou privés.
France and the U.S
Antoine Bozio, Bertrand Garbinti, Jonathan Goupille-Lebret, Malka Guillot,
Thomas Piketty
To cite this version:
Antoine Bozio, Bertrand Garbinti, Jonathan Goupille-Lebret, Malka Guillot, Thomas Piketty. Pre-distribution vs. RePre-distribution: Evidence from France and the U.S. 2020. �halshs-03022092�
Predistribution vs. Redistribution: Evidence from
France and the U.S.
Antoine Bozio
Bertrand Garbinti
Jonathan Goupille-Lebret
Malka Guillot
Thomas Piketty
Final version: July 27, 2018
This version: October 29, 2020
Evidence from France and the U.S.
Antoine Bozio, Bertrand Garbinti,
Jonathan Goupille-Lebret, Malka Guillot, Thomas Piketty *
First Version: July 27, 2018Last Revised: October 29, 2020
Abstract. How much redistribution policies can account for long-run changes in
inequality? To answer this question, we quantify the extent of redistribution over time by the percentage reduction from pretax to post-tax inequalities, and decompose the changes in post-tax inequalities into different redistributive policies and changes in pretax inequalities. To estimate these redistributive statistics, we construct homogenous annual series of post-tax national income for France over the 1900-2018 period, and compare them with those recently constructed for the U.S. We obtain three major findings. First, redistribution has increased in both countries over the period, earlier in the U.S., later in France, to reach similar levels today. Second, the substantial long-run decline in post-tax inequality in France over the 1900-2018 period is due mostly to the fall in pretax inequality (accounting for three quarters of the total decline), and to a lesser extent to the direct redistributive role of taxes, transfers and other public spending (about one quarter). Third, the reason why overall inequality is much smaller in France than in the U.S. is entirely due to differences in pretax inequality. These findings suggest that policy discussions on inequality should, in the future, pay more attention to policies affecting pretax inequality and should not focus exclusively on “redistribution”.
* This paper is a much-revised version of an earlier paper which was previously circulated under the title “Inequality and Redistribution in France, 1990-2018: Evidence from Post-Tax Distributional National
Accounts (DINA)” (WIL WP 2018/10).
We thank Emmanuel Saez, Daniel Waldenström, Gabriel Zucman and numerous seminar and conference participants for helpful discussions and comments. We are also thankful to the Pole Production Statistique et Methodes of the Family Benefits Agency (CAF) and to the Bureau de l’analyse des comptes sociaux of the Directorate for Research, Studies, Evaluation and Statistics (DREES) for the different data they kindly provided us. The research leading to these results has received funding from the European Research Council under the European Union's Seventh Framework Programme, ERC Grant Agreement n. 856455 and from the French National Research Agency (ANR) research program (reference: ANR-19-CE41-0011, ANR-17-EURE-0001). Access to some confidential data, on which is based this work, has been made possible within a secure environment offered by CASD – Centre d’accès sécurisé aux données (Ref. ANR-10-EQPX-17). This paper is supplemented by an extensive online data appendix. This paper presents the authors’ views and should not be interpreted as reflecting those of their institutions.
Contacts: Bozio (PSE, EHESS) antoine.bozio@ipp.eu ; Garbinti (CREST-ENSAE-IP Paris, WIL):
bertrand.garbinti@ensae.fr ; Goupille-Lebret (Univ Lyon, CNRS, ENS de Lyon, GATE UMR 5824,
F-69342 Lyon, France): jonathan.goupille-lebret@ens-lyon.fr ; Guillot (ETH Zürich, IPP, WIL)
Section 1. Introduction
The issue of how to select the most adequate policies to reduce inequalities has attracted considerable interest, both in academia and in the public debate, in particular in light of the significant increase in inequality documented over the last decades in many countries. However, despite numerous research efforts, comparable long-term estimates of redistributive policies remain deceptively scarce.
Public policies aiming to reduce inequalities can be classified into two categories. First, for a given level of pretax inequality, taxes, transfers and other public spending can reduce post-tax income inequality. This is what is usually called redistribution policies. The public economics literature has largely been influenced by an approach which treats pre-tax inequalities as given, and where the policy options for reducing inequalities largely rest on various combination of tax-and-transfers, with the constraints imposed by the behavioral responses to the tax and transfer system (e.g.,
this is the generic logic of optimal taxation literature).1 However, public policies can
also affect the pretax distribution of income (what we will call “predistribution”). For instance, the legal and social system contributes to determine the bargaining power of workers vis-à-vis firm owners and managers, via wage-setting rules, corporate laws, trade regimes or labor market regulations. Similarly, educational and health care policies impact the access to skills and jobs, and therefore the overall inequality of labor earnings. Trade and technological changes can also influence the relative earnings of different skills or occupation, as well as a range of market regulations. Finally, taxation and transfers can also affect pre-tax income either via changes in bargaining incentives or through different dynamics of capital accumulation. Although these channels are known to impact inequalities, the lack of adequate data series with sufficient historical and comparative breadth has limited the ability to evaluate and compare the long-term impact of various public policy options on inequality.
This paper asks two simple empirical questions. What is the impact of public policies on inequality? What are the relative magnitudes of “redistribution” and changes in
pretax income in accounting for the observed evolution of inequality over time and across countries?
We break new grounds on this issue at both methodological and substantive levels. Our first objective is related to the measurement of income inequality. From a methodological perspective, our key contribution is to construct micro-files of the distribution of post-tax, post-transfer national income in France since 1900. These micro data are obtained by combining national accounts, administrative tax data and household survey data in a comprehensive and consistent manner. The methodology consists in two steps. First, we follow Garbinti, Goupille-Lebret and Piketty (2018) to obtain pretax inequality series, using the same methodology and updating estimates to 2018. Second, we develop a microsimulation model and use explicit tax incidence assumptions to impute all taxes, transfers and collective expenditures. This is done by applying legislation over taxes and transfers and/or using information on tax liability and monetary transfer receipt that is often directly observed in administrative tax data
or in household surveys.2 As a result, our French post-tax income series are annual,
fully consistent with macroeconomic aggregates and cover the entire income distribution, from bottom to top percentiles.
Our second objective is to better understand the differential impact of public policies on inequality over time and across countries, by measuring the impact of redistribution on inequality dynamics. To exploit cross-country differences in pre- and post-tax inequalities, we compare our French inequality series with those from Piketty, Saez
and Zucman (2018) for the U.S.3 We develop simple statistics to quantify the
contribution of redistribution, as opposed to predistribution or any other external shocks, in explaining observed long-run trends in inequalities across times and countries.
2The imputation of in-kind transfers and collective expenditures is the most difficult part of this exercise.
We show how variants for imputing these public spending affect our results.
3 Note that this comparison is made possible by the fact that both series are based on the very same
methodology and are anchored to national accounts. See Alvaredo et al. (2020) for a complete presentation of the general methodology to construct pre-tax and post-tax distributional national accounts. See also Blanchet et al. (2019) for an attempt to present DINA estimates for European countries using machine learning and survey calibration.
Our analysis leads to three sets of results. First, by comparing the evolution of pretax and post-tax income inequality between France and the U.S. over the 1900-2018 period, we identify two stylized facts, that are worth noting: First, while pretax inequality has followed a U-shaped pattern in both countries–with a much steeper rise in inequality in the U.S. in recent decades–the trend in post-tax income inequality differs markedly between the two countries, being U-shaped in the U.S. and L-shaped in France. Second, in both countries, the gap between pretax and post-tax income is only significant for the top 10% and bottom 50% income groups, with the middle 40% group largely unaffected.
Our second set of results relate to our quantification of the impact of redistribution4 on
inequality dynamics. Our analysis relies on inequality indicators defined either as the ratio between average incomes of the top 10% and bottom 50% groups (ratio T10/B50) or as the ratio between average incomes of the top 10% and bottom 90% groups (ratio T10/B90). We use these indicators to assess the magnitude of inequality reduction implied by redistribution in France and the U.S. by sub-periods. This can be done easily by computing the relative variation in our inequality indicators (ratio T10/B50 or ratio
T10/B90) when going from pretax to post-tax income.5 Based on these measures, we
document that the reduction of inequality implied by redistribution is significant in both countries and increasing throughout the entire 20th century, even though not at the same pace and in the same period. As a case in point, redistribution measured by the T10/B90 ratio was similar in France and in the U.S. just before WWI (reducing pretax inequality by less than 10% in both countries), then increased sensibly in the U.S. after WWII while France kept a similar level of redistribution (-23% vs -11% for 1945-1955). From the mid-1970s onwards, redistribution increased in France, which cached-up with the U.S., and then both countries experienced increasing redistribution. At the end of the period (2010-2018), both France and the U.S. reduce pretax income inequality by 27%, for the indicator T10/B90. Using the more precise indicator T10/B50, the level of redistribution is higher, but still remarkably close for both countries (around -44%).
4 Redistribution is defined as the mechanical operation of taxes, monetary transfers, in-kind transfers
and collective expenditures affecting the gap between pretax and post-tax income inequality.
5 Consider the following example for France over the 2010-2018 period. The ratio T10/B50 is equal to
about 7.2 in terms of pretax income, i.e., on average top 10% income earners make 7.2 times more than bottom 50% income earners. In terms of post-tax income, this ratio is reduced to 4.1. This implies that redistribution reduces pretax inequality by 44% on average in France over the 2010-2018 period.
These indicators highlight that France and the U.S. carry out very similar level of redistribution in 2010-2018, despite very different policies and institutions. Consequently, the much lower level of post-tax inequality in France is not the result of higher redistribution, but almost entirely due to much higher level of pretax inequality. With our third set of results, we investigate to what extent the different dynamics of redistribution between France and the U.S. can account for the long-run evolution of income inequality. This exercise relies on a simple formula that allows to decompose the long-term evolution of post-tax income inequality between the variation in pre-tax income inequality and the change in redistribution over time. We show that the long-run decline in inequality in France over the 1900-2018 period (-65%) is due mostly to the fall in pretax inequality (-47%), and to a lesser extent to direct redistribution (-17%). The pattern of U.S. inequality over the period from 1913 to 2018 is one of a significant decline in post-tax inequality (-37%) up to the 1980s, followed by a steep increase since then, to end slightly below the inequality level of 1913 (-14%). This evolution is the result of two opposing factors: rising pretax income inequality (+7%) and rising redistribution (-21%). These results show that if inequality has decreased much more in France than in the U.S. during the 1900-2018 period, this is not due to a relatively more important increase in redistribution by the French tax and transfer system. The major factor behind this differential trend comes from the differential evolution of pretax income inequality between the two countries. Pretax income inequality has decreased relatively more in France than in the U.S. over the 1900-1983 period and has increased relatively less since 1983. In other words, both changes in pretax inequality and redistribution have had a significant impact on the historical reduction of inequality, but the former is quantitatively about three times as large as the latter.
Related literature. Our paper builds upon a long tradition of research studying the
historical evolution of income inequality. Following the pioneering work by Kuznets (1953) and Piketty (2001, 2003), a number of authors have used income tax data to construct long-run series of top income shares (see Atkinson and Piketty, 2007, 2010, for a global perspective on top incomes). Although these series have contributed to improve our understanding of inequality trends, they suffer from important limitations (Atkinson, Piketty and Saez, 2011). In particular, they cover only the top part of the distribution. They are based on fiscal income, which can diverge from national income
because of tax exempt income, tax avoidance and evasion. Finally, they focus on pretax income inequality and are therefore silent on redistributive effects of public policies between and across countries. To overcome these limitations, several recent papers have attempted to combine the various available sources in a systematic manner in order to construct long-term income series of “distributional national accounts” (DINA) (see in particular Piketty, Saez and Zucman, 2018 for pre-tax and post-tax DINA in the U.S.; Garbinti, Goupille-Lebret and Piketty, 2018 for pre-tax DINA in France). The present paper follows this work and provides a more thorough analysis of the role of redistribution in inequality dynamics. We should also emphasize that the present research is part of a broader multi-country project, namely the WID.world project, with the aim of providing long-term homogeneous series of income and wealth consistent with national accounts in as many countries as possible in the coming
years.6
Apart from the literature on long-run income inequality trends, our study contributes to several other strands of the literature. First, this paper relates to the large literature, initiated by Okner and Pechman (1974), that studies the progressivity and the tax burden of tax and transfer systems (for work related to France, see Bourguignon, 1998; Accardo et al., 2009 ; Landais, Piketty and Saez, 2011; Chanchole and Lalanne, 2012;
Eidelman, Langumier and Vicard, 2013; Bozio, Breda and Guillot, 2020).7 Our key
contribution to this literature is to construct long-term, annual series of pretax and post-tax income for France that provide a comprehensive view of how government redistribution affects inequality. Indeed, our French series cover the entire distribution,
6 See also Morgan (2017), Alvaredo, Assouad and Piketty (2019), Novokmet, Piketty and Zucman (2018)
and Piketty, Yang and Zucman (2019) for recent work on pretax income inequality in Brazil, the Middle East, Russia and China, respectively. See Saez and Zucman (2016), Garbinti, Goupille-Lebret and Piketty (2020), Martinez-Toledano (2017) for work on wealth inequality in the U.S., France and Spain, respectively.
7 Bourguignon (1998); Chanchole et Lalanne (2012), and Eidelman, Langumier et Vicard (2013) use
microsimulation models and household surveys to estimate the progressivity of the tax and transfer system for one or two given years. Accardo, et al (2009) break down disposable income reported in the national accounts by income quintiles for the year 2003. Bozio, Breda and Guillot (2020) analyzes the impact of social security contributions on labor income inequality over the 1967-2015 period. The paper most directly related to ours is Landais, Piketty and Saez (2011), which combines tax data with national accounts to estimate tax rates by pretax income groups for a given year. See also Piketty and Saez (2007), Mirrlees and al. (2010), Sutherland and Figari (2013) with EUROMOD, Bengtsson, Holmlund and Waldenström (2016), and OECD work by Zwijnenburg et al. (2016) for cross-country comparison exercises.
are fully consistent with national accounts, and consider all forms of taxes and government expenditure.
Second, our study complements the macro literature that analyzes the role of taxes and transfers on inequality dynamics (Kaymak and Poschke, 2016; Hubmer, Krussel and Smith, 2017). The use of our detailed micro series of pretax and post-tax income could improve the ability of macroeconomic models to reproduce distributional dynamics over time (Ahn et al., 2018).
Third, our paper contributes to the broad literature on the determinants of pretax income inequality. This literature has typically discussed the relative role of education policies (Katz and Murphy, 1992; Chetty et al., 2017), minimum wage (Autor, Manning and Smith, 2016), compensation bargaining (Piketty, Saez and Stantcheva, 2014), international trade and technological change (Autor et al., 2014, Acemoglu and Restrepo, 2020), as driving forces of increased inequality. Our results suggest that such “predistribution”–policies, rules and mechanisms impacting pretax income inequality–matters much more than direct redistribution in explaining differences in overall inequality between the U.S., France and possibly other European countries. Generally speaking, our findings contribute to the expending policy debate on the
notion of “predistribution” and call for a better comprehension of these mechanisms.8
The rest of this paper is organized as follows. In section 2, we describe our data sources and methodology. In section 3, we present our main results regarding the overall magnitude of redistribution in France and the U.S. In section 4, we present detailed results on the anatomy of redistribution, the role of tax progressivity, monetary transfers and in-kind transfers. In section 5, we discuss our incidence assumptions and present variants to test the robustness of our results. In section 6, we offer concluding comments and discuss research perspectives.
8 The notion of “predistribution” has played an increasingly important role in policy debates since the
Section 2. Concepts, data sources and methodology
In this section we describe the concepts, data sources and main steps of the methodology that we use in this paper in order to construct our income distribution series. Broadly speaking, we combine three main types of data: national accounts; fiscal data (income tax returns); and household surveys. We first present our income concepts. We then describe our data sources and methods to derive pretax and post-tax income series for France over the 1900-2018 period. Complete methodological details of our French specific data sources and computations are presented in the Online Data Appendix along with a wide set of tabulated series, data files and computer
codes.9
2.1. Income concepts
Our income distribution series are constructed using income concepts that are based
upon national accounts categories.10 As such, four basic income concepts (with a
number of variants) are of interest: pretax national income and pretax factor income, post-tax disposable income and post-tax national income. By construction, average income per adult is equal to average national income per adult for all concepts (except
post-tax disposable income).11
Pretax income (or pretax national income) is our benchmark concept to study the
distribution of income. Pretax income is equal to the sum of all income flows going to labor and capital, after taking into account the operation of the pension and unemployment insurance systems, but before taking into account other taxes and
9 We also refer the readers to our companion paper (Garbinti, Goupille-Lebret and Piketty, 2018), where
we further describe the sources and methods used for the construction of pre-tax DINA series for France. A longer and more complete discussion of the general methodological issues involved in creating DINA estimates (not specific to France) is presented in Alvaredo et al. (2020).
10 The reason for using national accounts concepts is that they are defined and estimated in the same
manner in all countries and time periods, and aim to be independent from the fiscal legislation of the given country/year.
11 National income is defined as GDP minus capital depreciation plus net foreign income, following
transfers. That is, we deduct pension and unemployment contributions, and add
pension and unemployment distributions.12
Factor income (or pretax factor income) is equal to the sum of all income flows going
to labor and capital, before considering the operation of the pension and unemployment system. That is, we do not deduct pension and unemployment contributions and exclude pension and unemployment distributions as they are not factor incomes. One problem is that retired individuals typically have very small factor income, so that inequality of factor income tends to rise mechanically with the fraction of old-age individuals in the population, which biases comparisons over time and across countries. This is why we use pretax national income as our benchmark concept
of pretax income.13
Post-tax disposable income is defined as pretax income minus all forms of taxes
plus all individualized monetary transfers.
Post-tax national income is equal to the sum of all income flows going to labor and
capital, after considering the operation of the pension and unemployment system, and also after taking into account all forms of taxes and transfers (monetary transfers, in-kind transfers, and collective consumption expenditure). In other words, post-tax income is defined as post-tax disposable income plus in-kind transfers and collective consumption expenditure.
Note also that our income series refer to the distribution of income among equal-split
adults (i.e. the income of married couples is divided into two).14
We compute national income and the various subcomponents of pretax and post-tax national income using the official national accounts established by the French national
12This approach does not incorporate the redistribution carried out ex post by the pension and UI
systems over the life-cycle (with redistributive properties and life-expectancy differentials).
13 Note that looking at the distribution of factor incomes among the working-age population can yield
additional insights: it allows to better measure the distribution of labor costs paid by employers (see our companion paper Garbinti, Goupille-Lebret and Piketty (2018) for a presentation of factor income series).
14 Alternative series of pretax income at the tax-unit level (married couples and singles) as well as
individualistic-adults series (i.e., labor income is allocated to each individual income earner within the couple) could be found in our companion paper Garbinti, Goupille-Lebret and Piketty (2018).
statistical institute (INSEE) for the 1949-2018 period.15 All data files and complete methodological details are given in Online Appendix A.
In the present paper, we investigate the impact of the tax and transfer system on inequality. Therefore, we focus on the construction and the comparison of pretax national income, post-tax disposable income, and post-tax national income series. 2.2 Data sources and methods for the 1970-2018 periods
2.2.1 Data sources
We start with the micro-files of income tax returns that have been produced by the French Ministry of Finance since 1970. We have access to large annual micro-files since 1988. These files include about 400,000 tax units per year, with large oversampling at the top (they are exhaustive at the very top; since 2010 we also have access to exhaustive micro-files, including all tax units, i.e. approximately 37 million tax units in 2010-2012). Before 1988, micro-files are available for a limited number of years (1970, 1975, 1979, and 1984) and are of smaller size (about 40,000 tax units per year).
These micro-files allow us to estimate the distribution of fiscal income, i.e. income reported on income tax returns. In order to estimate the distribution of national income (pretax and post-tax), we need to combine income tax micro-files with other data sources, namely national accounts and household surveys, and to apply a number of imputation/simulation rules. We start by describing how we move from fiscal income to total pretax income, before describing how we deal with taxes and transfers to obtain post-tax income.
2.2.2 Construction of pretax national income series (1970-2018)
15 For the transfers, we also rely on CNAF and DREES files that report the number of beneficiaries and
the aggregate amount of each transfer since 1946. For the 1900-1948 period, we use the historical series of national accounts reported in Piketty and Zucman (2014), which rely on the detailed series constructed by Villa (1994).
The gap between fiscal income and national income can be decomposed into three components: tax-exempt labor income, tax-exempt capital income, and production taxes. Before we take each of these three components in turn, note that income tax micro-files allow us to split fiscal labor income into three components (wages; pension and unemployment benefits; and labor component of mixed income, which we assume for simplicity to be equal to 70% of total mixed income) and fiscal capital income into four components (tenant-occupied rental income; dividend; interest; and capital
component of mixed income, i.e., 30% of total mixed income).16
From fiscal labor income to pretax labor income
Tax-exempt labor income, which we define as the gap between national-accounts labor income and fiscal labor income, consists mainly of non-contributive social security contributions (SSCs) and, to a lesser extent, of non-taxable compensation
items such as health benefits and a number of other in-kind benefits.17 To capture total
pretax labor income, we proceed as follows. We compute non-contributive SSCs (employer and employee) by simulating the complexity of the different SSC schemes
in each year.18 In the absence of specific information, we simply impute non-taxable
compensation items in proportion to fiscal labor income.
From fiscal capital income to pretax capital income
Tax-exempt capital income raises more complicated issues. Fiscal capital income
differs from national capital income for three main reasons.First, some capital income
components are fully tax-exempt and therefore not reported in income tax returns. Tax-exempt capital income includes three main components: income going to tax-Tax-exempt
16 Fiscal capital income also includes realized capital gains, but we do not use this variable for imputation
purposes in our benchmark series (because it is too lumpy). Income tax micro-files also allow us to split mixed income into different forms of self-employment activities (BIC, bénéfices industriels et commerciaux; BNC, bénéfices non commerciaux; BA, bénéfices agricoles), but we do not use this decomposition.
17 Non-contributive SSCs refers to contributions funding either health care spending or child benefits.
Note that we have also computed contributive SSCs (or unemployment and pension contributions), which are excluded by definition from pretax income but included in factor income (see Section 2.1).
18 Our simulations take into account the different SSC schedules as well as reductions in employer SSCs
and flat-rate income tax (CSG and CRDS). For more details, see online Appendix B and Stata code. See also Bozio, Breda and Guillot (2020) for a more complete description of SSC schemes in France.
life insurance assets19; owner-occupied rental income; other tax-exempt interest income paid to deposits and saving accounts. Second, some capital income components are included into the income tax returns but their aggregate may differ from those reported in national accounts due to tax avoidance or tax evasion. For
example, a significant part of dividends is missing in the tax data.20 Finally, corporate
retained earnings and corporate taxes are not directly received or paid by individuals and are therefore excluded from income tax. One needs to make implicit incidence assumptions on how to attribute them. As a result, these elements are either missing or under-reported in the income tax returns and need to be imputed.
Regarding owner-occupied housing, life insurance assets, and deposits and saving accounts, we use available wealth and housing surveys in order to impute these assets on the basis of labor income, financial income and age. We then attribute the corresponding asset income flows on the basis of average rates of return observed in national accounts for this asset class (See our companion paper Garbinti, Goupille-Lebret and Piketty 2020 for a detailed description of the methodology).
For capital income components reported in the income tax micro-files21, we conduct
the following reconciliation exercise. We simply adjust proportionally each of these capital income components in order to match their counterpart in national accounts
(reported in Online Appendix A, Table A8).22 The assumption behind this simple
adjustment is that tax evasion and tax avoidance behaviors do not vary along each
income-specific distribution.23
19More precisely, this category regroups income attributed to life insurance and pension funds. Before
1998, life insurance income was entirely exempt from income tax. Since 1998, only capital income withdrawn from the account are taxed (see Goupille-Lebret and Infante 2018 for more details). As a result, total life insurance income reported in the tax data corresponds to less than 5% of its counterpart in national accounts.
20 Individuals can legally avoid dividend tax using complex tax optimization strategies. Such schemes
imply that dividends have to be distributed to and kept in holding companies. Dividend tax will eventually occur when the holding company will distribute dividends to its shareholders.
21 i.e. tenant-occupied rental income; dividends; interests from debt assets; and capital component of
mixed income (i.e., 30% of total mixed income).
22 That is, we multiply each individual capital income component reported in the micro-files by the
corresponding national-income/fiscal-income ratio.
23Alstadsaeter, Johannesen and Zucman (2019) provide evidence that tax evasion rises sharply with
wealth. Our assumption is therefore conservative and our results should be seen as a lower bound of the true level of income concentration.
Regarding corporate retained earnings and corporate taxes, we impute them in proportion to individual dividends, life insurance income, and interests, i.e., total financial income excluding tax-exempt interest income paid to deposits and saving
accounts.24 More precisely we impute to individuals the fraction that can be attributed
to individuals, i.e., we subtract the fraction of domestic corporate capital that can be attributed to the government.
Incidence of production taxes
Finally, note that production taxes (in the SNA 2008 sense) include a number of indirect taxes, which in effect are paid by corporations before they can distribute labor and capital income flows, and are therefore excluded from fiscal income.
These productions taxes are split into four categories: i) consumption taxes, which include value added taxes and several taxes on energy products, tobacco, alcohol beverages, among others; ii) professional taxes; iii) household property taxes; iv) taxes on wages. We attribute to individuals these taxes using the following incidence assumptions and imputation rules. First, consumption taxes are borne by consumers only, proportionally to consumption (disposable income minus saving). Second, we assume that household property taxes only fall on housing assets and attribute them to individuals in proportion to their housing assets. Finally, we consider taxes on wages only fall on labor and impute them proportionally to social security contributions. More generally, we should stress that our implicit tax incidence assumptions are relatively rudimentary and could be improved in future estimates. However, we have tested a number of alternative tax incidence assumptions, and found only second-order effects on the level and time pattern of our pretax income series.
2.2.3 Construction of post-tax national income series (1970-2018)
To move from pretax to post-tax income, we deduct all taxes and add back all transfers. We now present briefly the different elements of the French tax and transfer system
24 In France, tax-exempt saving accounts (like livret A) are financial products that are regulated by the
and how we simulate them. A more complete description of the methodology can be found in Online Appendix B.
The French tax and transfer system
The French tax system includes a large variety of taxes that we can regroup into five categories: indirect taxes, capital taxes, progressive income taxes, flat income taxes, and non-contributive social contributions.
Indirect taxes make up about 14% of national income today. It includes consumption taxes (80% of total indirect taxes), professional taxes, and residence taxes.
Capital taxes amount to about 4% of national income and consist of corporate taxes, wealth taxes, property taxes, and bequest and gift taxes.
From 1991, France is characterized by the coexistence of two taxes on income: a progressive income tax—which is the historical income tax created in 1914—and a flat
income tax called general social contribution.25 In addition to these two income taxes,
capital income is also subject to several other types of social contributions with flat tax
rates.26 We regroup the general social contribution and the other types of social
charges under the general term of “Flat-rate income taxes” (7% of national income) and refers to the historical income tax as progressive income taxes (4% of national income).
Finally, non-contributive social contributions include all SSCs that are not dedicated to the financing of the pension and unemployment systems as well as taxes on wages. Altogether, they make up to 11% of national income.
Government spending can be decomposed into three distinct categories: monetary transfers, in-kind transfers, and collective consumption expenditure.
Monetary transfers amount to about 4% of national income and include various types
of housing benefits, family benefits, and social benefits.27
25 The historical income tax is called "Impôt sur le revenu" (IR) and the general social contribution is
called "contribution sociale généralisée" (CSG).
26 Note that since 2018, the two income taxes and the different social contributions have been merged
into a unique 30% flat tax for capital income.
27 The housing benefits regroup “Allocation de Logement Familiale” (ALF), “Allocation de Logement
Personnalisée” (APL) and “Allocation de logement sociale” (ALS). The family benefits include “Allocation Familiale” (AF), “Complément Familial” (CF), “Allocation Pour Jeune Enfant” (APJE), “Prestation d'Accueil du Jeune Enfant” (PAJE), “Allocation de Rentrée Scolaire” (ARS) and “Allocation de Soutien
In-kind transfers are all transfers that are not monetary (or quasi-monetary) and can be individualized. They correspond to individual goods and services produced directly or reimbursed by government. In-kind transfers make up to 20% of national income (including 12.5% for health and 6.5% for education expenditure).
Collective consumption expenditure regroups all consumption services that benefit to the community in general and cannot be individualized (spending on defense, police, the justice system, public infrastructure, etc.). It amounts to 10% of national income.
Simulation and imputations
In order to simulate the French tax and transfer system, we proceed as follows. First, we exploit the richness of the income tax micro-files to simulate very precisely all monetary transfers and taxes levied on income (progressive and flat income taxes, and social security contributions). In particular, we are able to consider all changes in tax schedules or specific tax deductions, exemptions and credits over time. We also use all socio-demographic variables reported in micro-files (number and age of dependents, marital status, disability status, etc.) in our simulation exercises.
Second, when the appropriate tax base is not directly observable in our micro-files, we
use our estimated variables of wealth28 and income as a proxy. Wealth taxes, property
taxes, and residence taxes are computed using our estimated values of taxable wealth, housing assets, and rents paid, respectively. Although imperfect, this methodology still allows us to simulate the different tax schemes and the specific exemptions, discounts and tax cap for low-income earners, disabled, widows or elderly. We should also stress that we have made every attempt to collect and use additional information from official reports to check and improve our simulations. For example, our simulations of wealth taxes are fully consistent with wealth tax tabulations, which report the number of taxpayers as well as average taxable wealth and tax paid by tax bracket. The number
Familial” (ASF). The social benefits regroup “Revenue de Solidarité Active” (RSA), “Prime d’Activité” (PPA), “Minimum Vieillesse” (MV) and “Allocation de Solidarité aux Personnes Agées” (ASPA).
of beneficiaries of each monetary transfer is also consistent with the statistics provided by official reports (CNAF and DREES files).
Third, we must impute the remaining taxes and transfers based on rules and tax incidence assumptions. As explained in the previous section, professional taxes, and sales and excise taxes are assumed to be borne by consumers only, proportionally to their consumption (disposable income minus saving). Corporate taxes are allocated proportionally to dividends, life insurance income, and interests.
We now present the choices we made to allocate in-kind transfers and collective expenditure. Few studies provide detailed measures of the redistributive impact of
non-monetary transfers, and even fewer offer estimates of changes over time.29 As we
know relatively little about who benefits from this government spending, we need to make some assumptions about their distribution. We are well aware that these assumptions could be improved with studies that could bring a more precise light over
their true distributive effects.30
Our baseline scenario (V1) assumes i) a lump-sum imputation of health care
expenditure to individuals31, and ii) a proportional imputation to post-tax disposable
income for education spending and collective expenditures. A lump-sum imputation attributes the same average monetary value to each adult individual, and is therefore characteristics of a strong redistributive impact of these expenditures. A proportional imputation to post-tax disposable income is, on the contrary, neutral to the measurement of inequality.
In order to assess the sensitivity of our results to the imputation of in-kind transfers and collective expenditure, we also present two alternative variants. We impute all these public spending either on a lump-sum basis (scenario V2) – the most redistributive assumption – or proportionally to post-tax disposable income (scenario v3). This last
29For France we rely on the few studies done on health expenditures (e.g., Jusot et al., 2016) or
education expenditures (Allègre et al., 2012; Courtioux and Lignon, 2017).
30 Nonetheless, including these public spending is a necessary step to compare countries with
differential in-kind vs. monetary transfers: countries with higher level of in-kind transfers would appear artificially poorer if one used only a measure of disposable income.
31For France which is characterized by a single-payer system where almost all health spending is paid
for by the government, healthcare spending is attributed as a fix lump sum to all adults. For the U.S., healthcare spending is assigned on a lump sum basis to the beneficiaries.
scenario has the advantage of being neutral and to be equal to disposable inequality measures, i.e., after tax and monetary transfers.
Finally, in order to ensure that aggregate pretax and post-tax national incomes match exactly with aggregate national income, we follow Piketty, Saez and Zucman (2018) and attribute 50% of government deficit (or surplus) in proportion to taxes and 50% in proportion to transfers and expenditures. This assumes that fiscal adjustment will be borne equally by taxes and spending. In practice, this makes very little difference (except in years with very large deficit or surplus).
2.3 Data sources and methods for the 1900-1969 periods
Unfortunately, no income tax micro file is available in France before 1970, so we have to use income tax tabulations. Detailed income tax tabulations have been produced by the French Finance Ministry since the creation of income tax in France in 1914 (first applied in 1915). These tabulations are available on an annual basis since 1915 (with
no exception) and are based upon the universe of all tax units.32 They report the
number of taxpayers, total income and income taxes paid for a large number of income brackets.
These tabulations were first used in a systematic manner by Piketty (2001, 2003) to estimate top shares of fiscal income and then by Garbinti, Goupille-Lebret and Piketty (2018) to estimate the complete distribution of fiscal and pretax income.
In the present paper, we develop a very simple procedure to estimate the distributions of post-tax disposable and post-tax national income over the 1900-1969 period.
From the distribution of fiscal to disposable income (1900-1969)
Going from fiscal to disposable income requires to deduct bequest and income taxes
from fiscal income and add back monetary transfers.33
32 We also rely on the estimates of the distribution of income for years 1900 and 1910 produced by the
French Finance Ministry in the context of the parliamentary debates about the creation of an income tax (using data from various sources, including property taxes and inheritance taxes).
33 Note that fiscal income is already net of production taxes, corporate taxes and social security
contributions. In addition, the tax system was much less complex over the 1900-1969 period as flat income taxes and wealth taxes did not exist.
Conceptually, the distribution of post-tax disposable income can be recovered from the distribution of fiscal income using the following equation:
𝐷𝑖𝑠𝑝𝑝𝑡= 𝑎𝑝𝑡∙ 𝐹𝑖𝑠𝑐𝑝𝑡 ∙ 𝐷𝑖𝑠𝑝𝑡/𝐹𝑖𝑠𝑐𝑡
Where 𝐹𝑖𝑠𝑐𝑝𝑡 and 𝐷𝑖𝑠𝑝𝑝𝑡 are fiscal and disposable income accruing to percentile p at
time t, 𝐷𝑖𝑠𝑝𝑡/𝐹𝑖𝑠𝑐𝑡 is the ratio between average disposable income and average fiscal
income at time t, and 𝑎𝑝𝑡 are correction factors capturing the redistributive effects of
monetary transfers, and bequest and income taxes by year and percentile.
Our objective is to estimate 𝑎𝑝𝑡 over the 1900-1969 period as 𝐹𝑖𝑠𝑐𝑝𝑡 is provided by
Garbinti, Goupille-Lebret and Piketty (2018) and 𝐷𝑖𝑠𝑝𝑡/𝐹𝑖𝑠𝑐𝑡 can be computed using
the National Accounts.
Before World War 1, we can assume that our correction factors 𝑎𝑝𝑡 are equal to 1.
Indeed, income taxes and monetary transfers did not exist and the redistributive effects of bequest taxes were negligible as they represented less than 0.7% of national income and were based on small tax rates.
Over the 1915-1969 period, one simple approach (referred to as the “simple method”) would be to assume that correction factors rise linearly from 1915 to 1970. While this approach is clearly an approximation, it has the merit to capture the trend in redistribution induced by the progressive development of monetary transfers, and bequest and income taxes over the 1915-1969 period. One drawback of this simple approach is that it does not capture non-linear changes in redistribution over time. To overcome this limitation, we go one step further and develop a more sophisticated interpolation procedure (our baseline method). This procedure consists in splitting the
correction factors 𝑎𝑝𝑡 into three tax-specific correction factors (income taxes/bequest
taxes/ monetary transfers) and use all available information to estimate their changes over time. In particular, the correction factors for income taxes are constructed using income taxes paid each year by income group as reported in the tax tabulations. Correction factors for bequest taxes and monetary transfers take into account the yearly evolution of their macroeconomic aggregates as reported in the National Accounts.
In order to assess the robustness of our 1900-1969 series, Appendix Figure 1 reports the evolution of the bottom 50% (Panel A) and the top 10% (Panel B) shares for disposable income (simple or baseline method) as well as for pretax income over the 1900-2018 period. Appendix Figure 1 shows that disposable income shares derived from the simple and baseline methods are almost identical except during the 1919-1925 period where exceptional monetary transfers were implemented and could by definition not be taken into account by the linear interpolation implemented in the simple method. If we exclude the 1919-1925 period, the fact that the simple and baseline methods deliver consistent income shares reflects that the redistribution induced by taxes and monetary transfers is likely to follow a smooth and continuous trend over the 1900-1969 period.
Disposable and pretax income shares are very close over the 1900-1969 denoting a small impact of taxes and monetary transfers on inequality. Although our method should be seen as exploratory and incomplete, we argue that it should not under-estimate the level and evolution of disposable income inequality. Indeed, pretax and disposable income shares are also very similar over the 1970-1975 period where a microsimulation exercise is conducted on micro-files.
From the distribution of disposable income to post-tax income (1900-1969)
The last step consists in estimating the different variants of post-tax income (V1, V2, V3) by allocating the macroeconomic aggregates of in-kind transfers and collective expenditure reported in the National Accounts either on a lump-sum basis or proportional to disposable income.
Section 3. Quantifying Redistribution
We start by comparing the long-run evolution of pretax and post-tax income inequality between France and the U.S., before proposing a quantification of the extent of redistribution in these two countries.
Section 3.1. The long-run evolution of pretax and post-tax income inequality: France vs. United States.
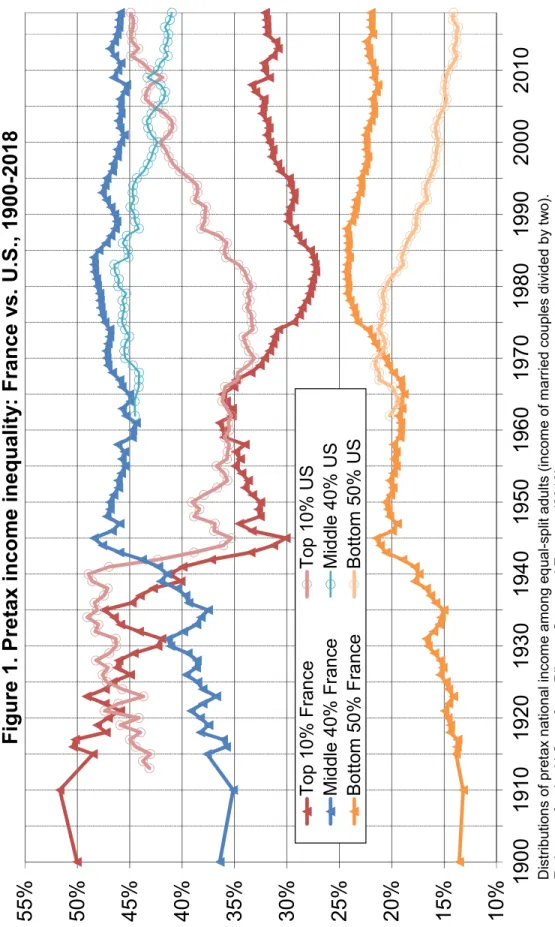
We report on Figure 1 the evolution of pretax income inequality in France and the United States over the 1900-2018 period, as measured by the shares of total pretax
income going to the top 10%, the middle 40%, and the bottom 50%.34
For France, we observe a large decline of the top 10% pretax income share (T10) from about 51% in 1900-1910 to 27% in 1983. This fall has been at the advantage of both the bottom 50% (B50), whose pretax income share increased from 13% to 24%, and the middle 40% (M40), whose pretax income share increased from 36% to 48%. Since 1983, this trend reversed, with a moderate increase in the top 10% income share (+5 percentage points, from 27% in 1983 to 32% in 2018) and a corresponding erosion of both the bottom 50% and the middle 40% income shares. So far, this turnaround has been quantitatively much smaller than the decline that occurred between the 1910s and the early 1980s, but it is nevertheless a significant change in direction.
While the pattern of both the French and the U.S. top 10% income shares over the century is U-shaped, some important differences need to be emphasized.
First, while both countries experienced a dramatic drop in the top 10% pretax income share during WWII and then a stabilization in the following two decades, French top 10% income share continued to decline during the 1968-1983 period. In contrast, the decline of the U.S. top 10% income share is concentrated over the 1940-1945 period. As a result, the decrease in the top 10% income share in France is significantly larger than the one experienced by the U.S. during the 1913-1980 period (-43% vs. -23%).
34 U.S. pretax income series are provided by Piketty et al. (2018). The decomposition of the bottom 90%
income share between the bottom 50% and the middle 40% shares is available for the U.S. only since 1962.
Second, while we observe a rise in pretax income inequality in both countries since the early 1980s, top 10% income shares have increased twice as much in the U.S. (+35%) as in France (+16%) over the 1980-2018 period.
Overall, the French top 10% income shares have decreased dramatically since 1900 (-36%). In contrast, U.S. pretax income inequality has now returned to its pre-1940 level, the highest in the period of study, and is very close to the level observed in France at the beginning of the 20th century.
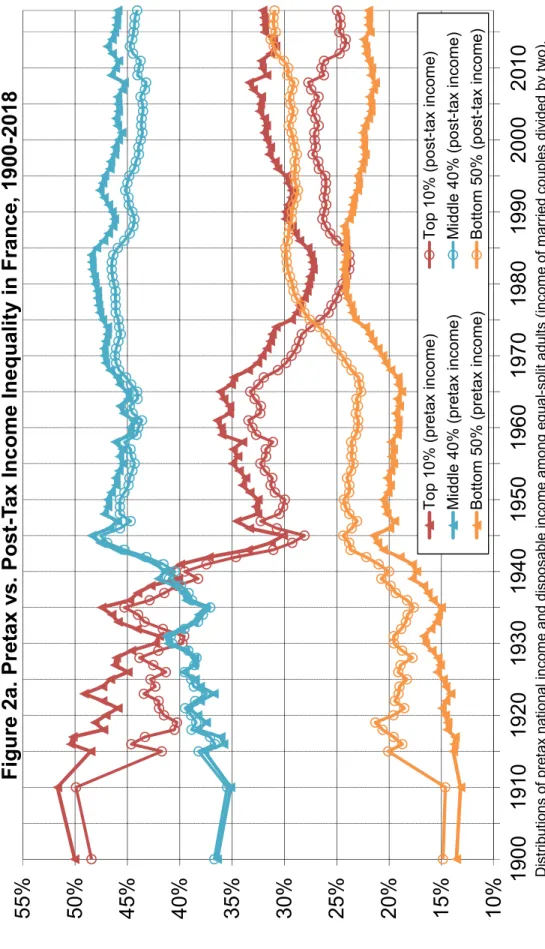
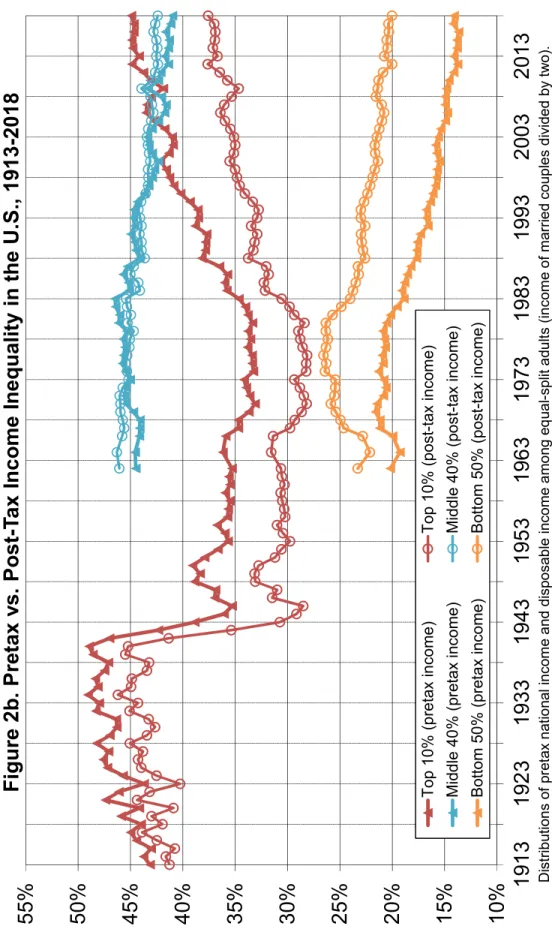
Figure 2 compares the evolution of pretax and post-tax income inequality in France (Panel A) and in the U.S. (Panel B) over the 1900-2018 period. Post-tax income is defined as pretax income minus all taxes plus all monetary transfers, in-kind transfers,
and collective expenditures.35 Two stylized facts are worth highlighting from these
series.36
First, the evolution of pretax and post-tax income inequality has been far from steady and differs strongly between the two countries. While pretax inequality has followed a shaped pattern in both countries, post-tax inequality is L-shaped in France and U-shaped in the U.S. The increasing progressivity of the French tax and transfer system has been able to counteract the gradual rise in pretax income inequality, leading to a relatively constant level of post-tax income inequality since the early 1980s. This contrast strongly with the U.S. case, where rising redistribution has not matched the dramatic increase in pre-tax inequality.
Second, the difference between pretax and post-tax affects mostly the top 10% and bottom 50% income shares in both countries, leaving almost unchanged the middle 40% share. The difference in income shares of the middle group M40 is at most 2-3 p.p. in France, while it is around 1 p.p. in the U.S. By contrast T10 income share is reduced significantly by redistribution, for instance in 2018 from 32% to 25% in France and from 45% to 38% in the U.S., while B50 income share rises from 22% to 31% in France, respectively from 14% to 20% in the U.S.
35 Our benchmark scenario assumes a lump-sum imputation of health care expenditure to individuals,
and a proportional imputation to post-tax disposable income for education spending and collective expenditures. We present in section 5.1 variants of imputation assumptions for non-monetary transfers.
36 Note that our stylized facts are robust to the use of alternative concepts of post-tax income (variants
Section 3.2. Measuring the extent of redistribution
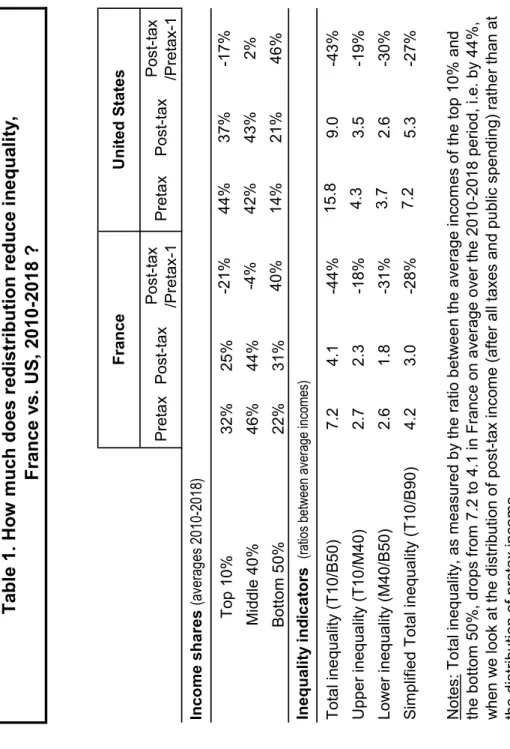
Table 1 presents some key statistics on the extent of redistribution in France and the U.S. in the recent period (2010-2018), measured as the difference between post-tax and pretax income shares. Thus defined, redistribution reduces the top 10% income shares by 21% in France against 17% in the U.S., while it increases the bottom 50% income share by 40%, compared to 46% in the U.S. In both countries the middle 40% share is only very modestly affected–even if it is noticeable that redistribution marginally benefits the middle 40% in the U.S., while it is negative in France.
One simple inequality indicator which can be used to assess the extent of redistribution is the ratio between the average income of the top 10% income group and the average income of the bottom 50% income group (T10/B50). In terms of pretax income, this ratio is equal to 7.2 in France, i.e., on average top 10% income earners make 7.2 times more than bottom 50% income earners, compared to a ratio of 15.8 in the U.S. In terms of post-tax income, this ratio is reduced to 4.1 in France, i.e., a reduction of 44%, compared to 9.0 in the U.S., i.e., a reduction of 43%. In that sense, one can say that redistribution reduced pretax inequality by 44% in France against 43% in the U.S. over the 2010-2018 period.
In Online Appendix Table 1, we have also computed other inequality indexes–such as Gini and Theil indexes and Palma and P75/P25 ratios–to measure the change in
inequalities over time and find similar results.37 We prefer to highlight income ratios as
inequality indicator for several reasons. First, they are intuitive and transparent statistics whose interpretation is straightforward. Second, they are not data-demanding and can therefore be used over historical data, which are usually not available at a very disaggregated level. Finally, they allow for a clearer decomposition of the role played by redistribution on inequality in the upper and lower segments of the distribution (while synthetic indexes like Gini and Theil tend to blur these distinctions). For instance, one can see that the 44% reduction in inequality in France comes primarily from the decline from bottom-end inequality. That is, top-end inequality (as measured by the ratio T10/M40) is reduced by 18% on average over the 2010-2018
37 All the inequality indicators depict an increase in redistribution for France and the U.S. over the
1970-2018 period. Redistribution was relatively higher in the U.S. over the 1970-1979 period. Since 2010, both countries carry out similar level of redistribution whatever the inequality indicator used. If anything, the level of redistribution in France over the 2010-2018 period appears slightly higher than in the U.S. when using the Gini index and slightly lower when using the Theil index.
period, while bottom-end inequality (as measured by the ratio M40/B50) is reduced by 31%. Very similar numbers are found for the U.S. Top-end inequality (ratio T10/M40) is reduced by 19%, while bottom-end inequality (M40/B50) is reduced by 30%.
These indicators highlight that France and the U.S. carry out very similar level of redistribution in 2010-2018, despite very different policies and institutions. Consequently, the much lower level of post-tax inequality in France is not the result of higher redistribution, but almost entirely due to much higher level of pretax inequality. Section 3.3. How much does redistribution reduce inequality over time?
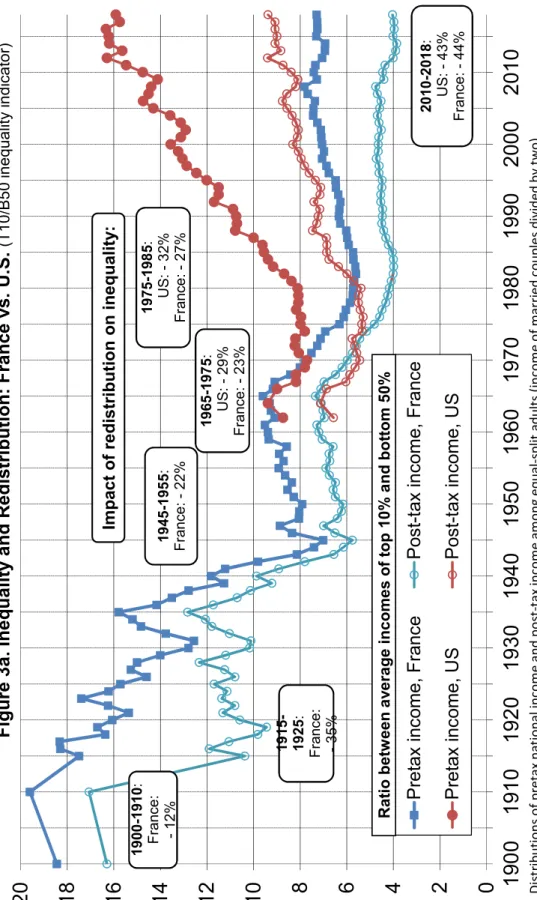
We now turn to an analysis of long-term changes in redistribution between France and the U.S. Figure 3 presents the evolution of inequality ratios for pretax and post-tax income over the 1900-2018 period for the two countries. Panel A presents the evolution of the ratio T10/B50, which is available only from 1962 onwards for the U.S.
In terms of pretax income, French top 10% income earners used to earn about 18 times more than bottom 50% income earners in 1900. The ratio T10/B50 has decreased almost continuously from 18 in 1900 to 5.6 in 1983, and increased since then to 7.3 in 2018.
The post-tax income ratio decreased dramatically during WWI, from 17 in 1910 to 9.4 in 1919, and then stabilizes around 10.5 over the 1920-1929 period. After 1929, post-tax income followed closely the prepost-tax income ratio up to the mid-1970s, then decreased more rapidly than the pretax ratio over the 1974-1984 period, before stabilizing around 4. In the 1960s, inequality indicators were similar in the U.S. and in France, with ratios around 9 for pretax income and 7 for post-tax income, decreasing in both countries. From 1980 onwards, U.S. inequality indicators start increasing sensibly, along with measures of redistribution. France’s path diverges here with a much less pronounced increase in pre-tax inequality, but with a similar increase in redistribution. At the end of the period, both countries reduce pretax inequalities by 43%-44%, albeit with considerable difference in the level of pretax and post-tax inequalities.
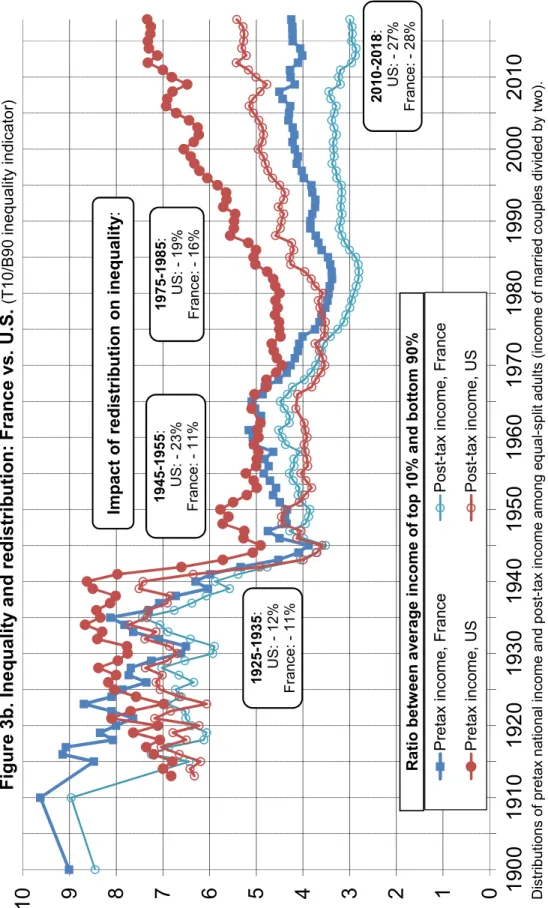
To adopt a long-term perspective, panel B of Figure 3 presents the ratio T10/B90 which
is available for both countries over the entire period of study.38 During the 1925-1935
period, both France and the U.S. had T10/B90 post-tax ratios around 7, with similar redistribution levels (around 12% reduction). After WWII, both countries experienced a very steep drop in inequality, which was partly reversed in the U.S. despite increasing redistribution.
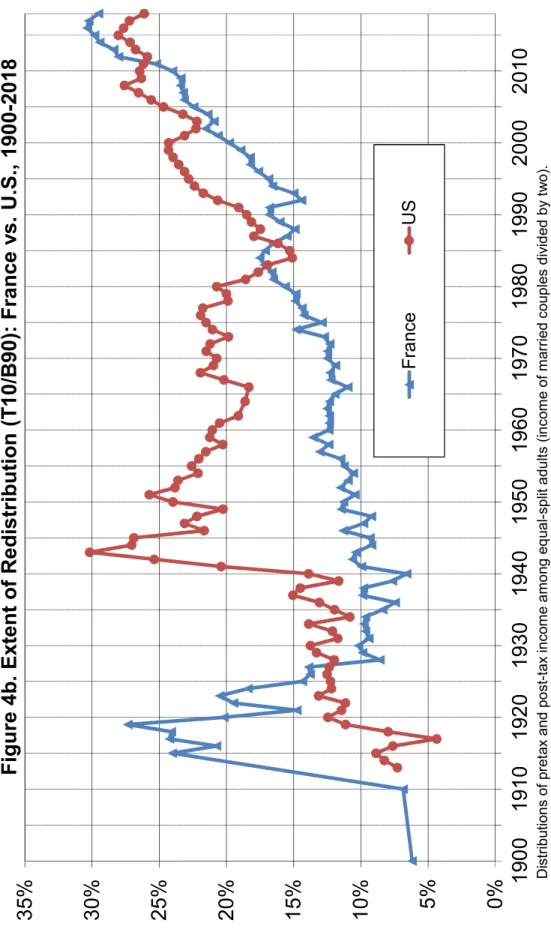
Figure 4 presents the annual evolution of our redistribution indicator, i.e., the percentage reduction from pretax to post-tax inequalities for T10/B50 (panel A) and T10/B90 (panel B). The T10/B50 indicator highlights the massive shock that WWI represents for France. During the war, and the following years, the very large health care spending and monetary transfers to veterans and widows, funded by debt and increased taxation have all contributed to that temporary spike in redistribution. From 1928 onwards, the extent of redistribution has been almost continuously increasing in France, most notably since 1973. The U.S. presents a similar picture of increasing redistribution, starting from very similar levels in both countries in the 1960s (around 25% reduction of pretax inequality), and reaching 45% of reduction at the end of the period in both countries. If one looks at the T10/B90 indicator (panel B), the shock represented by wars is evident in both countries – WWI for France and WWII for the U.S.– but contrary to France, the U.S. maintained after the war a high level of redistribution through the 1950s, 1960s and 1970s. With that indicator, the U.S. was the most redistributive country post WWII until the early 1980s, as France increased its level of redistribution steadily from 1973 onwards. Overall, the impact of redistribution on inequality has increased dramatically over time. Over the 1900-1914 period, redistribution played a modest role by reducing inequality between the top 10% and the bottom 90% income groups by 7% in France and in the U.S. In contrast, it reduced the same inequality indicator by 28% over the 2010-2018 period, in both countries. Interestingly, redistribution has increased first in the U.S. where higher level of redistribution is noticeable as soon as 1945, whereas in France redistribution increased mostly from the mid-1970s.
38 Note that the use of this alternative indicator is unlikely to affect our long-term trends and
interpretations as the evolution of T10/B50 and T10/B90 are highly correlated. Using the average income of the bottom 90% group over the bottom 50% group will mechanically decrease the level and the changes in redistribution and inequality (see Table 2).
Panel C of Fig. 4 presents the same index of redistribution with the ratio T10/B90 comparing the benchmark estimate of post-tax income (V1) with the V3 variant where health care spending is allocating proportionally to disposable income. That latter measure is equivalent to disposable income, after tax and monetary transfers. One can see with this figure that redistribution has been mostly in the form of tax and transfers in the U.S. up to the 1970s, at a time this form of monetary redistribution was still limited in France. Since the 1970s, both countries have experienced a form of convergence with a strong increase in monetary transfers in France and an increase in health care spending in the U.S. Comparing estimates of post-tax income with disposable income highlights the importance of including non-monetary transfers in cross-country analysis of redistribution, and not focusing exclusively on the tax and benefit system.
Panel D of Figure 4 presents another alternative assumption for collective expenditures (scenario V2, assuming lump-sum gains of all collective expenditures). The general pattern is very similar except that the level of redistribution is much higher in both countries.
This long-term analysis has highlighted that the reduction of inequality implied by redistribution is significant in both countries and increasing throughout the entire 20th century, even though not at the same pace and in the same period. We now turn to an attempt to decompose changes in post-tax inequality to uncover what have been the main drivers of inequality over the last century.
Section 3.4. Long-term decomposition of changes in inequality indicators
In order to quantify the respective role of falling pretax income inequality and rising redistribution in the long-term decline of post-tax inequality in France, we rely on the following formula: 𝐼𝑛𝑒𝑞𝑡2𝑃𝑜𝑠𝑡 𝐼𝑛𝑒𝑞𝑡1𝑃𝑜𝑠𝑡= 𝐼𝑛𝑒𝑞𝑡2𝑃𝑟𝑒 𝐼𝑛𝑒𝑞𝑡1𝑃𝑟𝑒× 𝐼𝑛𝑒𝑞𝑡2𝐷𝑖𝑠 𝐼𝑛𝑒𝑞𝑡2𝑃𝑟𝑒 𝐼𝑛𝑒𝑞𝑡1𝐷𝑖𝑠 𝐼𝑛𝑒𝑞𝑡1𝑃𝑟𝑒 × 𝐼𝑛𝑒𝑞𝑡2𝑃𝑜𝑠𝑡 𝐼𝑛𝑒𝑞𝑡2𝐷𝑖𝑠 𝐼𝑛𝑒𝑞𝑡1𝑃𝑜𝑠𝑡 𝐼𝑛𝑒𝑞𝑡1𝐷𝑖𝑠 (1)
Where 𝐼𝑛𝑒𝑞𝑃𝑟𝑒, 𝐼𝑛𝑒𝑞𝑃𝑜𝑠𝑡 and 𝐼𝑛𝑒𝑞𝑃𝑜𝑠𝑡 are the inequality indicators (e.g., ratio T10/B50)
computed using either the concept of pretax (Pre), disposable (Dis) or Post-tax (Post)
(1) formalizes the decomposition of post-tax inequality into three terms: i) changes in pretax inequality, ii) changes in redistribution due to taxes and cash transfers, and finally iii) changes in in-kind and collective expenditures.
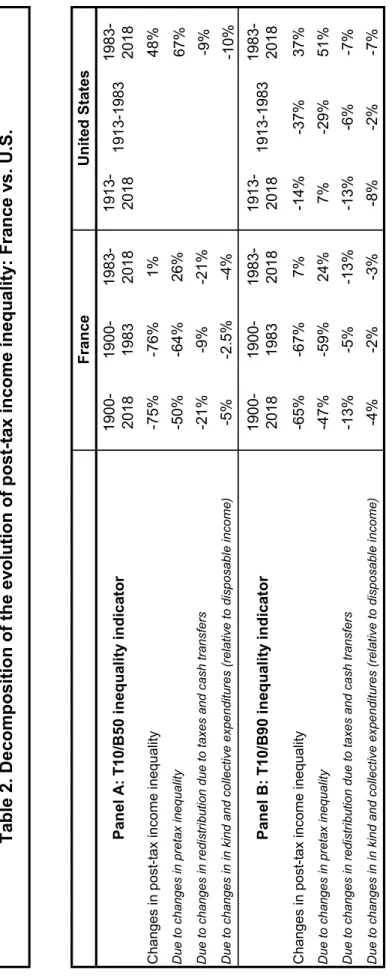
Table 2 presents this decomposition for the T10/B50 indicator (panel A) and for the T10/B90 indicator (panel B) for both France and the U.S.
For France, the overall decline in post-tax T10/B50 inequality over the 1900-2018 period (-75%) can be ascribed mostly to a decline in pre-tax inequality (-50%), and somewhat to tax and monetary transfers (-21%). Reduction of inequality from in-kind transfers or collective expenditures is comparatively very small (in our baseline scenario -5%).
The evidence is qualitatively similar using the indicator T10/B90 with respectively an overall decline in inequality of -65%, explained mostly by pretax inequality changes (-7%) and taxes and monetary transfers (-13%). For the U.S., the overall reduction in post-tax T10/B90 inequality over the 1913-2018 period (-14%) is the result of an increase in pretax inequality (+7%) corrected by an increasing redistribution from taxes and monetary transfers (-13%) and in-kind transfers and collective expenditures (-8%). However, this long-term analysis masks two very different underlying dynamics. The decline in post-tax income inequality happens during the 1900-1983 period. It is mostly due to the fall in pretax income inequality (89% of the total decline for France, and 77% for the U.S.) and, to a lesser extent, to the rise in redistribution. In contrast, the 1983-2018 period is characterized by a moderate increase in post-tax income inequality in France (+7% in T10/B90). This stability is the result of two opposing forces: rising pretax income inequality (+24% in T10/B90) compensated largely by rising redistribution (-17%). For the same period, the contrast with the U.S. is startling. The overall increase in post-tax inequality (+37%) can be decomposed into an even higher increase in pretax inequality (+51%) only partially reduced by an increase in redistribution (-14%), even if that latter increase is of the same magnitude as the one observed in France. Note that the results are similar when using the indicator T10/B50. As a sensitivity analysis, Appendix Table 2 depicts the same findings using the two other variants of post-tax income (V2 or V3). This is explained by the fact that the contribution of in-kind transfers and collective expenditures to the evolution of post-tax inequality remains small whatever the concept of post-tax income used.
To sum up, these results show that if inequality has decreased much more in France than in the U.S. during the 1900-2018 period, this is not due to a relatively more important increase in redistribution by the French tax and transfer system. The major factor behind the differential trend in post-tax income inequality comes from the differential evolution of pretax income inequality between the two countries.
Over the recent period, the rise in redistribution was similar in both countries. However, it was able to annihilate the slight rise in pretax inequality in France, but not in the U.S. where the increase in pretax income inequality has been much steeper.
Section 3.5 Comparison of pretax and post-tax real income between France and the U.S. 1962-2018
Because pretax and post-tax DINA series are fully consistent with national income, they can be used to consistently compare income levels across countries.
Figure 5 sets the macroeconomic comparison of income levels between France and the U.S. It presents the ratio of French national income per capita relative to the U.S. level from 1962 to 2018. This ratio rose from 60% in the early 1960s to 85% in 1982, then decreased to 70% at the end of the period. To understand this relative income performance, it has been usual to relate it to both productivity catch-up in the first half period, and to a relative decline in hours of work in France relative to the U.S. which
has been well documented.39
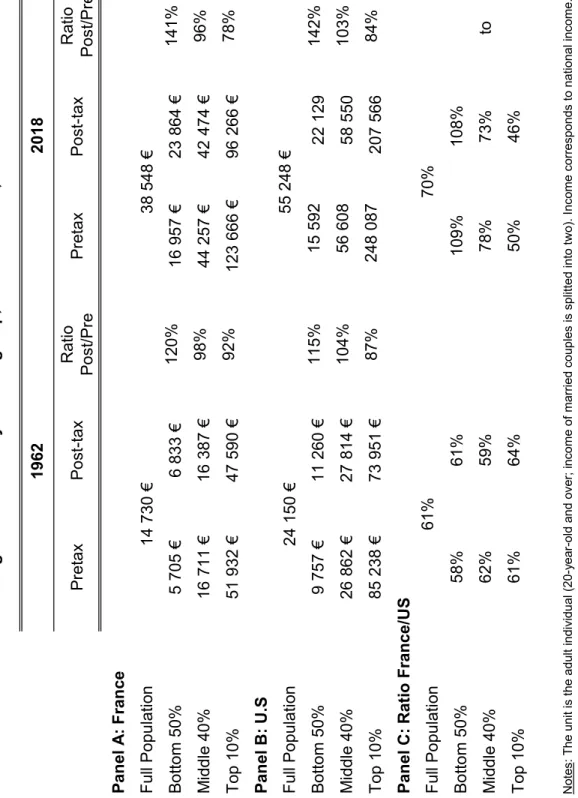
What has not been yet documented is how the average national income trend can be split into distributional analysis. Figure 6 presents such decomposition between B50, M40 and T10 income groups, comparing relative level of pretax and post-tax income (in constant 2018 euros PPP) by income group between France and the U.S. This period is of particular interest as the level of inequality is similar between the two countries in the early 1960s and diverge dramatically since then. Table 3 provides
absolute numbers for 1962 and 2018.40
39See for instance Blundell et al. (2011, 2013) for an in-depth comparison of the UK, the US and
France.
40 The annual evolution of pretax and post-tax income between France and the U.S. over the