Observational evidence for cloud cover enhancement over western European forests
Texte intégral
Figure

Documents relatifs
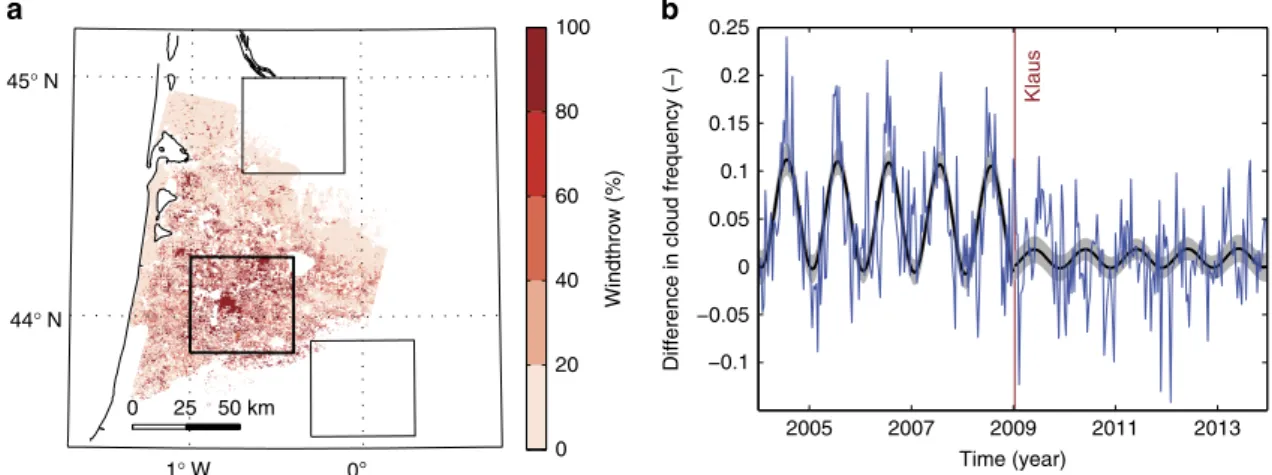
To reduce potential contamination effects from other distur- bances in the resulting total forest cover loss, we removed areas affected by fires the year following a wind
Provenance of detrital zircons in the Late Triassic Sichuan foreland basin: constraints on the evolution of the Qinling Orogen and Longmen Shan thrust-fold belt in central
Nous étudions principalement cette question dans le contexte d’une formation hybride (comme [ Liu et al. , 2016a ]), dans lequel chaque semaine les étudiants doivent poser des
Diamonds, basalts from Chile Ridge segment 1 (CTJ29); squares, basaltic andesites (CTJ28); dots, basaltic andesites from Taitao Ridge (CTJ11); bold crosses [on Figure 8a only],
The importance of precipitation, the way in which cloud deepen, and the nature of the stratiform cloud layers classified as Sugar, Gravel, Fish and Flowers can be evaluated by
Correlation coefficient of surface wind divergence with (a) downwind SST gradient and (b) Laplacian of atmospheric boundary layer temperature, as a function of the
For instance, the 2009–2010 DJF season which was characterized by an anomalously weak V s (Figure 4c) and an anomalously strong stability (Figure 4d) was associated with a
[r]
