HAL Id: hal-01523025
https://hal.inria.fr/hal-01523025v2
Submitted on 8 Oct 2017
HAL is a multi-disciplinary open access
archive for the deposit and dissemination of
sci-entific research documents, whether they are
pub-lished or not. The documents may come from
teaching and research institutions in France or
L’archive ouverte pluridisciplinaire HAL, est
destinée au dépôt et à la diffusion de documents
scientifiques de niveau recherche, publiés ou non,
émanant des établissements d’enseignement et de
recherche français ou étrangers, des laboratoires
ProxiLens: Interactive Exploration of High-Dimensional
Data using Projections
Nicolas Heulot, Michael Aupetit, Jean-Daniel Fekete
To cite this version:
Nicolas Heulot, Michael Aupetit, Jean-Daniel Fekete. ProxiLens: Interactive Exploration of
High-Dimensional Data using Projections. VAMP: EuroVis Workshop on Visual Analytics using
Multi-dimensional Projections, Michael Aupetit; Laurens van der Maaten, Jun 2013, Leipzig, Germany.
�10.2312/PE.VAMP.VAMP2013.011-015�. �hal-01523025v2�
EuroVis 2013 Workshop on Visual Analytics using Multidimensional Projections (2013) M. Aupetit and L. van der Maaten (Editors)
ProxiLens: Interactive Exploration of High-Dimensional Data
using Projections
N. Heulot1and M. Aupetit1and J-D. Fekete2
1CEA, LIST, F-91191, Gif-sur-Yvette Cedex, France.
2INRIA Saclay, Bât 660, Université Paris-Sud, F-91405, Orsay Cedex, France.
Abstract
As dimensionality increases, analysts are faced with difficult problems to make sense of their data. In exploratory data analysis, multidimensional scaling projections can help analyst to discover patterns by identifying outliers and enabling visual clustering. However to exploit these projections, artifacts and interpretation issues must be overcome. We present ProxiLens, a semantic lens which helps exploring data interactively. The analyst becomes aware of the artifacts navigating in a continuous way through the 2D projection in order to cluster and analyze data. We demonstrate the applicability of our technique for visual clustering on synthetic and real data sets. Categories and Subject Descriptors(according to ACM CCS): H.5.2 [Information Interfaces and Presentation]: User Interfaces—
1. Introduction
Data analysts are faced with challenging problems to ana-lyze and interpret high-dimensional (HD) data. Visualization techniques are designed to bridge the gap between hu-man reasoning capabilities and analytical techniques. In ex-ploratory data analysis [Tuk77], projection in a two- or three-dimensional space is often used to visualize HD data as a scatterplot. Based on observations of patterns and prox-imities between points, analysts use projections to detect outliers, find clusters, analyze relationships between data in-stances and reveal information hidden in HD data.
However, the loss of information due to dimensional-ity reduction leads to distortions in the resulting projection [Aup07]. These multidimensional scaling artifacts are chal-lenging in terms of interpretation and trust [CRMH12] for the analysts who want to make inferences on HD data from projection. There are several algorithms [Jol02], [BSL∗08], [PSPM12], [IMO09], [JPC∗11] and optimization criteria available for projecting high-dimensional data in a low-dimensional space. Many metrics and static visualization techniques exist to evaluate the optimization quality (stress) [Kru64], [Ven07], [BW96], [BCLC97], [SSK10], [SvLB10], [LA11] of the resulting projection and its visual quality [TBB∗10], [STMT12] when the class labels are known.
Nevertheless stress information gives only a global infor-mation on how the projection algorithm performed preserv-ing the HD data structure or a local information on where the projection artifacts are mainly located. So stress-based tech-niques do not directly help users to overcome multidimen-sional artifacts in order to make sense out of the projections. We present ProxiLens: a new interactive technique which allows navigating HD data in a continuous way through their 2D projection, i.e. locally clearing projection artifacts, so that analysts can better understand and analyze local HD data structure. A semantic lens helps defining focus area both in 2D and HD spaces, in order to filter the points on the projection depending on their neighborhood in the HD data space.
2. Design goals
The proximity-based visualization [Aup07] interactively al-lows visualizing at each point its original proximity in the HD space relative to a reference data instance p∗sselected by the user on the projection (Fig. 1). It displays the vector of the standardized distances in the HD space to the reference data instance p∗s on the Voronoi cell of each point using a
gray color scale. The reference point is the point with the whitest Voronoi cell. The whiter the cell, the shorter the HD
N. Heulot & M. Aupetit & J-D. Fekete / ProxiLens: Interactive Exploration of High-Dimensional Data using Projections distance to the reference data instance. Interactive selection
of different reference points allows revealing cluster struc-tures in the HD space.
Figure 1: Example of the proximity-based visualization [Aup07] on 10-dimensional synthetic data projected using a classical MDS.
However this proximity-based visualization technique has the following issues:
Interaction: Flickering problems appear when users explores a region of the projection with many false neighborhoods artifacts, as the proximities in the 2D space does not match the proximities in the HD space. Color encoding: Proximities are displayed on the Voronoi cells which have arbitrary sizes depending on the projection
We propose a solution which tackle these problems and helps a continuous and user centric exploration of the HD space.
3. Design model
We consider only projections from HD space to a 2D space, where each data instances p∗i ∈ P∗is mapped to a point p
i=
[xi, yi] ∈ P. We note d∗i, j∈ D∗the Euclidean distances in the
HD space and di, j∈ D the Euclidean distances in the 2D
space.
Figure 2: Model characterizing the different types of points relative to the reference point (in black). Neighbors and tears are represented in green, false neighborhoods in red, and the other points in gray. Artifacts are represented by circles. Neighbors and other points are represented by squares.
To tackle the interaction issue, we define the following model based on a taxonomy of projection artifacts. We con-sider a radius r∗ to define the radial neighborhood of the reference data instance p∗s in the HD space, and a radius r
to define the radial neighborhood of its corresponding ref-erence point ps in the 2D space, composed of a subset of
points P. There are four types of points relative to the refer-ence point (Fig. 2):
Neighbors: Points which are neighbors of the reference point both in the 2D space and the HD space.
Artifacts: Points which are neighbors of the reference point in one space but not in both. Two different mul-tidimensional scaling artifacts have been distinguished [Aup07] [LA11]:
– False neighbors: Dissimilar data instances are
mapped as close-by points on the projection. Pf= {pf∈ P | ds, f∗ ≥ r∗and ds, f ≤ r}
– Tears: Similar data instances are mapped as points far away from each other on the projection.
Pt= {pt∈ P | d∗s,t≤ r∗and ds,t≥ r}
Other: Points which are not neighbors of the reference point in both spaces.
4. ProxiLens
The model described previously matches the principle of fo-cus+context [CMS99], and more precisely it matches the concept of the Magic Lens [BSP∗93] where information is filtered in a 2D focus area depending on its degree of inter-est. MoleView [HET11] uses a Semantic Lens to filter mul-tivariate data (such as images or graphs) along one selected dimension. The focus area enclosed within the lens circle is then cleared of the points to filter during a smooth distortion animation using a vector field.
We propose to adapt the semantic lens model of MoleView to our model (Fig. 3): the focus area is composed of both the neighbors and the tears, and the false neighbors must be filtered from the 2D focus area. Users customize both the 2D radius r, which defines the 2D focus area, and the HD radius r∗, which helps to define the neighborhood of the reference data instance in the HD space.
Interaction
The goal of our interaction design is to pertain a continu-ous exploration of the HD space, i.e. to guide users to se-lect a reference points from neighbors to neighbors in the HD space. We must avoid the selection of false neighbors artifacts as the next reference point because it is what gen-erates flickering colors on the projection due to the sudden change of the location in the HD space. In the same way, we must help users to explore tears by selecting points which
Figure 3: ProxiLens applied to two interlaced rings in 3D that are positioned along two perpendicular plan, and projected in 2D using the Principal Component Analysis (on the left, a-b-c) and the Curvilinear Component Analysis (on the right, d-e-f). ProxiLens allows a continuous navigation in the HD space along the ring under focus despite false neighbordhoods (b-c) or tearing artifacts (e-f). HD distances are displayed using a blue colorscale with a uniform variation of its color intensity (whitest colors map shortest HD distances to the reference point in the center of the lens).
are not neighbors on the projection but are neighbors in the HD space, without loosing continuity of the navigation. So we highlight the neighbors and tears points using a coloring of their HD distances to the reference data instance (Fig. 4). That means that on its way toward a tear point we have to prevent the user from selecting as the next reference point a point which is not a neighbor of the current reference. For this purpose we use two techniques. The first one consist in repelling false neighbors to the lens border using an inter-polation animation, the second consists in setting timers on each hovered points such that points are selected as the next reference if it is still hovered as the timer ends.
These timers are delayed with a timeout T depending on the HD distance between the new reference data instancep∗s1 and the previous one p∗s2: T = T0× d∗s1,s2, with T0 a time
constant that we set to 600 ms. Timers of the false neighbors are arbitrary penalized with a longer duration constant T00. So other points outside of the current focus area can be selected as the next reference point only if the mouse cursor stops on them for a time long enough.
Figure 4: ProxiLens design. An animation moves the false neighbors to the border of the lens and the points of the focus area are magnified using a uniform color encoding of their HD distance to the reference point ps.
Color encoding
The focus area of the lens is defined as a circle with radius rcentered on the reference point in the 2D space, and as a real interval between 0 and a threshold r∗ on the HD dis-tances standardized within [0,1]. We used the Shepard in-terpolation [She68], with a neighborhood factor z = 4. This
interpolation computes the color u(x) of a pixel x using the inverse distance weighting of the color uiof each point i:
u(x) = N
∑
i=0 wi(x)ui ∑Nj=0wj(x) , with wi(x) = 1 ||x − pi||zWe use this color interpolation to encode HD distance of each focus point to the reference data instance in order to let the color of the dots encoding class labels. The radius r∗ is displayed on the color scale and is customizable with the scroll button of the mouse. We use a slider to set the radius r. In order to set the light on the reference point, we increase its size. We also descrease the size of the false neigbors at the width of the border of the lens. The transition of the points coloring, as the size modification, are animated too and syn-chronized with the spatial distortion animation.
5. Example
A ProxiLens implementation was realized in d3.js [BOH11], with webGL shader for the interpolation of the color-ing. We tested the technique on the image dataset Optical Recognition of Handwritten Digits (optdigits) [FA10]. This dataset contains normalized 32x32 bitmaps of handwritten digits [0-9] which are divided into non overlapping blocks of 4x4 and the number of active pixels are counted in each block, resulting in a 8x8 matrix, e. g. a 64 features vector. Each element is an integer in the range 0..16. We used the test set and selected the classes {’0’,’2’,’3’,’5’,’8’} with 50 instances for each class. We project this dataset using a clas-sical MDS algorithm and a Euclidean distance between the images in the pixel space.
We consider a confirmatory analysis scenario, where the indications of the class label are displayed on each point. With the bare projection, we cannot direcly infer if the points isolated from the main cluster of their own class in the 2D space are projection artifacts or missclassified data instance in the HD space. We use ProxiLens to explore the neighbor-hood of these points in the HD space in order to perform class structure and outliers analysis (Fig. 5).
N. Heulot & M. Aupetit & J-D. Fekete / ProxiLens: Interactive Exploration of High-Dimensional Data using Projections
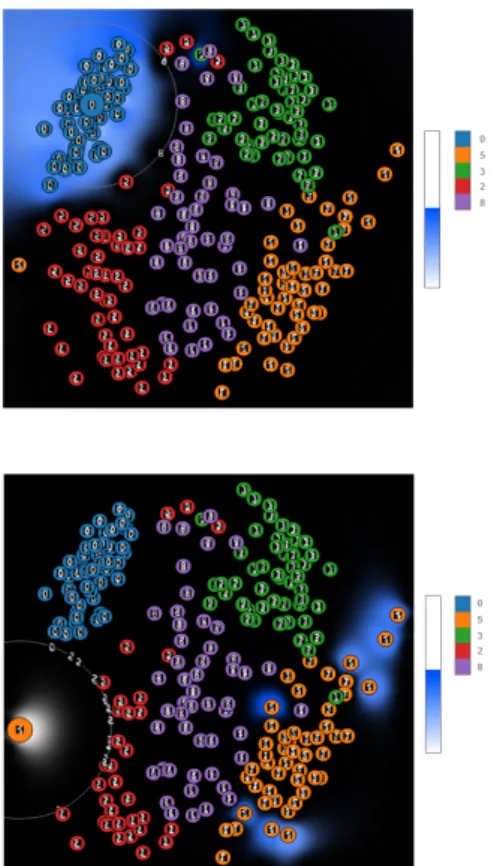
Figure 5: Proxilens helps enables visual analysis of within-class and between-within-class structures (top image) and outlier detection (bottom image).
Class structure analysis: Data instances of class 0 form a dense cluster in the HD space.
Outlier analysis: The reference point of class 5 on the left of the projection is closer to other points of this class in the HD space (points with blue color in the background) than to its neighbors in the 2D space which are from the class 2. This point is not a class-outlier, but it is a tear-ing artifact of the projection. This observation was done increasing gradually the r∗radius from 0 in order to iden-tify the nearest neighbors of the reference point in the HD space. Every class 2 neighbors are then false neighbors, so they are rejected on the border of the lens.
ProxiLens allows verifying that these points are tearing arti-facts and not class outliers. Furthermore, it allows character-izing the relationships between these data instances and the other from other classes. We observe that they are frontier in the cluster of their class and then we better understand why the MDS algorithm has projected them disconnected from the other points of their class.
6. Discussion
Using ProxiLens, we observed that the configuration of the two radii r and r∗introduces minor issues. With a HD radius r∗too small, ProxiLens defines almost all the points inside of the lens as false neighbors, which leads to discontinuities in the navigation. In the same way, with a 2D radius r too large, ProxiLens moves the false neighbors far away from their initial position, which leads to lose the context of the projection.
The choice of the distance measure in the HD space is crucial. ProxiLens allows to visualize and filter the similar-ity values directly on the projection. However, if the distance is not relevant to reveal interesting structures, then proxilens becomes ineffective. If similarity measure is prone to the curse of dimensionnality so is ProxiLens.
The fact that the proximity-based visualization is relative to a reference point is really important to understand the limits of the technique. Indeed, no inference of the proximi-ties is possible relatively to another point than the reference point. Using a gradual increase of the radius r∗ is a good way to observe proximities in the HD space to the reference data instance one after the other. We notice that with r∗= 1, ProxiLens is equivalent to the proximity-based visualization using a interpolation of the colors instead of coloring of the Voronoi cells.
We finally observed that ProxiLens with its local spatial clearing of the false neighbors, and its time delays, enables a true continuous exploration of the HD space despite jection distortions overcoming the limits of the initially pro-posed proximity-based visualization [Aup07].
7. Conclusion
We introduced ProxiLens: a new technique to navigate and explore HD data in a continuous way through their 2D pro-jection. This interactive technique is based on a semantic lens. It highlights the focus points to explore using a col-oring of the proximities in the HD space and it moves the false neighbors to the border of the lens with using an inter-polation animation. It also uses timers to jump to tear points, in order to avoid flickering of the colors due to discontinu-ities in the HD space navigation. It insures that a continuous move on the projection leads to a continuous move along the HD data structures.
In further works, we consider to integrate ProxiLens to a visual exploratory analysis tool based on projection of HD data in order to evaluate its performance on other real case studies. Studies on the automatic setting of the radii param-eters and the selection of more than one focus point needs to be experimented in order to improve the technique. In the same way, we plan to study additional features such as brushing and multiple lenses to ease cluster extraction.
Acknowledgements
The work presented in this paper was supported by a grant from a CEA/DGA collaboration.
References
[Aup07] AUPETIT M.: Visualizing distortions and recovering topology in continuous projection techniques. Neurocomputing 70, 7-9 (2007), 1304–1330.1,2,4
[BCLC97] BRODBECK D., CHALMERS M., LUNZER A.,
COTTUREP.: Domesticating bead: adapting an information vi-sualization system to a financial institution. In Proceedings of the 1997 IEEE Symposium on Information Visualization (InfoVis ’97)(1997).1
[BOH11] BOSTOCKM., OGIEVETSKYV., HEERJ.: D3: Data-driven documents. IEEE Trans. Visualization & Comp. Graphics
(Proc. InfoVis) (2011). URL: http://vis.stanford.
edu/papers/d3.3
[BSL∗08] BUJA A., SWAYNE D. F., LITTMAN M. L., DEAN N., HOFMANN H., CHEN L.: Data visualization with multidimensional scaling. Journal of Computational and Graphical Statistics 17, 2 (2008), 444–472. URL:
http://amstat.tandfonline.com/doi/abs/10. 1198/106186008X318440.1
[BSP∗93] BIERE., STONEM., PIERK., BUXTONW., DEROSE T.: Toolglass and magic lenses: The see-through interface. In ACM SIGGRAPH(1993), pp. 137–145.2
[BW96] BENTLEYC., WARDM.: Animating multidimensional scaling to visualize n-dimensional data sets. In Proceedings IEEE Symposium on Information Visualization(1996), pp. 72–73.1
[CMS99] CARDS. K., MACKINLAYJ. D., SHNEIDERMANB. (Eds.): Readings in information visualization: using vision to think. Morgan Kaufmann Publishers Inc., San Francisco, CA, USA, 1999.2
[CRMH12] CHUANG J., RAMAGE D., MANNING C. D.,
HEER J.: Interpretation and trust: Designing model-driven visualizations for text analysis. In ACM Human Factors in Computing Systems (CHI) (2012), pp. 443– 452. URL: http://vis.stanford.edu/papers/ designing-model-driven-vis.1
[FA10] FRANK A., ASUNCION A.: UCI Machine Learning Repository. Irvine, CA: University of California, School of Information and Computer Sciences, 2010. URL: http:// archive.ics.uci.edu/ml/datasets/.3
[HET11] HURTERC., ERSOYO., TELEAA.: Moleview: An at-tribute and structure-based semantic lens for large element-based plots. In IEEE Transactions on Visualization and Computer Graphics 17(2011), pp. 2600–2609.2
[IMO09] INGRAM S., MUNZNER T., OLANO M.: Glimmer: Multilevel mds on the gpu. Visualization and Computer Graphics, IEEE Transactions on 15, 2 (2009), 249–261.1
[Jol02] JOLLIFFE I.: Principal component analysis. Springer-Verlag(2002).1
[JPC∗11] JOIA P., PAULOVICH F., COIMBRA D., CUMINATO J., NONATO L.: Local affine multidimensional projection. Visualization and Computer Graphics, IEEE Transactions on 17, 12 (2011), 2563–2571.1
[Kru64] KRUSKALJ.: Multidimensional sclaing by optimizing goodness of fit to a nonmetric hypothesis. Psychometrika 29 (1964), 1–27.1
[LA11] LESPINATSS., AUPETITM.: CheckViz: Sanity Check and Topological Clues for Linear and Non-Linear Mappings. Computer Graphics Forum 30, 1 (2011), 113–125.1
[PSPM12] PAIVA J., SCHWARTZW., PEDRINI H., MINGHIM R.: Semi-supervised dimensionality reduction based on par-tial least squares for visual analysis of high dimensional data. Computer Graphics Forum 31(2012), 1345–1354.1
[She68] SHEPARDD.: A two-dimensional interpolation function for irregularly-spaced data. In Proceedings of the 1968 23rd ACM national conference(1968), ACM ’68, pp. 517–524.3
[SSK10] SEIFERTC., SABOLAND V., KIENREICHW.: Stress Maps: Analysing Local Phenomena in Dimensionality Reduction Based Visualisations. In Proceedings of the 1st European Symposium on Visual Analytics Science and Technology (EuroVAST’10), Bordeaux, France(2010).1
[STMT12] SEDLMAIRM., TATUA., MUNZNERT., TORYM.: A taxonomy of visual cluster separation factors. Comp. Graph. Forum 31(2012), 1335–1344.1
[SvLB10] SCHRECKT.,VONLANDESBERGERT., BREMMS.: Techniques for precision-based visual analysis of projected data. Information Visualization 9, 3 (2010), 181–193.1
[TBB∗10] TATU A., BAK P., BERTINI E., KEIM D., SCHNEIDEWIND J.: Visual quality metrics and human perception: an initial study on 2d projections of large multidi-mensional data. In Proceedings of the International Conference on Advanced Visual Interfaces(2010), AVI ’10, pp. 49–56.1
[Tuk77] TUKEY J. W.: Exploratory Data Analysis. Addison-Wesley, 1977.1
[Ven07] VENNAJ.: Dimensionality reduction for visual explo-ration of similarity structures. Helsinki University of Technology, Dissertations in Computer and Information Science Report D20 (2007).1
![Figure 1: Example of the proximity-based visualization [Aup07] on 10-dimensional synthetic data projected using a classical MDS.](https://thumb-eu.123doks.com/thumbv2/123doknet/13050171.383009/3.892.115.422.190.340/figure-example-proximity-visualization-dimensional-synthetic-projected-classical.webp)