Drought risk analysis applied to porous Swiss aquifers
Francesco Kimmeier1, Mahmoud Bouzelboudjen1,
Laurent Eisenlohr2, Yvan Rossier3 1
CHYN - Centre d'Hydrogéologie, Université de Neuchâtel, Emile-Argand 11, 2007 Neuchâtel, Suisse 2
CETE Environnement, 25 avenue François Mitterrand, Case n°1 F-69674 BRON Cedex France 3
ATE, 17 rue du Perigord, 69330 Meyzieu, France.
ABSTRACT
The impact of hydrogeological drought on groundwater has been studied in the context of natural flow systems. The aim of this article is to find the relative resistance of 18 unconfined aquifer systems in porous media to a prolonged shortfall in recharge. A synthetic relative drought resistance indicator has been calculated for each of the aquifer systems based on 4 variables which are the half-recession time, the specific regulatory capacity, the drainage density and the aquifer system area.
The analysis shows that 33% of the chosen aquifer systems are weakly resistant. By contrast, 22% have a high drought resistance. The other aquifer systems are of moderate resistance (22%) or of good resistance (22%).
Keywords : Hydrogeologic resistance, alluvial aquifer, porous medium, stage hydrograph, recession, Switzerland.
1. INTRODUCTION
No region in Europe is safe from hydrogeological drought, or less so, from a prolonged precipitation shortage [Grillot & Razack 1983, Margat 1989, Gennai and al. 1993, Marsh and al. 1994]. The droughts in Europe are specifically of random character, non-seasonal and often localized by the division of the landscape. According to the season in which a drought occurs, the latter will have variable aspects and wide ranging socio-economic consequences [Zilliox 1992].
One can consider there to be a drought when there is a significant shortage in water supply, over a sufficiently long period (seasonal, annual, or pluriannual) in comparison to the averages (of at least 10 years) and over a sufficiently large area.
The impact of extreme climatic variations, droughts and floods, on the regime and chemical quality of groundwaters can be important [Bouzelboudjen, Kimmeier and al. 1997, Bultot and al. 1988, Cooper and al. 1995, Eagleson 1996].
For a decade, global scale studies have shown an increase in the concentration of carbon dioxide and rare gases [Clark 1982]. One of the consequences of these increases is a climate change which is shown by an increase in temperatures [Berger
1981, Marsh and al. 1994], by a change in precipitation patterns [Washington and Mehl 1983] and finally by changes in parameters linked to sunshine [Chou and al. 1982].
Only recently have studies tried to show the impact of these climatic changes on natural resources at a local or a regional scale [Gleick 1989]. Most of these studies do not mention the effects on groundwater, with only a small number dealing with the impact of climatic modifications at a large scale on water resources [Zekster and Loaiciga 1993]. We should nevertheless mention the local study of Wilkinson and Cooper from 1993, which gives indications on the impact of climatic changes on a few aquifers in England.
This contribution aims to study the reaction of unconfined aquifer systems faced with a prolonged shortfall in recharge. We have developed a synthetic relative hydrogelogic drought resistance indicator to do this for 18 porous aquifer systems in Switzerland.
2. MATERIALS AND METHODS
2.1 Material
We have used 25 piezometers spread all over Switzerland with daily records over 10 to 15 years (Fig. 1 and 2). We have also chosen 20 rain gages in the neighborhood of the piezometers to be able to identify the drought periods.
Figure 1: Location of the 25 piezometers used for the drought resistance study of the 18 aquifer systems in porous media.
We have chosen piezometers from the Swiss National Network (SHGN : Service Hydrologique et Géologique National) as much as possible [Buttet and Eberhard, 1995], which show the regional conditions of the aquifer system as well as possible. The piezometers too near to fixed level limits have been discarded.
P ie z o m e te r S H G N
n a m e #
R hein - F els berg A , B , C , D 4 R hein - M aienfeld A , B , C , D 7
A rve - S oral 10
D is c hm abac h - D avos 11 V edeggio - B ioggio A , B , C 12
V edeggio - Lam one 15
R hein - S alez A , B , C , D 20
E rgolz - P rat teln 23
B irs - M ünc hens tein 24
A are - O berw ic htrac h 25 R eus s - S tadelm at t A , B , C , D 28 Inn - S am edan A , B , C 31 B ipperam t - N iederbipp 33 D ünnerngäu - K es tenholz 34 E m m e - O bergerlafingen 35
K lettgau - W ilc hingen 36
R hein - S engerhalde 37
R eus s - Täs c hlerhüs li 38 K leine E m m e - S c hac hen 39
W igger - W ink el 40
A abac h - C hilc hfeld 41
R hône - V étroz A , B , C , D 43
R hône - C rêtelongue 99
Figure 2: Daily stage hydrographs for the 25 selected piezometers in porous media (see locations in figure 1).
Figure 2 shows the principal characteristics of the form of the stage hydrographs used and the difference in resistance of these systems to drought.
- 5 - 20 - 18 4 - Rhin - Felsberg D 7 - Rhin - Maienfeld B - 7 - 77 - 78 10 - Arve - Soral 11 - Dischmabach - Davos - 0.4 - 1.2 - 1.5 - 2.5 12 - Vedeggio - Bioggio A - 3 - 4 15 - Vedeggio - Lamone 0 - 0.8 20 - Rhein - Salez B - 18 - 19 23 - Ergolz - Pratteln - 4.3 - 6.3 24 - Birs - Münchenstein 25 - Aare - Oberwichtrach - 2 - 1 - 2 - 1 28 - Reuss - Stadelmatt C - 4.5 - 2.5 31 - Inn - Samedan B 33 - Bipperamt - Niederbipp - 35.5 - 33.5 34 - Dünnerngäu - Kestenholz - 20 - 18 - 5.8 - 6.3 - 34 - 36 35 - Emme - Obergerlafingen 36 - Klettgau - Wilchingen - 42.9 - 43.2 - 1.4 - 1.9 37 - Rhein - Sengerhalde 38 - Reuss - Täschlerhüsli - 1.4 - 1.8 - 4.8 - 5.7
39 - Kleine Emme - Schachen
40 - Wigger - Winkel - 18.3 - 17.3 - 3.4 - 3.1 41 - Aabach - Chilchfeld 43 - Rhône - Vétroz B 46 - Rhône - Grône A - 1.0 - 1.5 47 - Rhône - Grône B - 0.85 - 1.15 - 1.0 - 1.5 99 - Rhône - Crêtelongue D e pt h [ m ] 1985 1986 1987 1988 1989 1990 1991 1992 1993 1994
From 1989 to 1993, (piezometer 36) and from 1989 to 1992 (piezometer 37) we detect between 4 and 5 successive years with a falling trend of the water table of Wilchingen and Sengerhalde. Similar characteristics are seen for piezometer 33 (Bipperamt) and piezometer 34 (Dünnerngaü) set in the Gaü groundwater body.
A second noticeable fact is the high incidence due to the deficit year of 1988-89. Nearly half the piezometers show a strong fall in level. The incidence of the shortage year 1992 on groundwater is generally less significant.
The incidence of the surplus year of 1987 on groundwater is marked in 3 piezometers (4, 7 and 37). These piezometers show significant recharge. Otherwise, 11 of the 18 aquifers show no effect whilst in 3, the incidence is retarded.
Aquifer systems with an annual regime without any noticeable pluri-annual trend are found at piezometers 4, 7 and 31.
For the aquifers linked to the Rhine (piezometers 4 and 7) and to the Rhône (piezometers 43, 46, 47, and 99) the levels stay generally stable over the whole recorded period.
A special regime is seen for the groundwater aquifers whose levels are shallow, linked to the fact that the imposed capacity limits are very close (piezometers 11, 12, 28, 38 and 39). Figure 3 shows that more than half of the piezometers indicate an unconfined aquifer level of less than 5 meters depth. Moreover, figure 3 shows the pluriannual cycle (extreme minimum and maximum values) of the aquifer systems.
Figure 3: Depth and movements of the free groundwater surface of the 18 Swiss aquifers.
2.2 Method
To calculate the synthetic relative drought resistance indicator (SRDRI) of aquifer systems during a prolonged recharge shortage, we need piezometric records, on average over 10 to 15 years.
The SRDRI [Gennai 1992, Gennai and al. 1993, Fig. 4) which defines the relative resistance of aquifer systems to drought is determined by the following equation:
Figure 4: Illustration of the 4 variables for the study of the relative drought resistance of the aquifer systems: examples of application in Northern France [Gennai, Margat and Collin, 1993]
The 4 variables in the formula are defined as follows:
T/2 = the half recession time (in months) and is found by hydrogram analysis [Birtles 1978]. The method of calculation was developed in part by Degallier 1975 and by Margat and Forkasiewicz in 1978.
SRC = the specific regulatory capacity (in %) corresponds to the ratio of the historical reserve to the total average reserve (Fig. 4).
DD = the drainage density (in km-1) represents the length of the surface hydrographic network (L) divided by the area of the aquifer system (L-1/L2)=(L-1).
A = the area of the aquifer system (L2) expressed in km2.
The half-recession time, which depends uniquely on the structural conditions of the aquifer system, is the most representative variable for determining the capacity of aquifer systems to resist drought [Margat and Forkasiewicz 1978, Degallier 1975, 1976, Pointet 1975]. T/2 T = 3 months T/2 T= 19 months Impervious substratum SRC = 16% Impervious substratum SRC = 74% DD = 0.017 km-1 A = 1'150 km2 Non saturated zone Historical reserve Average total reserve DD = 0.096 km-1 A = 1'000 km2
The specific regulatory capacity is well representative of the groundwater body dynamics, in other words the regulatory potential of the aquifer. This is the most difficult variable to evaluate as a function of the available database.
The area and the drainage density of the aquifer system are variables of less importance, but which nevertheless allow one to separate aquifer systems whose SRDRI values would be too close if one only considered half recession times and specific regulatory capacity.
Calculation of SRDRI for each aquifer system relies on finding the magnitude of the 4 previously mentioned hydrogeologic variables.
The values found for each variable have to be divided into homogeneous groups of number and intensity of observed phenomena, which allows the characterization of hydrogeological drought. 4 classes have been chosen to show increasing drought resistance (weak, moderate, good, and high). The weighting factors (see equation 1) used for the SRDRI calculation of each variable are given arbitrarily, and according to the previous considerations as follows:
Variables Weighting factor
Half recession time (T/2) 5
Specific regulatory capacity (SRC) 2
Drainage density (DD) 1
Area (A) 1
Table 1: Weighting factors of the 4 variables.
3. APPLICATION OF THE METHOD IN SWITZERLAND
3.1 Half recession time (T/2)
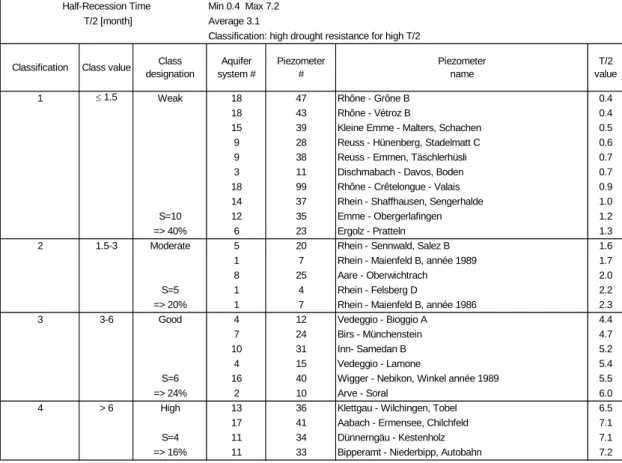
In table 2 we have divided results into 4 classes. For a high recession value, there is a corresponding high drought resistance (class 4 with a half recession time greater
than 6 months). The piezometric records used show that 40% of the aquifer systems are weakly resistant to drought and 20% have moderate resistance. 24% of aquifers show good resistance whilst 16% show high resistance (Fig. 5).
Figure 5: The relative
drought resistance of the 18 Swiss aquifer systems using only the half recession time (months).
Half-Recession Time Min 0.4 Max 7.2
T/2 [month] Average 3.1
Classification: high drought resistance for high T/2
Classification Class value Class
designation Aquifer system # Piezometer # Piezometer name T/2 value
1 1.5 Weak 18 47 Rhône - Grône B 0.4
18 43 Rhône - Vétroz B 0.4
15 39 Kleine Emme - Malters, Schachen 0.5
9 28 Reuss - Hünenberg, Stadelmatt C 0.6
9 38 Reuss - Emmen, Täschlerhüsli 0.7
3 11 Dischmabach - Davos, Boden 0.7
18 99 Rhône - Crêtelongue - Valais 0.9
14 37 Rhein - Shaffhausen, Sengerhalde 1.0
S=10 12 35 Emme - Obergerlafingen 1.2
=> 40% 6 23 Ergolz - Pratteln 1.3
2 1.5-3 Moderate 5 20 Rhein - Sennwald, Salez B 1.6
1 7 Rhein - Maienfeld B, année 1989 1.7
8 25 Aare - Oberwichtrach 2.0
S=5 1 4 Rhein - Felsberg D 2.2
=> 20% 1 7 Rhein - Maienfeld B, année 1986 2.3
3 3-6 Good 4 12 Vedeggio - Bioggio A 4.4
7 24 Birs - Münchenstein 4.7
10 31 Inn- Samedan B 5.2
4 15 Vedeggio - Lamone 5.4
S=6 16 40 Wigger - Nebikon, Winkel année 1989 5.5
=> 24% 2 10 Arve - Soral 6.0
4 > 6 High 13 36 Klettgau - Wilchingen, Tobel 6.5
17 41 Aabach - Ermensee, Chilchfeld 7.1
S=4 11 34 Dünnerngäu - Kestenholz 7.1
=> 16% 11 33 Bipperamt - Niederbipp, Autobahn 7.2
Table 2: Classification of the 18 Swiss aquifer systems according to half-recession times (HRT in months).
3.2 Specific Regulatory Capacity (SRC)
In table 3, we see that the drought resistance is higher as the regulatory capacity is lower. The values are distributed into 4 classes expressed as percentages. 22% fall into the high resistance category, 39% into good resistance and 17% and 22% respectively in the moderate and weak resistance categories.
Specif ic Regulat ory Capacit y Min 1 .3 % Max 8 6 % SRC [ %] Average 1 7 .1 %
Classif icat ion : high drought resist ance f or weak SRC Classif icat ion Class
value Class designat ion Aquf er syst em # Piezomet er # Piezomet er name
4 High 1 6 4 0 Wigger - Nebikon, Winkel année 1 9 8 9 2 .4
1 4 Rhein - Felsberg D 2 .7
1 8 9 9 Rhône - Crêt elongue - Valais 3 .0
=> 2 2 % 5 2 0 Rhein - Sennwald, Salez B 3 .6
3 4 -1 2 Good 1 2 3 5 Emme - Obergerlaf ingen 4 .1
1 4 3 7 Rhein - Shaf f hausen, Sengerhalde 4 .2
1 0 3 1 Inn- Samedan B 4 .2
1 5 3 9 Kleine Emme - Malt ers, Schachen 5 .8
3 1 1 Dischmabach - Davos, Boden 8 .7
2 1 0 Arve - Soral 9 .9
=> 3 9 % 1 1 3 4 Dünnerngäu - Kest enholz 1 0 .0
2 1 2 -2 0 Moderat e 1 3 3 6 Klet t gau - Wilchingen, Tobel 1 3 .7
8 2 5 Aare - Oberwicht rach 1 5 .2
=> 1 7 % 1 7 4 1 Aabach - Ermensee, Chilchf eld 1 7 .5
1 > 2 0 Weak 9 2 8 Reuss - Hünenberg, St adelmat t C 2 2 .4
4 1 2 Vedeggio - Bioggio A 2 4 .6
6 2 3 Ergolz - Prat t eln 5 3 .7
=> 2 2 % 7 2 4 Birs - Münchenst ein 8 5 .5
SRC value
Table 3: Classification of the 18 Swiss aquifer systems according to their specific regulatory capacity (SRC in %).
3.3 Drainage Density (DD)
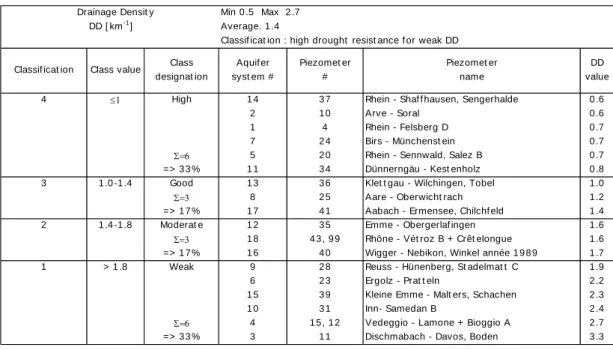
The drought resistance is high for a low drainage density. The aquifer systems studied (table 4) show 33% of cases with a high resistance against 17% with good resistance, 17% moderate resistance and 33% low resistance.
Drainage Densit y Min 0 .5 Max 2 .7 DD [ km-1] Average. 1 .4
Classif icat ion : high drought resist ance f or weak DD Classif icat ion Class value Class
designat ion Aquif er syst em # Piezomet er # Piezomet er name DD value
4 High 1 4 3 7 Rhein - Shaf f hausen, Sengerhalde 0 .6
2 1 0 Arve - Soral 0 .6
1 4 Rhein - Felsberg D 0 .7
7 2 4 Birs - Münchenst ein 0 .7
5 2 0 Rhein - Sennwald, Salez B 0 .7
=> 3 3 % 1 1 3 4 Dünnerngäu - Kest enholz 0 .8
3 1 .0 -1 .4 Good 1 3 3 6 Klet t gau - Wilchingen, Tobel 1 .0
8 2 5 Aare - Oberwicht rach 1 .2
=> 1 7 % 1 7 4 1 Aabach - Ermensee, Chilchf eld 1 .4
2 1 .4 -1 .8 Moderat e 1 2 3 5 Emme - Obergerlaf ingen 1 .6
1 8 4 3 , 9 9 Rhône - Vét roz B + Crêt elongue 1 .6 => 1 7 % 1 6 4 0 Wigger - Nebikon, Winkel année 1 9 8 9 1 .7
1 > 1 .8 Weak 9 2 8 Reuss - Hünenberg, St adelmat t C 1 .9
6 2 3 Ergolz - Prat t eln 2 .2
1 5 3 9 Kleine Emme - Malt ers, Schachen 2 .3
1 0 3 1 Inn- Samedan B 2 .4
4 1 5 , 1 2 Vedeggio - Lamone + Bioggio A 2 .7
=> 3 3 % 3 1 1 Dischmabach - Davos, Boden 3 .3
Table 4: Classification of the 18 Swiss aquifer systems according to their drainage density (DD in km).
3.4 Aquifer system area (A)
The aquifer system area was determined using 1:100,000 scale hydrogeological maps. In table 5 we have divided the results into 4 classes of increasing drought resistance. This classification gives 22% weakly resistant, 33% moderate resistance, 22% good resistance and 22% high resistance.
Aquif er syst em area Min 4 .0 Max 7 8 8 .5 A [ km2] Average 1 0 8 .4
Classif icat ion : high drought resist ance f or high A Classif icat ion Class value Class
designat ion Aquif er syst em # Piezomet er # Piezomet er name A value
1 Weak 3 1 1 Dischmabach - Davos, Boden 4 .0
4 1 2 Vedeggio - Bioggio A 8 .6
1 7 4 1 Aabach - Ermensee, Chilchf eld 8 .6
=> 2 2 % 7 2 4 Birs - Münchenst ein 1 8 .9
2 2 0 -5 0 Moderat e 1 5 3 9 Kleine Emme - Malt ers, Schachen 2 2 .3
6 2 3 Ergolz - Prat t eln 2 3 .8
1 0 3 1 Inn- Samedan B 2 4 .6
2 1 0 Arve - Soral 3 0 .0
1 4 3 7 Rhein - Shaf f hausen, Sengerhalde 3 6 .7
=> 3 3 % 1 1 3 4 Dünnerngäu - Kest enholz 4 6 .9
3 5 0 -8 0 Good 1 3 3 6 Klet t gau - Wilchingen, Tobel 5 7 .3
1 6 4 0 Wigger - Nebikon, Winkel année 1 9 8 9 6 0 .4
9 2 8 Reuss - Hünenberg, St adelmat t C 6 1 .1
=> 2 2 % 8 2 5 Aare - Oberwicht rach 6 4 .0
4 > 8 0 High 1 8 9 9 Rhône - Crêt elongue - Valais 1 1 3 .4
1 4 Rhein - Felsberg D 1 4 4 .3
1 2 3 5 Emme - Obergerlaf ingen 2 0 2 .4
=> 2 2 % 5 2 0 Rhein - Sennwald, Salez B 7 8 8 .5
3.5 Drought resistance of 18 porous aquifer systems in Switzerland
The analysis shows (table 6) that 33% of the selected aquifers are weakly resistant. In contrast, 22% of the aquifer systems have a high drought resistance. The other aquifer systems are of moderate resistance (22%) or resistant (22%).
SRDRI classificat ion SRDRI class Aquifer syst em # Piezomet er # Piezomet er name SRDRI value
Weak SRDRI 18 6 23 Ergolz - Prat t eln 10
9 28 Reuss - Hünenberg, St adelmat t C 11
3 11 Dischmabach - Davos, Boden 13
15 39 Kleine Emme - Malt ers, Schachen 14
12 35 Emme - Obergerlafingen 17
=> 33% 14 37 Rhein - Shaffhausen, Sengerhalde 17
Moderat e 18 < ISR 4 15, 12 Vedeggio - Lamone, Bioggio A 19
43, 46 47, 99
8 25 Aare - Oberwicht rach 20
=> 22% 7 24 Birs - Münchenst ein 22
Good 23 < ISR 10 31 Inn- Samedan B 24
1 4 Rhein - Felsberg D 26
5 20 Rhein - Sennwald, Salez B 26
=> 22% 2 10 Arve - Soral 27
High SRDRI 28 16 40 Wigger - Nebikon, Winkel année 1989 28
17 41 Aabach - Ermensee, Chilchfeld 28
13 36 Klet t gau - Wilchingen, Tobel 30
=> 22% 11 33, 34 Bipperamt + Dünnerngaü 32
18 Rhône - Vét roz B + Crêt elongue 19
Table 6: Synthetic relative drought resistance indicator (SRDRI) of the 18 Swiss aquifers.
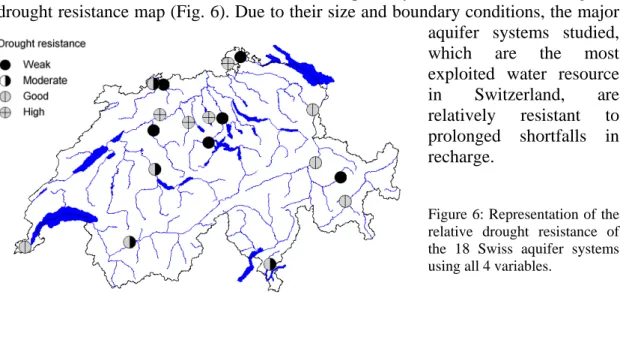
The SRDRI calculation for each unconfined aquifer system allows the drawing of a drought resistance map (Fig. 6). Due to their size and boundary conditions, the major aquifer systems studied, which are the most exploited water resource in Switzerland, are relatively resistant to prolonged shortfalls in recharge.
Figure 6: Representation of the relative drought resistance of the 18 Swiss aquifer systems using all 4 variables.
4. DISCUSSIONS AND CONCLUSIONS
Due to their extent and boundary conditions, the major aquifers studied representing the most exploited water resource, are relatively resistant to climatic variations if we compare them to European aquifers.
Although the Swiss aquifer systems chosen are relatively resistant to climatic variations, it was interesting to classify them as a function of their relative resistance to prolonged recharge shortfalls.
The method of mapping of unconfined aquifer system resistance to drought was carried out in the light of all the piezometric data of the federal network. However, we have discarded piezometers too close to fixed potential limits (rivers, lakes) and/or of zero flux (nearness of watertight limits). The determination of the half recession time and of the specific regulatory capacity requires a study on the representativeness of the piezometers of the national network. In effect, these two variables are the most important in the determination of the synthetic drought resistance indicator.
Acknowledgments: This study was funded by the Swiss National Foundation for Scientific Research
in the framework of National Research Programme NRP 31. Climate changes and natural disasters (research project N° 4031-33148).
5. REFERENCES
Berger A., 1981. Climatic variations and variability: Facts and Theories. Nato advanced Study Institutes Series. Serie C: Mathematical and Physical Sciences. Reidel, Dordrecht, 795 p.
Bouzelboudjen M., Kimmeier F., Rossier Y., Eisenlohr L., Király L., Zwahlen F., 1997. Impact des changements climatiques sur le comportement des systèmes aquifères. PNR 31 - Programme National de Recherche du Fonds National de la Recherche Scientifique (FNRS) Suisse. Changements climatiques et catastrophes naturelles. 116p, 46 fig., 24 tab., vdf, Hochschul Verlag AG, ETH Zürich.
Birtles A.-B., 1978. Identification and separation of Major Base Flow Components From a Stream Hydrograph. Water Ress. Research, 14, n° 5, 791-803.
Bultot F., Coppens A., Dupriez G.-L., Gellens D., Meulenberghs F., 1988. Repercussions of a CO2 doubling on the water cycle and on the water balance. A case study for Belgium. J. Hydrol. 99: 319-347.
Buttet P., Eberhard A., 1995. Das Eidgenössische Grundwasser Beobachtungsnetz. Hydrologische Mitteilungen N° 22, 162s. Landeshydrologie und -geologie. Bern. Chou M.-D., Peng L., Arking A., 1982. Climate Studies with a Multilayer Energy
Balance Model. Part II: The Role of Feedback Mechanisms in the CO2 Problem. J. Atmos. Sci. 39: 2657-2666.
Clark W.-C., 1982. Carbon Dioxide Review. Oxford University Press, New York, NY. Cooper D.-M., Wilkinson W.-B., Arnell M.W., 1995. The effects of climate changes on aquifer storage and river baseflow. Hydrological Sciences - J. Sc. Hydrol., 40,5, 615-631.
Degallier R., 1975. Interprétation des variations naturelles du niveau des nappes souterraines. Thèse Université de Montpellier et Rapport Inédit BRGM 75 SGN 383 AME.
Degallier R., 1976. Interprétation des variations naturelles du niveau des nappes. Bulletin BRGM Fr. (2), III, n° 2.
Eagleson P.-S., 1986. The emergence of global scale hydrology. Water Resources Research, 22: 6-14.
Gennai A., 1992. Elaboration d'une carte de résistance à la sécheresse des systèmes aquifères libres: Application au Nord de la France. Mémoire Dipl. 3ème cycle Centre d'hydrogéologie, Université de Neuchâtel, 117 p, 36 fig., 16 tabl., 3 ann. Gennai A., Margat J., Collin J.-J., 1993. Cartographie de la résistance à la sécheresse
des systèmes aquifères à nappe libre. Rapport inédit BRGM, Orléans, 13 fig., 5 tabl., 5 ann.
Gleick P.-H., 1989. Climate change, hydrology and water resources. Rev. Geophys., 27: 329-344.
Grillot J.-C., Razack M., 1983. Evolution spatio-temporelle d’un système aquifère alluvial sous l’effet d’une sécheresse pluriannuelle exceptionelle, littoral méditeranéen, Hérault, France. J. Hydrol. 82 (1-2), 155-173.
Margat J., Forkasiewicz J., 1978: Analyse des fluctuations naturelles de niveau de nappes libres en France. Essai de prédiction déterministe de niveaux d'étiage en 1976. Bulletin du BRGM (deuxième série). Section III, n° 3, 247-258.
Margat J., 1989. La sécheresse et eaux souterraines. La Houille Blanche 7/8.
Marsh T.-J., Monkhouse R.A., Arnell N.W., Lees M.L. & Reynard N.S. 1994. The 1988-92 Drought. Institute of Hydrology, British Geological Survey, 78 p.
Pointet T., 1975. Essai de caractérisation du coefficient de tarissement des nappes. Thèse de Doct-Ing. Université de Nancy I, 115 p, 9 ann., 63 fig.
Washington W. M., Mehl G. A., 1983. General circulation model experiments on the climatic effects due to a doubling and quadrupling of carbon dioxide concentration. J. Geophys. Res. 88 (611): 6600-6610.
Wilkinson W.-B., Cooper D.-M., 1993. The response of idealized aquifer/river systems to climate change. Hydrological Sciences - J. Sc. Hydrol., 38,5, 379-390. Zektser I.-S., Loaiciga H. A., 1993. Groundwater fluxes in the global hydrologic
cycle: past, present and future. J. Hydrol., 144, 405-427.
Zilliox L., 1992. Les ressources en eau du fossé rhénan: des études aux actions de sensibilisation. Hydrogéologie (Orléans), n° 4, 175-179, 2 fig.
Corresponding author : Francesco Kimmeier, Institut de Géologie, Centre d'Hydrogéologie, Université de Neuchâtel, 11 rue Emile-Argand, 2007 Neuchâtel. Tél : +4132/718.26.30- Fax : +4132/718.26.03


![Figure 4: Illustration of the 4 variables for the study of the relative drought resistance of the aquifer systems: examples of application in Northern France [Gennai, Margat and Collin, 1993]](https://thumb-eu.123doks.com/thumbv2/123doknet/15024520.684690/5.892.152.739.108.769/figure-illustration-variables-relative-resistance-examples-application-northern.webp)