HAL Id: tel-03230093
https://tel.archives-ouvertes.fr/tel-03230093
Submitted on 19 May 2021
HAL is a multi-disciplinary open access archive for the deposit and dissemination of sci-entific research documents, whether they are pub-lished or not. The documents may come from teaching and research institutions in France or abroad, or from public or private research centers.
L’archive ouverte pluridisciplinaire HAL, est destinée au dépôt et à la diffusion de documents scientifiques de niveau recherche, publiés ou non, émanant des établissements d’enseignement et de recherche français ou étrangers, des laboratoires publics ou privés.
Study of minor species in the Venus night mesosphere
Daria Evdokimova
To cite this version:
Daria Evdokimova. Study of minor species in the Venus night mesosphere. Earth and Planetary Astrophysics [astro-ph.EP]. Université Paris-Saclay; Space Research Institute of the Russian Academy of Sciences (IKI), 2021. English. �NNT : 2021UPASP039�. �tel-03230093�
Study of minor species in the Venus night
mesosphere
Étude des espèces mineures dans la mésosphère
nocturne de Vénus
Thèse de doctorat de l’université Paris-Saclay et Space
Research Institute IKI of Russian Academy of Sciences
École doctorale n° 127 : astronomie et astrophysique d’Ile-de-France (AAIF) Spécialité de doctorat: Astronomie et Astrophysique Unité de recherche : Université Paris-Saclay, UVSQ, CNRS, LATMOS, 78280, Guyancourt, France Référent : Université de Versailles Saint-Quentin-en-Yvelines
Thèse présentée et soutenue à Paris-Saclay,
le 22 janvier 2021, par
Daria EVDOKIMOVA
Composition du Jury
Nathalie CARRASCOProfesseur à l’Université Paris-Saclay Présidente Sébastien LEBONNOIS
Directeur de recherche CNRS à Sorbonne Université Rapporteur & Examinateur Dmitrij TITOV
European Space Agency (Pays-Bas) Rapporteur & Examinateur Alexander RODIN
Directeur de laboratoire au Moscow Institute of Physics and Technology (Russie)
Examinateur
Nicholas SCHNEIDER
Professeur à l’Université du Colorado (Etats-Unis) Examinateur
Direction de la thèse
Franck MONTMESSIN
Directeur de Recherche CNRS à l’Université Paris-Saclay Directeur de thèse Denis BELYAEV
Chercheur au Space Research Institute (Russie) Co-Directeur de thèse
Thèse de
doctorat
NNT : 20 21 U PA SP 03 92
СONTENTS
СONTENTS ... 2
ACKNOWLEDGMENTS ... 5
PURPOSE OF THE WORK ... 7
CHAPTER 1. Venus and its atmosphere ... 9
1.1. The Earth’s evil twin ... 10
1.2. A new view of Venus ... 11
1.3. History of observations ... 12
1.3.1. Venus space missions ... 12
1.3.2. Venus Express ... 17
1.3.3. Future missions ... 18
1.4. The surface of Venus ... 19
1.5. The atmosphere of Venus ... 20
1.5.1. Composition ... 20
1.5.2. Structure of the atmosphere ... 21
1.5.3. The cloud layer ... 23
1.5.4. Transparency windows ... 25
1.5.5. Mesosphere and atmospheric dynamics ... 27
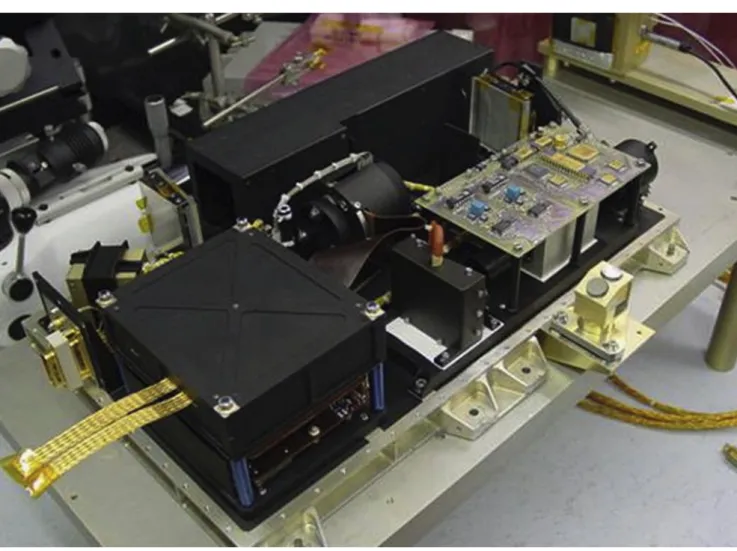
1.6. The SPICAV instrument ... 30
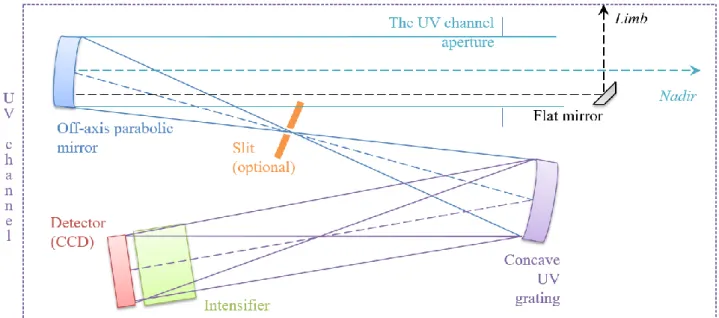
1.6.1. Ultraviolet channel of the SPICAV spectrometer ... 31
1.6.2. Infrared channel of the SPICAV spectrometer ... 34
CHAPTER 2. Sulphur dioxide and ozone in the atmosphere of Venus ... 36
2.1. Overview of sulphur dioxide research ... 36
2.1.1. Temporal and spatial distributions of sulphur dioxide ... 36
2.1.2. Vertical profile of SO2 obtained by SPICAV/SOIR instrument on board Venus Express and ground based facilities in the mesosphere ... 38
2.2. Ozone in the atmosphere of Venus. ... 40
2.2.1. Discovery of ozone in the atmosphere ... 41
2.2.2. Ozone at the top of the clouds ... 41
2.3. Photochemistry: a review of atmospheric models for SO2 and O3 ... 42
CHAPTER 3. Data processing of stellar occultation spectra ... 49
3.1. The stellar occultation technique: retrieving the atmospheric composition from transmittance spectra .... 49
3.2. Calibrations and stray light correction in the raw data. ... 51
3.2.1. Studied trace gases ... 51
3.2.2. UV Signal considerations with SPICAV ... 53
3
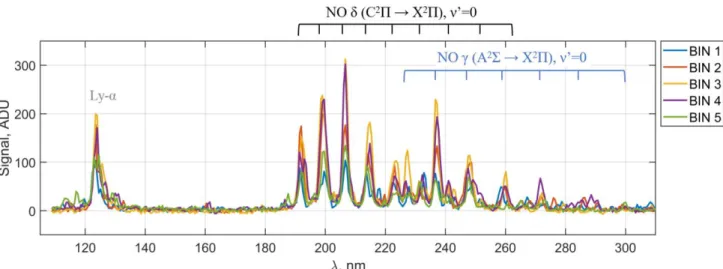
3.2.4. Sources of an additional emission registered by the UV channel of SPICAV ... 55
3.2.4.1. Lyman-α emission ... 56
3.2.4.2. Airglow of nitric oxide ... 57
3.2.4.3. Solar radiance in the stellar occultation spectra ... 59
3.2.5. Wavelength- to-pixel registration ... 59
3.2.6. Spectral inversion ... 61
3.2.6.1. Cases of positive gas detection ... 62
3.2.6.2. Upper detection limits for two gases. ... 65
3.2.6.3. Chlorine oxide absorption band ... 70
3.2.7. Vertical inversion problem ... 71
3.2.8. Calibration influence on the spectral inversion ... 73
3.2.9. Stray light elimination technique ... 75
3.2.9.1. Method #1... 76
3.2.9.2. Method #2... 76
3.2.9.3. Comparison of methods ... 77
3.2.9.4. Atmospheric transmission and error bars estimation. ... 82
3.2.10. Altitude assignment ... 82
3.3. Summary ... 84
CHAPTER 4. Sulphur dioxide ... 85
4.1. CO2 and SO2 retrievals: from column abundances to profile and its variability. ... 85
4.1.1. Carbon dioxide distribution in the upper mesosphere and the lower thermosphere. ... 86
4.1.2. SO2 in the upper mesosphere ... 87
4.2. SO2 profiles: Comparison with data from previous studies. ... 88
4.3. Variations of SO2 mixing ratio ... 93
4.3.1. Short term variations ... 93
4.3.2. Long term variations of SO2 mixing ratio. ... 94
4.3.3. Diurnal variations of SO2 ... 96
4.3.4. Geographical distribution of SO2 ... 99
4.3.4.1. Local time and latitude distribution ... 99
4.3.4.2. Variations with a solar zenith angle ... 100
4.3.4.3. Establishing independence from topography ... 100
4.4. Discussion. ... 103
4.4.1 Rapid changes in the SO2 content... 103
4.4.2. Global patterns in the SO2 behaviour ... 104
4.5. Summary ... 105
CHAPTER 5. Ozone ... 106
5.1. Ozone retrievals ... 106
4
5.2. Ozone positive detections distribution ... 108
5.2.1. Average volume mixing ratio profile of ozone for established positive detections. ... 108
5.2.2. Spatial variations of ozone positive detections... 109
5.2.3. Temporal variations of ozone based on positive detections ... 111
5.3. Detection limits of ozone ... 112
5.4. Review of possible correlations with other chemical compounds ... 114
5.5. Comparative analysis of ozone layers in Earth, Mars and Venus atmospheres. ... 120
5.5.1. Ozone on the Earth ... 120
5.5.2. Ozone on Mars and Venus ... 123
5.6. Summary ... 124
CHAPTER 6. O2 (α1Δg) emission in the upper mesosphere ... 126
6.1. The infrared emissions in the night atmosphere ... 126
6.2. SPICAV observations of lower atmosphere thermal emission ... 127
6.3. Modelling of the night thermal emission... 129
6.3.1. Direct model ... 129
6.3.2. Inverse problem ... 131
6.4. Mapping water vapour and aerosols and uncertainties ... 132
6.5. Map of oxygen airglow in the night mesosphere ... 134
6.6. Summary ... 136
CONCLUSION ... 137
PERSPECTIVES ... 139
LIST OF PUBLICATIONS ... 141
LIST OF CONFERENCES ... 142
ANNEX 1. Positive detections of SO2 presented individually ... 144
ANNEX 2. Positive detections of O3 presented individually... 156
ANNEX 3. Parameters of stellar occultation sessions ... 160
ANNEX 4. Weighted mean ... 166
ANNEX 5. Estimation of an impact of diffrent stray light types ... 167
ANNEX 6. Résumé de la thèse en français ... 170
5
ACKNOWLEDGMENTS
The work on this study has become the most fascinating and instructive experience in my professional and personal life. And I would like to thank sincerely everyone who helped me to successfully complete this study and my PhD thesis.
I appreciate the wise supervision of Franck Montmessin at LATMOS. I thank you for all your advices and discussions, your support of my work and a lot of administrational assistance. Your supervision and competence made my work in LATMOS for these years being a remarkable experience. I am very grateful to my co-supervisor Denis Belyaev accompanying my work at the Space Research Institute of the Russian Academy of Sciences (IKI RAS). I thank you for proposing a subject of this study for me. Especially I appreciate that you have always been present and kind to help me with all my questions. The joint work with my supervisors allowed me to grow up my proficiency, and it was a source of every day motivation. I also would like to thank Emmanuel Marcq for sharing your experience with me and for your support with administration difficulties I have faced.
The defence of the thesis, under the joint supervision, became possible thanks to the French government BGF PhD grant 2016-2019 Vernadski, which is an honor for me. I sincerely thank the Embassy of France in Moscow. Also, I am grateful to LATMOS and to IKI RAS for providing me the chance to perform the PhD study under these terms, and for the additional financial support to complete the research.
I acknowledge the work with Anna Fedorova on the infrared spectra of Venus. I thank you for providing me a basis to perform this analysis and all your supervision and ideas during all the rough way of this research. Furthermore, I appreciate the big contribution of Oleg Korablev, the deputy director of IKI RAS, for organization of the joint supervision and of the defence. I would like to thank you as the PI of SPICAV IR spectrometer for a beautiful and informative experiment. The major part of this work was done based on the measurements of the SPICAV UV instrument, and I wish also to thank Jean Loup Bertaux, a PI of this experiment. The clues to analysis and the work with you was very important for me.
I would like to express my deep gratitude to all the members of the jury, Nathalie Carrasco, Sebastien Lebonnois, Alexander Rodin, Nicholas Schneider, Dmitry Titov, who were very kind and supportive during the organization of the defence in the complicated and stressful time of 2020-2021. I am very grateful to my two reviewers Sebastien Lebonnois and Dmitry Titov, for taking the time for careful examination of my manuscript. And I would like particularly to thank the president of my jury, Nathalie Carrasco, for full cooperation, and thank you for being a member of my thesis committee and for following steps of my work from the beginning. I am also very grateful to Franck Lefèvre for being a member of my thesis committee and for a lot of explanations concerning the Venus general circulation modeling.
In this work some results are compared with the IPSL Venus general circulation mode, which were prepared by Gabriela Gilli. I am happy to have a chance to cooperate with you and I appreciate very
6 much your participation in deeper analysis of the obtained experimental results. Thank you to Lucio Baggio and Loïc Verdier for cooperation during the study of data calibration efficiency.
This PhD project under the joint supervision was very supported by the directors of the École doctorale N°127: astronomie et astrophysique d’Ile-de-France (AAIF), Thierry Fouchet and Jeacques Le Bourlot, and its deputy director Alain Abergel at all the stages, and I am very grateful for this extremely valuable support. Similarly, I appreciate the assistance of the LATMOS directors: Dr. Phillip Keckhut and Pr. Francois Ravetta. I also thank the administration of the École doctorale, the Université Paris-Saclay and the Université de Versailles St Quentin en Yvelines, and the administration of the doctoral school of IKI, Angelina Shchukina and Andrey Sadovsky.
Thank you also to all my colleagues, the members of SPICAV, SPICAM and ACS teams, I have worked with in France and in Russia. It was great to have met my colleges: Loïc Rossi, Kevin Olsen, Gaetan Lacombe, Anni Määttänen, Aurélien Stcherbinine, Abdenour Irbah, Ashwin Braude, Margaux Vals, Hugo Gilardy and Jean-Yves Chaufray. Furthermore, I was happy to participate in the European research course on atmospheres, and gain a lot of the experience. And it was a great pleasure to continue working with my colleges: Alexander Trokhimovskiy, Nikolay Ignatiev, Michail Luginin, Andrey Patrakeev, Nikita Vyasovetsky, Yuri Dobrolensky, Vladimir Kotsov, Sergey Mantzevich, Alexander Lomakin, Nadezhda Rotova, Marina Patzaeva, Igor Khatuntsev and Alexandra Smirnova. I appreciate your friendship very much. I am very grateful to Sergey Khaykin for support and some Russian language in France. I would like also to thank my dear friends Olya, Alina, Slava, Kemal, Artem, Sasha, Olya and my family for continuous support, belief and guidance.
7
PURPOSE OF THE WORK
The structure of Venus’ atmosphere and the study of its composition have remained a challenge for scientists: which processes of the planet’s evolution did lead to the observed atmospheric condition crucially different from the Earth’s atmosphere. Various models based on the data up to date show that an overall picture of the atmospheric composition and dynamics has not yet been obtained. Prior to the Venus Express (VEX) mission (2006-2014), a detailed study of the atmosphere and minor gas components above the clouds, where the defining processes take place, was not possible. For the first time, the VEX experiments of solar and stellar occultations studied in detail the vertical structure of the atmosphere on both planetary terminators and on the night side.
The SPIСAV spectrometer could observe several trace gases using its ultraviolet (UV) channel (118-320 nm). The Venus Express mission with this instrument on board was operating for 8 years. Sensitivity of the implemented stellar occultation method establishes the observed altitude range to 85-110 km. A large amount of unique information has been accumulated for a detailed study of variations in atmospheric components. Sulphur dioxide and ozone are the two atmospheric minor species which are targets of our study in Venus mesosphere. The study of their distribution in the night mesosphere is the goal of this work. It contributes to global understanding of the main chemical processes which are the carbon dioxide and sulphur dioxide cycles in the Venus atmosphere.
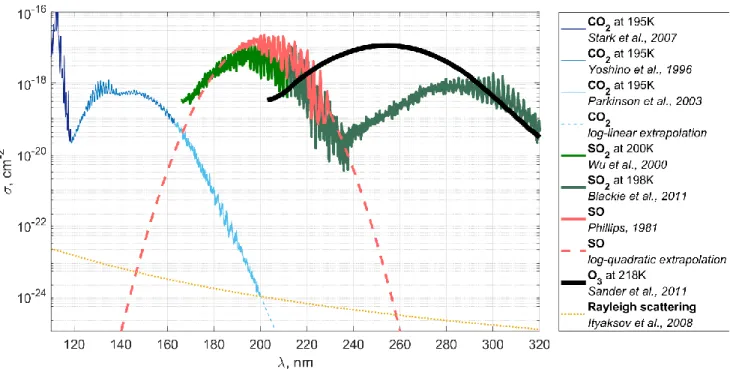
Sulphur dioxide possesses ultraviolet absorption bands in 190-300 nm. The gas was extensively observed by ground-based telescopes and orbiters on the day side of the planet at the level of clouds top (~70 km) for more than 40 years on Venus. On the other hand, the SPICAV/SOIR instrument of Venus Express mission sounded the vertical distribution of SO2 at altitudes 65-110 km on the terminator.
Variations of the dioxide content occurred to be extremely high in the dayside and twilight mesosphere. So far, there was no data from SO2 distributions at the night-time mesosphere where photochemical and
temperature conditions differ from those at the day time. The first goal of our study is to obtain a mesospheric distribution of sulphur dioxide at the night side of Venus. Spatial and long-term variations are to be compared with previous dayside results.
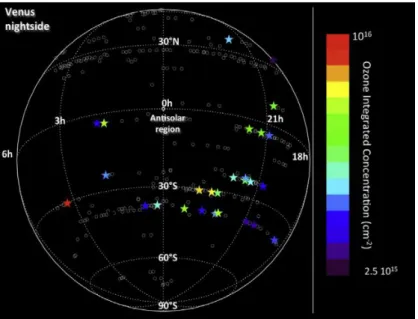
The second scientific objective deals with the recent discovery of an ozone layer in Venus’ mesosphere on the night side (Montmessin et al., 2011). Absorption of ozone in the Hartley band (~250 nm) was observed by the SPICAV UV in the stellar occultation mode at altitudes 90-100 km. Just episodic bursts of O3 mixing ratio with a few tens ppbv were detected in 2006-2010 from 29 observation sessions. That
was consistent with ozone production and destruction schemes according to reactions with oxygen and chlorine atoms in the anti-solar point at the SSAS circulation. Such a mechanism takes place in the Earth’s upper stratosphere. In parallel, an abundance of ozone was recently discovered at the Venusian cloud tops near polar regions (Marcq et al., 2019) that signifies the O3 interconnection with the
atmospheric dynamics.
In the present research we have processed the whole statistics of the SPICAV UV stellar occultations in 2006-2014, that is >400 sessions. We characterize ozone distribution at altitudes 90-100 km, the region
8 corresponding to airmass transitions between two circulation mechanisms. This study of the ozone behaviour on the night side will improve existing atmospheric models and will provide revealing the differences between the terrestrial atmospheres.
Another process leading to ozone formation results in oxygen (α1Δg) airglow at 1.27 μm primarily
formed at about 95 km which corresponds to the altitude range of the ozone detections. Our analysis was also supplemented by the night-time observations of the O2 emission by the infrared (IR) channel of
SPICAV.
In order to accomplish the SO2 and O3 vertical distribution study, all processed stellar occultation spectra
of SPICAV have to be cleaned and calibrated. It is important to provide the detection even at small concentrations of these gases. The importance of calibration is revealed by the analysis of the night-time SO2 vertical distribution when considering two different calibration approaches (Belyaev, Evdokimova
et al., 2017 vs. Evdokimova et al., 2020).
The thesis is organized in 6 Chapters.
Chapter 1 contains an overview of basic knowledge about Venus and its atmosphere.
Chapter 2 presents a result of sulphur dioxide and ozone observations in detail. The explanation of observed data is partially presented in several photochemical models that summarize a knowledge about chemical processes affected by the atmospheric circulation.
Chapter 3 describes the used dataset and the observation technique that was performed by SPICAV UV. The data processing algorithm is presented in detail including a test of the experiment sensitivity and improvements that were used.
Chapter 4 is devoted to the obtained results of SO2 content and its analysis.
Chapter 5 is devoted to the obtained results of O3 content and its analysis.
Chapter 6 considers the O2 (α1Δg) airglow at 1.27 μm as an additional source of the information about
the Venus night mesosphere. The nadir observations by SPICAV IR are used to retrieve a nigh-side distribution of the emission intensity.
9
CHAPTER 1. Venus and its atmosphere
Figure 1.1. False colour image of Venus clouds by the Ultraviolet Imager (UVI) on board the Akatsuki spacecraft on the 30th of March 2018. Images at 283 nm and 365 nm were superimposed. Blue colour corresponds to the 283-nm absorption by SO2, red colour corresponds to unknown UV absorber (365
nm). © Japan Aerospace Exploration Agency (JAXA)
10
1.1. The Earth’s evil twin
Since ancient times the second planet from the Sun and the closest to the Earth, Venus, has been the object of close attention. Out of the terrestrial planets, this planet is the most similar to the Earth in size and mass. So it is often called the «sister» planet or even the «twin» of the Earth: its radius is 6052 km and its mass is 4.87×1024 kg, that is 95% and 82% respectively of the Earth’s. In other respects, the
differences between the two planets can be significant (Colin, 1983). Moving in an almost circular orbit around the Sun, with an eccentricity of 0.00677 and at an average distance of 0.723 astronomical units (108 million km), Venus approaches the Earth at a minimum distance of 38 million kilometers. For comparison, the minimum distance to Mars, the fourth planet of the terrestrial group, is one and a half times greater. Thus, the planet makes a complete revolution around the Sun in 224.7 Earth days.
Venus is one of the two planets in the solar system with retrograde rotation. Venus’ rotation axis inclination angle is 177°, thus, it is nearly perpendicular to the ecliptic plane. Such an axis tilt and orbital parameters exclude a presence of seasons on the planet. In addition, Venus rotates very slowly. The period of the planet’s revolution around its own axis is approximately 243 Earth days. However, due to the retrograde rotation, a solar day on the planet lasts about 116.75 Earth days, and a complete revolution around the Sun amounts to only 1.92 Venus days. This slow rotation has allowed the gravimetric surface of Venus to maintain a spherical shape, mitigating polar compression.
Our knowledge on Venus before the beginning of the space exploration era was rather scarce. In 1610, using the first telescope, Galileo Galilei was the first who observed a change of the visible diameter of Venus and its phase that became a proof of the planetary movement around a single centre, i.e. the Sun (Chruikshank, 1983). The historical discovery was made by M.V. Lomonosov on June 6, 1761 during the planet’s transit over the solar disk. He noticed a halo of light emerging around the Venus disk when observed at the Sun limb. The scientist correctly explained the pattern as light scattered by an atmosphere enshrouding the planet. In his work M.V. Lomonosov concluded: «The planet Venus is surrounded by a noble air atmosphere, such (if only not more), which is poured around our globe.» (Lomonosov, 1761, the citation is translated to English by the author). It took more than three centuries to obtain more detailed information about the structure of the atmosphere.
For an astronomical observer using the visible range of the spectrum, Venus appears as a slightly yellowish bright disk without pronounced features. This is due to an opaque cloud layer having no “holes” and hiding the surface for remote observations. At the dawn of the Venus exploration era this peculiarity of the planet was a cause of diverging hypotheses about the conditions below the clouds, at the surface and a possible presence of life. The high albedo of the clouds, which reflect about 80% of the solar radiation, provides an amount of energy received by Venus from the Sun, comparable to that of the Earth. Until the 1960s, this led some scientists to assume the planet’s climate to be similar to the temperate climate of the Earth (Cruikshank, 1983). One can simply estimate the effective temperature for Venus, which is 231 K (-45° C). However, the first radio astronomical observations (Mayer et al., 1958) showed that the conditions near the surface are much more severe and not comparable to those on Earth. The planet’s surface reaches 750 K (477º C). The reason for such a hot surface is the significant greenhouse effect produced by the dense CO2 atmosphere.
11 A detailed study of Venus would not have been possible without the contribution made by spacecraft reaching the lower atmosphere and surface. One of the important examples is that the pressure at the surface reaching 90 bar was measured only when the Soviet station of Venera 7 released the first landing on the 15th of December 1970. The space exploration of the planet started in 1962.
1.2. A new view of Venus
The era of active spacecraft exploration of Venus coincided with increased research interest in climate change on Earth. New knowledge about the Venusian atmosphere has made this planet an example of a world where the uncontrolled greenhouse effect has heated the airmass below clouds and the surface up to enormous temperatures (Sagan, 1960; Rasool and De Berg, 1970). The discovery of this phenomenon has become a catalyst for the study of such processes on Earth. Venus gives an example of the extreme greenhouse effect in a dry carbon dioxide atmosphere. Since the two planets are similar by size and mass the researchers need to understand which processes may become responsible for triggering an uncontrollable greenhouse effect on Earth. Not only the impact of carbon dioxide is to be considered. The Venus clouds, reflecting 76% of the sunlight, should protect against the surface overheating. However, at wavelengths shorter than 2.5 μm, concentrated sulphuric acid, which dominates the composition of aerosol particles on Venus (Sill, 1972; Young, 1973), also absorbs radiation contributing to some extent to the greenhouse effect. That is why, researchers of the Earth’s atmosphere have paid more attention to the chemistry of sulphur compounds. The possible impact of sulphate aerosols, both volcanic and anthropogenic, on changes in the Earth’s global temperature was also reassessed (Hansen et al., 1978).
Our neighbour, being an object of scientific observation of new physical and chemical processes, has demonstrated the importance of controlling them also on Earth (Prinn, 1982). The stability of the relative carbon dioxide content (96.5%) on Venus raised the issue of a large influence of minor gaseous components on chemical processes in the atmosphere. Carbon dioxide is actively photodissociated, but it less effectively restored from the produced CO and O2. Thus, this should reduce its amount. The first
CO2-atmosphere models of Mars and Venus showed the importance of catalytic cycles (Cruikshank,
1983; Krasnopolsky, 2011). In these reaction chains minor gas components are catalysts, and they contribute to CO2 restoration without changing themselves. At the same time, the effect of such
processes on the Earth’s stratospheric ozone was studied. The observations showed a smaller amount of O3 than a model considering only photolysis for its destruction provided (the Chapman mechanism from
Chapman, 1930). Both natural sources (products of water photolysis) and anthropogenic impacts (combustion products from rocket fuel in the stratosphere) were considered. Halogens were already found in the Venus atmosphere at that time (Mueller, 1968). Works of Prinn (1971) and McElroy et al. (1973) showed the importance of chlorine compounds, namely the detected hydrogen chloride, as catalysts. The chains of chemical reactions in the photochemical model of the Venusian atmosphere also included oxygen compounds, which partly showed the effect of chlorine-containing substances on the breakdown of the ozone molecule. Later on studies of catalytic chemistry of anthropogenic emissions, especially volatile chlorine compounds (Wofsy and McElroy, 1974; Stolarski and Cicerone, 1974;
12 Molina and Rowland, 1974), demonstrated their effect on the ozone loss in the Earth’s atmosphere (Farman et al., 1985).
With the development of exoplanet science, the existence of life on Earth started to be considered in the context of searching for habitable worlds near other stars. A «habitable zone» criterion for the planetary system was formulated by Kopparapu et al. (2013). This criterion defines the location of the planet in respect to a parent star so that conditions on its surface allow the presence of liquid water. This is the only robust criterion for the possible origin of life so far. The habitable zone also limits the runaway greenhouse effect during the planet’s evolution, which brings the atmosphere to a state similar to that it is on Venus now. In the context of the habitable zone near the Sun, Venus is on its inner boundary (the orbit of Venus is 0.723 AU, while the inner boundary of the inhabited zone is 0.75 AU). However, based on current atmospheric composition knowledge, modelling also shows that conditions on Venus in its past did not rule out the possibility of an ocean on its surface (Way et al., 2020). If this hypothesis is confirmed in future studies, the limits of search for life shall be extended beyond the inner boundary of the habitable zone, into the «Venus zone», where many more planets are currently found than in the canonical habitable zone.
1.3. History of observations
1.3.1. Venus space missions
In total, 27 spacecrafts were launched and successfully performed science experiments either around Venus, or inside the atmosphere or on the surface: 19 from the Soviet Union, 6 from the United States of America, one European Venus Express orbiter in 2005, and one Japanese Akatsuki station in 2010.
The first period of active exploration of Venus was led by space programs of the USSR and the USA. At least one mission in every «astronomical window» was launched in the period from 1965 to 1985. The USSR led the series of «Venera» and «Vega» stations which successfully landed on Venus 10 times. On the U.S. side, several spacecraft (Mariner 2, the first interplanetary probe, Pioneer Venus and Magellan) were sent to the planet from the sixties to the nineties. One descent probe also reached the surface as a part of the Pioneer Venus 2 mission. Table 1.1 shows the timescale of successful missions to Venus.
The first spacecraft, which successfully reached the orbit of Venus, was the American Mariner 2 mission launched in 1962. Its measurements confirmed the slow retrograde rotation of the planet, high surface temperatures and a dense cloud cover. In addition, the calculation of the spacecraft trajectory made it possible to estimate the mass of the planet, which was not yet precisely known. In 1967, Venera 4 was the first probe which made in situ measurements in the atmosphere of a planet other than Earth during its descent to the surface down to 26 km. This made it possible to confirm that CO2 was the main
component of the atmosphere and that the estimated surface pressure (~100 bar) exceeded the values expected at that time (Avduevskij et al., 1968). This pressure estimate was later confirmed by radiometric soundings from the Mariner 5 probe. The Venera 5 and 6 stations also attempted to land on the planet surface, but none of them were successful due to the extreme temperatures and pressures encountered during the descent.
13 Table 1.1. A timeline of successful missions to Venus. The survey of 60-90s is done based on Moroz et al. (2002), Limaye (2015), Drossart and Montmessin (2015), Fukuhara et al. (2017), Horinouchi et al. (2017)
Year Space mission Country Results
1962 Mariner 2 (Flyby)
USA The first spacecraft that reached Venus. 1967 Venera 4
(Lander)
USSR The first in situ measurements on another planet down to 26 km. Temperature measurements, structure of outer layers, CO2 estimated at 90-95% of the composition.
1967 Mariner 5 (Flyby)
USA Temperature measurements, structure of outer layers, CO2 content was 85-99%.
1969 Venera 5 & 6 (Landers)
USSR Measurements of temperature, pressure, wind speed, CO2 content was 93-97%, N2 - 2-5% O2 -
<4% in the range of 25-55 km. The two probes worked down to 18 km. 1970
1972
Venera 7 & 8 (Landers)
USSR First soft landing on the surface of another planet. The temperature was found to be ~748K and the pressure ~90 bar.
1974 Mariner 10 (Flyby)
USA Images of clouds in the IR and UV. First high-resolution UV images. 1975 Venera 9 & 10
(Orbiters, landers)
USSR First surface panoramas. Studies of the structure and composition of the atmosphere and the cloud layer. The lower cloud boundary was found to be at 49 km, while the cloud was found to consist of 3 layers: 49-52 km, 52-57 km, 57-70 km. From the orbit, images of the cloud layer, the temperature distribution over the upper boundary of the clouds, the spectra of the planet’s night glow, multiple radio soundings of the atmosphere and ionosphere were obtained.
1978 Pioneer Venus 1 (Orbiter) & 2 (4 atmo- spheric probes)
USA Operated in orbit from 1978 to 1992. Continuous sounding of the middle and upper atmosphere. The composition of aerosol particles of clouds contains sulphuric acid. The landing modules obtained an abnormally high content of inert gases in the atmosphere, and studied the dynamics of the lower atmosphere.
1978 Venera 11 & 12 (Flyby, landers)
USSR The mass spectrometer detected trace amounts of water vapour, chlorine, sulphur and their compounds. The location of the cloud lower boundary at 48-49 km.
1982 Venera 13 & 14 (Flyby, landers)
USSR The first coloured panoramas of the surface. Some small gas components detected - sulphur and chlorine compounds. An abnormally small amount of water in the atmosphere.
1983- 1985
Venera 15 & 16 (Orbiters)
USSR A radar map of 30% of the surface corresponding to the Northern Hemisphere. IR observations of the atmosphere: reconstructing the temperature profile, calculating thermal winds in the
mesosphere, determining the content of H2O and SO2 at the cloud top and studying the parameters
of the clouds. 1985 VeGa 1 & 2
(Flyby, atmo- spheric probes, landers)
USSR Balloons: study of winds, particle sizes and their composition in the cloud layer at an altitude of 53-54 km. The wind speed reached 66 and 69 m/s. Landers: multiple results on the atmosphere, including SO2 profile below clouds. The surface composition analysis by the Vega 2 lander.
1990- 1994
Magellan (Orbiter)
USA First full-scale radar mapping of Venus from the orbit. Gravity map of 98% of the surface.
1989 Galileo (Flyby)
USA First images and spectra of Venus night radiation in the near-IR range - thermal radiation of the lower atmosphere and surface.
1997 Cassini -Huygens (Flyby)
USA, Europe
Images and spectra of Venus night radiation in the near infrared range.
2005 Messenger (Flyby)
USA During the flyby around Venus, the upper atmosphere of Venus was observed in the near-IR, visible, UV and X-ray ranges. Joint observations with the Venus Express mission.
2006- 2015 Venus Express (Orbiter) Europe, Russia
First observations of a double vortex at the planet’s South Pole. Detection of OH in the
atmosphere of Venus (VIRTIS). Detection of ozone in the mesosphere of Venus. HDO/H2O ratio
in the upper atmosphere is 240 ± 25 times higher than on Earth, and ~1.5 higher than in the lower atmosphere. Discovery of a warm layer in the night mesosphere at an altitude of 100 km. Since
2015
Akatsuki (Orbiter)
Japan Study of the structure of the atmosphere. The image of a global gravity wave in the cloud layer in the region of the Aphrodite-Terra mountain range in the IR range. The equatorial jet of Venus in the cloud layer.
14 The first soft landing was made in 1970 by Venera 7 on the night side of the planet. During its 23 minutes of operations on the surface, temperature and pressure were measured, as well as the composition of the crust using gamma spectrometry. A pressure of 90±15 bar and a temperature of 748±20 K (475±20°C) were obtained at the surface. Venera 8 confirmed the possibility of taking photos at the surface: illumination on Venus surface near the evening terminator turned out to be equal to the Earth twilight. Venera 9 and 10 landers performed the first imaging of the surface. During the descent, nephelometers studied the composition and structure of the atmosphere and of the cloud layer (see Table 1.1). Venus was then reached by the 2 Pioneer Venus (PV) missions led by NASA. PV 1 was orbiting the planet from 1978 to 1992 and sounding the atmosphere remotely. The concept of PV 2 contained 4 descent probes: one large and three small modules (the North Probe, the Day Probe and the Night Probe). The Day Probe successfully landed and transmitted data from the Venus surface for ~60 minutes (Colin, 1979). The important observations of the cloud layer structure were done during descent (Knollenberg and Hunten, 1980). Further development of the Venera program allowed obtaining unique phenomena of atmospheric lightning. The electrical activity was registered by the GROZA experiments on board the Venera 11 and Venera 12 missions (Ksanfomaliti et al., 1979). The composition of cloud aerosols was supplemented by such components as chlorine and phosphorus, although it was not possible to identify compounds. Moreover, Venera 13 and 14 conveyed the only colour surface panoramas. The Venera 15 and 16 orbiters mapped 30% of the surface in the Northern Hemisphere.
The era of the Soviet study of Venus ended with the Vega mission, which combined explorations of Venus and Halley’s comet. The part dedicated to Venus contained two aerostat balloons placed into the clouds. They were tracked by the ground based NASA’s Deep Space Network, and the data of their motion provided the wind velocities at an altitude of 53-54 km (Kremnev et al., 1987). Convective and turbulent activities in the cloud layer and the aerosol composition were characterized in detail. The both probes also detected lightning discharges on the night side. Vega 2 for the first time landed in a high mountain region, where the Venusian rock was found to be a close analogue of terrestrial volcanic material (Surkov et al., 1986). It is the only spacecraft measured the high-resolution temperature profile down to the surface and found the anomalius behaviour below 7 km (Crisp and Titov, 1987).
NASA’s Magellan mission accomplished a topographic mapping of the surface in detail (spatial resolution ~100 m) in the early 1990s (Saunders et al., 1992; Bindschadler, 1995). Magellan payload included a synthetic aperture radar and an instrument for studying the gravitational field of Venus. In September 1990, Magellan began its scientific mission, which lasted for 4 years. Radar showed more than 1660 volcanic landforms. This number included 274 intermediate volcanoes 20-100 km in diameter and 56 large volcanoes greater than 100 km in diameter (Saunders et al., 1992). It was found that 85% of the planet’s surface is covered by lava flows. The surface of Venus has different tectonic features with a variety of scales (Solomon et al., 1992). The absence of erosion has saved them in well-defined structures. As a result, 98% of the planet’s surface was mapped (Figure 1.2), and moreover, stereo maps of the surface were also obtained. In addition, it was concluded that the surface of Venus is geologically young (<500 million years) because only a few impacts craters were found at the surface (Bullock et al., 1993).
15 Figure 1.2. The topographic map of Venus produced by the Magellan mission.
In 1989 Galileo on its way to Jupiter was able to measure spectra of Venus transparency windows. After the Magellan mission and the Galileo flyby, there was a pause in the Venus space exploration apart from several flybys by spacecraft accomplishing a gravitational manoeuvre around Venus.
The new era of space exploration of Venus began with the launch of the European Space Agency’s (ESA) Venus Express (VEX) mission (Svedhem et al., 2007). For ESA it was the first spacecraft to explore Venus. Venus Express is the heir of Mars Express (MEX) and Rosetta (Chicarro et al., 2004; Glassmeier et al., 2007). The probe was successfully launched on November 9, 2005 by a Soyuz-Fregat rocket from Baikonur, Kazakhstan. The spacecraft reached Venus on April 11, 2006, and the scientific mission started on May 6, 2006. The spacecraft’s orbit was highly elliptical and quasi polar. One of the VEX goals was to investigate in detail the South Pole of the planet, which had not been explored before by other missions because of their orbit properties. The pericenter of the VEX orbit was located at a latitude of 80°N and an altitude of 250 km. The period of this orbit was 24 Earth hours.
In 2010, the Akatsuki scientific mission of the Japan Aerospace Exploration Agency (JAXA) was supposed to be inserted in orbit around Venus (Nakamura et al., 2011). However, the spacecraft entered the target orbit after the second attempt, five years later namely on December 9, 2015 (Nakamura et al., 2014). Ultraviolet camera (UVI), long-wave infrared camera (LIR), 1-μm (IR1) and 2-μm (IR2) cameras as well as lightning and atmospheric glow detectors are installed on board and keep operating at the time this manuscript is being written. After one year the IR1 and IR2 cameras stopped operations in nominal mode. Akatsuki observation in the IR identified dynamical processes occurring in lower clouds. The influence of topography was found with the presence of a gravity wave (Fukuhara et al., 2017) in the cloud layer near the Aphrodite-Terra mountain (Figure 1.3).
16 Figure 1.3. A-E. Brightness temperatures of the entire disk of Venus measured by the LIR camera on board the Akatsuki spacecraft from 7 December to 11 December 2015. Solid and dashed lines correspond to the equator and evening terminator correspondingly. The colour bar is valid only for panel A. The temperature ranges for pictures in panels B-E are adjusted so that the mean temperatures in a circle with a radius of 0.1 RVenus at the disk centre are constant, where RVenus is the Venus radius. F. The UV image
17
1.3.2. Venus Express
Figure 1.4. A scheme of Venus Express orbiter and its instruments.
VEX had 7 instruments on board. The Magnetometer MAG and ASPERA-4 were two instruments dedicated to study the ionosphere. MAG was designed to characterize the direction and force of magnetic fields around the instrument (Zhang et al., 2006). The Analyzer of Space Plasmas and Energetic Atoms (ASPERA-4) was designed to measure ionized and neutral particles surrounding the probe (Barabash et al., 2007). MAG and ASPERA-4 enabled to explore interactions between the Venus ionosphere, the solar wind and the resulting induced magnetic field. Also, the two instruments were used to find lightning in the atmosphere of Venus.
The wide-angle Venus Monitoring Camera (VMC) consisted of 4 channels in the visible, ultraviolet and two near infrared spectral filters (Markiewicz et al., 2007). The visible (~550 nm) and the UV (~365 nm) bands were used to visualize and monitor the cloud top that absorbs in the UV. The clouds’ motion and the wind speed distribution were tracked thanks to the contrast UV images of VMC (Khatuntsev et al., 2013). Two IR bands of 0.965 and 1.0 μm were aimed to map the brightness coming from the layers close to the surface and search for possible volcanic activity. The IR data provided candidates of a volcanic eruption event (Smrekar et al., 2010; Shalygin et al., 2015).
The Planetary Fourier Spectrometer (PFS), inherited from the MEX payload, was designed to probe the atmosphere in nadir in the range of 0.9-45 µm at a spectral resolution of 2 cm-1 by two channels (Formisano, 2006). Its main tasks were to study the composition of cloud layer particles and minor gaseous components of the atmosphere, as well as the spatial temperature field below 100 km. Unfortunately, the Venusian PFS collected no data because of a mechanical defect in the scan mirror (Drossart and Montmessin, 2015). The unfulfilled science tasks were partially resolved by the VIRTIS spectrometer.
The Venus Radio Science (VeRa) performed radio occultation experiments (Häusler et al., 2006). The instrument transmitted radio waves from the spacecraft to the Earth’s antenna through the Venus
18 atmosphere or after a reflection from the Venus surface. The purpose of this experiment was to analyse the ionosphere, atmosphere and surface of Venus. It allowed retrieving vertical profiles of atmospheric temperature and density from 40 to 100 km (Tellmann et al, 2009).
The Visible and Infrared Thermal Imaging Spectrometer (VIRTIS), which was previously designed for Rosetta mission, consisted of three spectrometric channels (Drossart et al., 2007). VIRTIS-M in the IR and visible operated in the 1.02-5.13 µm and 0.28-1.10 µm spectral ranges respectively, while VIRTIS-H covered the 1.84-5.00 µm range. These two IR channels included several Venus transparency windows to study the composition of the lower atmosphere. Emission of hydroxyl at 1.40-1.49 and 2.6-3.14 μm was discovered (Piccioni et al., 2008).
The SPectroscopy for Investigation of Characteristics of the Atmosphere of Venus (SPICAV) has been successfully operating for 8 years (Bertaux et al., 2007b; Vandaele et al., 2008; Korablev et al., 2012). It consisted of the UV (118-320 nm) and the IR (0.65-1.7 μm) channels. SOIR (SOIR - Solar Occultation in InfraRed) is an independent high-resolution spectrometer in 2.3-4.2 μm, which was part of the SPICAV/SOIR assembly (Vandaele et al., 2008).
1.3.3. Future missions
The discoveries by the missions of the last 15 years, however, still leave unresolved questions concerning present volcanism and geological activity on the surface, the lower atmosphere structure, the unknown UV absorber in the clouds, the water evolution on the planet, etc. The answers require continued study of Venus both from the Earth and by new exploratory missions to Venus, including modern atmospheric and landing modules. Therefore, the world space agencies assume launches of new missions with a wide range of scientific tasks.
The first in the list is the orbital mission to Venus from the Indian Space Research Organization (ISRO), whose launch was initially scheduled for 2023 (Shaji, 2019) and recently postponed to 2025. The planned mission named Shukrayaan-1 (translated as “Venus craft”) will be devoted to remote sensing of the surface, the atmosphere and the ionosphere. The payload includes VIRAL and IVOLGA spectrometers provided by Roscosmos. The VIRAL IR spectrometer is being developed at the Space Research Institute with the participation of LATMOS. The IVOLGA heterodyne laser spectrometer for the near-IR range is being developed at the Moscow Institute of Physics and Technology.
A post-2025 launch is planned for a new Roscosmos mission in collaboration with NASA. Venera-D or «Venus the Long-lived» will contain a lander based on previous Vega missions with a capability to improve results of previous descent and landing probes. The lander will include one or more long-lived small station LLISSE (Long-Lived In-Situ Solar System Explorer) that is assumed to operate on the surface of Venus for about 60 days (Zasova et al., 2014). It is also planned to implement a module, flying in the clouds, with an ability to manoeuvre vertically and to explore different layers. There will be an orbiter, for data relay, with science objectives similar to those of VEX and with a Fourier spectrometer on board, in order to compensate the PFS loss in 2006. The planned launch date for Venera-D is 2029 or 2031.
19 One of the candidates for ESA is the new EnVision mission (Widemann et al., 2020), which is being prepared in collaboration with NASA. In case of positive selection in 2021 the launch will be in 2032. The objectives of this orbital mission are mapping the surface with a very high spatial resolution (1-30 m), studying its properties in the IR spectrum and studying the atmosphere.
There are six NASA missions as well that are in a designing stage, none of which has yet been selected for launch: VERITAS, DAVINCI, VISE, SAGE, VCM, VITaL. VERITAS (Venus Emissivity, Radio Science, InSAR, Topography, and Spectroscopy) would aim to high-resolution surface study (Smrekar et al., 2016). The combination of IR spectroscopy in transparency windows, radar mapping and gravity field measurements is planned to improve the knowledge about the Venus inner structure and ongoing geological activity. DAVINCI (Deep Atmosphere Venus Investigation of Noble gases, Chemistry, and Imaging) is a proposed atmospheric probe to Venus (Glaze et al., 2016). Venus In Situ Explorer (VISE) and The Surface and Atmosphere Geochemical Explorer (SAGE) concepts propose to land close to a volcano (Squyres, 2011; Esposito, 2011). The Venus Climate Mission (VCM) is a more complex program including an orbiter, a balloon, a mini-probe, and two dropsonde observational platforms (Grinspoon et al., 2010). Similar to VCM is the Venus Intrepid Tessera Lander (VITaL) concept, which is considered for landing on one of the oldest parts of the Venus surface: mountainous tessera regions (Gilmore et al., 2010).
1.4. The surface of Venus
Venus clouds hide its surface. Remote investigation of its composition is almost impossible. Landers studied the surface which appeared to be similar to the terrestrial basalt rocks (Surkov, 1983) that are associated with volcanic activity. Radar measurements made by Magellan revealed that the Venus surface is rather flat, and is mainly shaped by lava plains, produced by more than 1660 volcanoes on Venus (Saunders et al., 1992). The small number of craters implies that the Venus surface is geologically young (<500 million years, according to Bullock et al., 1993).
Figure 1.5. Coloured panorama by Venera 14 at 13.055°S, 310.19° (Phoebe Regio).
The question of active volcanism on Venus is still open. Observations of surface emissivity in the infrared is compatible with an opinion of ongoing volcanic processes. The Venus Express mission revealed four candidates named «hotspots» associated with increased surface emissivity possibly caused by fresh lava flows (Smrekar et al., 2010; Shalygin et al., 2015). This activity was detected near the highest volcano of Venus, Maat Mons, which is located in the Alta rift region. Radar shows light solidified lava flows around the volcano itself, overlapping darker plains with wrinkled ridges.
20 Figure 1.6. (A) The northern part of Maat Mons (2°N, 195°E), the highest volcano of Venus (Basilevsky and Head, 2003). (B) Magellan’s radar map of Northern Atla Regio. Objects A-D are the areas where the candidates for recent volcanic activity were detected. Black arrows show locations where lava flows and rifts are interacting. Radar-dark parabola is the crater Sitwell (Shalygin et al., 2015).
1.5. The atmosphere of Venus
1.5.1. Composition
The first spectrometric observations (Adams and Dunham, 1932) established that Venus’ atmosphere consists of 96.5% carbon dioxide (CO2). The second most abundant gas, nitrogen (N2), constitutes
~3.5% (Von Zahn et al., 1983). Other gases have been measured in much smaller quantities. Trace species are sulphur dioxide (SO2), water vapour (H2O), carbon monoxide (CO), hydrogen chloride
(HCl), etc.
Venus is a very dry planet. The water vapour content under the clouds is 30 ppmv (de Bergh et al., 2006), 1-2 ppmv above the clouds (Fedorova et al., 2008). Water is also contained in clouds’ droplets (Esposito, 1983). This loss of water by Venus is explained by the fact that its molecule dissociates into oxygen and hydrogen. In the absence of a magnetic field on Venus the loss of light hydrogen molecules by the atmosphere is effective. This mechanism is confirmed by the abnormally high HDO/H2O ratio. On Earth,
the standard isotopic HDO to H2O ratio is equal to 3.1153×10⁻⁴ (Hagemann et al., 1970). In the lower
atmosphere of Venus, the HDO/H2O ratio is ~150 times higher than on Earth (Donahue and Russell,
1997). And above the clouds it was measured on average 240±25 terrestrial values, and it is ~1.5 times higher than in the lower atmosphere (Fedorova et al., 2008). Isotopic ratio for hydrogen halides DF/HF = 420±200 and DCl/HCl = 190±50 observed at ~74 km is also high (Krasnopolsky et al., 2013). This is an evidence of an active escape of hydrogen from the atmosphere (Donahue et al., 1997; Gérard et al., 2017).
21 The loss of water, even if it existed in the liquid state on the planet’s surface in the past (Way et al., 2020), is related to the greenhouse effect. CO2 and H2O are mainly responsible for the greenhouse effect
that warms up the surface and the atmosphere. These gases effectively absorb infrared (IR) radiation from the warm surface, making it difficult for heat to escape into space. The tiny amount of water vapour contributes less significantly, which is the opposite in the Earth atmosphere. However, the H2O
absorption regulates the transmission of several IR transparency windows of the Venus atmosphere (Section 1.5.4). On Venus, the cloud aerosol particles (Section 1.5.3) are very reflective making the spherical albedo of Venus equal to 0.76. However, ~3% of solar radiation reaching the surface maintains the enormous greenhouse effect increasing the temperature of the atmosphere by about 200 K. On Earth, the greenhouse influence is about 35 K. The cloud layer additionally to filtering of solar radiation contributes to atmospheric heating on Venus. The aerosols are opaque in most of the IR spectrum of the thermal radiation from the planet’s surface.
While the difference in CO2 abundances in the atmospheres of the Earth and Venus is large, the global
inventory of CO2 on both planets is comparable. On the Earth, most of CO2 is trapped as carbonates at
the floor of oceans. If this trapped CO2 would be released in the Earth’s atmosphere, it would end up in
creating a 100 bar-thick atmosphere of CO2, that is very close to the Venus atmosphere.
1.5.2. Structure of the atmosphere
Like on Earth, several compartments can be distinguished in the atmosphere of Venus: the troposphere, the mesosphere, the thermosphere and the exosphere. Yet, there is no evidence for a stratosphere on Venus, reflecting the absence of an absorbing layer like the terrestrial ozone, which causes a temperature inversion. It is seen in Figure 1.7 showing the temperature profiles on both day and night sides of the planet.
The troposphere, covering altitudes up to 65 km, contains 99% of the entire mass of the atmosphere. The upper part of the troposphere is characterized by active convection. Then the temperature decreases uniformly with increasing altitude, and the atmosphere becomes neutral. The temperature gradient dT/dz was measured to -7.7 K/km (Seiff, 1983) and it is close to the adiabatic lapse rate equal to -g/Cp. The airmass is delivered from the near-surface to the clouds deck while sustaining adiabatic relaxation. Such a behaviour can be traced upon descent in very deep atmospheric layers down to an altitude of ~7 km, where the planetary boundary layer (PBL) begins. The vertical gradient measured by VeGa 2 represents the high instability here (Linkin et al., 1986; Linkin et al., 1987). Possibly, CO2 and N2 can be
fractionated in the deep atmosphere as their properties correspond to super fluid liquids under high temperature and pressure conditions. Then, the N2 abundance should decrease to zero near the surface
and this change of molecular mass would stabilize the lapse rate (Lebonnois and Shubert, 2017). In the vertical structure, there is a layer around ~50 km characterized by the terrestrial normal conditions, which is 1 bar and 293 K. Another peculiarity of the troposphere, there is no significant temperature difference between day and night since the high-density greenhouse CO2 provides constant thermal
balance under the thick clouds. Here thermochemistry contributes significantly to chemical processes. With an increase in temperature and a decrease in the amount of sunlight, thermochemistry becomes the dominant process into the deep atmosphere. Vertical transport delivers constituents to the upper
22 atmosphere. For instance, water vapour and sulphur compounds pass through the cloud layer extending from the upper troposphere to the lower mesosphere.
Figure 1.7. Temperature profile in the atmosphere of Venus as a function of altitude and pressure at noon and midnight at the equator, according to the VIRA climate database (Zasova et al., 2006; Seiff et al., 1985).
Over the clouds, chemistry driven by solar radiation prevails over thermochemistry. The altitude interval from 65 to 120 km corresponds to the mesosphere, where the temperature gradient approaches zero. The mesospheric temperature drops from 250 K (upper edge of the clouds) down to 170 K. The altitude
23 interval between 90 and 120 km, where the temperature of the day side reaches a minimum hosts the mesopause. On the night side, altitudes above ~100 km are occupied by the cryosphere with a further slight temperature decrease. A warm layer by 20-40 K was detected here around 100 km from Venus Express observations (Bertaux et al., 2007a). It is likely produced by the adiabatic heating within a downwelling motion or, possibly, by the presence of aerosols (Bertaux et al., 2007a; Picciali et al., 2015).
The thermosphere is located above 120 km up to 200 km (Limayer et al., 2018). On the day side, temperatures are 270-400 K. On the night side, the atmosphere is very cold, which has led scientists to call it “cryosphere”. There, temperatures reach 100 K which is the minimum temperature encountered on Venus. In that range the homosphere becomes the heterosphere, since the homopause on Venus was measured at 120-132 km (Mahieux et al., 2015). So the CO2 is the dominant gas of the Venus
thermosphere up to ∼140 km and ∼155 km on the night and day sides respectively (Niemann et al. 1980; Kasprzak et al. 1997). But at higher altitudes abundances of lighter compounds increase (Niemann et al. 1980; Seiff and Kirk, 1982).
Above 120 km, the number of particles ionized by the UV radiation, the solar wind and cosmic rays, increases. The maximum density of the ionosphere on the daytime side is located at an altitude of 140 km. Venus does not have a magnetic field, so the particles of the solar wind interact directly with the atmosphere, changing the characteristics of the ionosphere depending on the activity of the Sun. The ionosphere determines the parameters of the induced magnetic field of Venus, which turns the solar wind particles around the planet.
1.5.3. The cloud layer
The first data on the composition of aerosol particles in the cloud layer were obtained on the basis of measurements of the brightness temperature and polarimetry (Sill, 1972; Young, 1973; Hansen et al., 1974; Pollack et al., 1974). These measurements forced the community to discard the hypothesis of water-dominated clouds. Knowledge about the depth and the structure of the clouds was derived from descent probes. It is still the most valuable dataset for describing the vertical layering of Venusian clouds.
The vertical thickness of the cloud layer was measured to be more than 20 km, with particles detected in the altitude range from 47 to 70-75 km. Three modes of aerosol particles are forming the cloud layer. Each mode is characterized by a specific modal radius: <0.4 µm for the mode 1, 1.05 and 1.25 µm for modes 2 and 2’ correspondingly, 3-4 µm for mode 3 (Esposito et al., 1983). The modes populate three cloud layers, upper and lower hazes differently: the largest mode (mode 3) prevails in the lower and middle cloud layers and the lower haze, which forms the bulk of the clouds. Mode 1 and 2 are contained in the upper layer (50-70 km) and in the upper haze (>70 km). The lower haze was detected down to 30 km. The upper haze reaches an altitude of ~110 km.
The main component of aerosol particles in the Venusian cloud layer is an aqueous solution of sulphuric acid (75-90%). Sulphuric acid is mainly produced from SO2 and H2O under solar light in the upper cloud
layer, considered as a photochemical “factory” (Titov et al., 2017). SO2 + O → SO3
24 SO3 + H2O → H2SO4
SO2 and H2O are transported upward from the lower atmosphere to supply the production of sulphuric
acid. H2SO4 formation is followed by condensation. While the aerosol particles descend lower in the
cloud deck forming larger particles until they evaporate. Below clouds H2SO4 is decomposed in
thermodynamic equilibrium reactions back to SO2 and H2O to restart the cycle (Mills et al., 2007).
Figure 1.8. Modal partitioning of number density by the cloud particle size spectrometer on board the Pioneer Venus Sounder probe (Knollenberg and Hunten, 1980).
The largest particles form the bulk of the clouds. However, it is controversial whether it is a separate mode or a tale of the mode 1 and 2 distribution. Mode 3 detailed composition is still a mystery. It is also controversial if these particles are crystallized or liquid and if the mode 3 includes some other species additionally to H2SO4 (Knollenberg and Hunten 1980). Descend probes of Venera 13, 14 and Vega 1, 2
detected the presence of sulphur, chlorine, phosphorus and iron (Petryanov et al., 1981; Andreichikov, 1987) without specification of the substance.
Some uncertainty remains in the composition of the lightest aerosol particles. Remote observations in the UV range have shown that the clouds contain an unknown absorber effective at λ>320 nm. It is associated with additional substances whose composition is not fully known. Many candidates have been proposed: sulphur (S8, S3, S4, OSSO or S2O) and chlorine (FeCl3 or SCl2) species, organic compounds,
mineral dusts or even bacteria (Mills et al., 2007; Zhang et al., 2012; Marcq et al., 2017; Carlson et al., 2016; Frandsen et al. 2016; Krasnopolsky, 2017; Krasnopolsky, 2018; Limaye et al., 2018).
25 Numerous new results were collected by three instruments on board Venus Express mission: VMC, VIRTIS and SPICAV. The upper boundary of the cloud layer was found to decrease from 72±1 km at low and middle latitudes to 61-67 km in polar regions (Ignatiev et al., 2009; Cottini et al., 2015; Fedorova et al., 2016). SPICAV IR data showed that the upper haze reaches an altitude of ∼110 km and also has a latitudinal trend similar as that of the cloud top (Luginin et al., 2016).
1.5.4. Transparency windows
The thermal emission emitted by the hot lower atmosphere and the surface is not totally shielded by the cloud layer and the gases. Between the strong absorption bands of CO2 there are several intervals where
clouds do not absorb and only scatter photons mostly in the forward direction. In these «transparency windows» the IR thermal radiation escapes to outer space. This phenomenon was discovered by David A. Allen and John W. Crawford (Allen and Crawford, 1984) at 1.74 and 2.35 µm. This discovery provided a new tool to study atmospheric properties from the cloud layer down to the surface (Marcq et al., 2008; Arney et al., 2014; Bézard et al., 2011; Fedorova et al., 2015). Thermal radiation of the lower atmosphere and the surface of Venus can only be observed on the night side of the planet since on the dayside the solar radiation is overwhelming in this spectral range.
Figure 1.9. Venus night-side spectrum measured by Galileo mission (Taylor et al., 1997).
Subsequently all transparency windows in the near infrared from 0.85 to 2.5 µm were inventoried (Crisp et al., 1991). The windows in 0.85-1.0 µm correspond to the surface radiation and allow studying its thermal properties and geological processes. For example, the possible volcanic activity of Venus (Smrekar et al., 2010; Shalygin et al., 2015). Radiation of 1.1- and 1.18-μm intervals originates from the first-scale heights, i.e. 0-15 km. The other two transparency windows at 1.28 and 1.31 μm are sensitive to the 15-30 km altitude range (Taylor et al., 1997). At 1.51 and 1.55 μm there are two additional
26 transparency windows. They are characterized by significantly weaker intensity formed at 20-35 km, the difference between their intensity and one of the following 1.74-window is 2 orders in magnitude (Wilson et al., 2009). The 1.74 and 2.35 μm windows correspond to emission formation at 20-30 km and 20-45 km respectively (Taylor et al., 1997).
The transparency windows are located in a range where there are no strong absorption lines for carbon dioxide, which dominates the atmosphere of Venus. Absorption by carbon dioxide is determined only by far-wings of its strong absorption lines. However, the study is also sensitive to trace gases in the lower atmosphere. The absorption bands of water overlap the transparency windows of 1.1, 1.18, 1.74, and 2.35 μm. HCl coincides with the absorption band of water vapour at the maximum of the 1.74-μm transparency window. The transparency window at 2.35 μm is the most sensitive to minor gaseous constituents of the lower atmosphere where the CO, OSC, and SO2 bands are also present.
The main parameter controlling the thermal brightness is the concentration of aerosol in the observed atmospheric column: mainly the scattering by the largest particles of the cloud layer which are found in the lower and middle clouds. Moreover, the intensities in the transparency windows of 1.28 and 1.31 μm, which are insensitive to changes in surface properties and to absorption by trace gas components, are modulated only by variations in the clouds.
Figure 1.10. (A) Spectra measured in five transparency windows during one observation #2941A07 by SPICAV IR spectrometer on board Venus Express spacecraft. Coloured rectangles show factors that modulate the thermal emission in different spectral ranges: aerosol scaterring, surface emissivity and water vapour absorption. The orange rectangle highlights the spectral range of the mesospheric O2 (a1Δg)
airglow at 1.27 μm. (B) The geographical locations corresponding to measured spectra.
The first space measurement of the full night IR spectra of Venus was done during Galileo flyby in 1989 (Figure 1.9). The IR emission has been monitored by ground-based high-resolution spectrometers and during the Venus Express mission. It has been shown that it can change significantly at small scales reflecting so far unknown variability in the lower cloud layers (Figure 1.10), surface emissivity and minor species content. The 1.28-μm window is contaminated by the mesospheric oxygen emission at 1.27 μm that needs to be separated to enable the study of the thermal emission spectrum in that range.
27
1.5.5. Mesosphere and atmospheric dynamics
Figure 1.11. Diagram of the main mechanisms of matter transfer in the Venus mesosphere above the cloud layer.
The mesosphere is a very active region where two regimes of atmospheric circulation dominate in two different altitude ranges. A powerful zonal motion dominates in the upper cloud, but at an altitude of ~100 km atmospheric components are subject to a different global circulation regime, characterized by a global motion going from the subsolar point to the antisolar one (Sub-Solar Anti-Solar or SSAS circulation). A retrograde superrotation of the cloud top was obtained by tracking the cloud features exhibited large contrast in the UV. A speed of 110 m/s was then measured. The period of rotation of Venus is 243 terrestrial solar days while the clouds need only 4 days for a full rotation around the planet. There are only two solid surface bodies having this type of global atmospheric circulation: Venus and Titan, the largest satellite of Saturn in the Solar System. Mainly this effect is related (Imamura et al., 2020) to an angular momentum transfer from the slow rotating body to the atmosphere according to the mechanism discussed by Gierasch (1975). This superrotation has its maximum at the cloud tops, however, it was measured down to the surface with a decreasing speed with altitude (Rossow et al., 1980; Counselman et al., 1980; Lellouch et al., 1997)
The cloud top winds have been particularly well studied by the tracking of large-scale features characterised by lower albedo in UV. In the first era of Venus exploration the UV contrasts monitoring was done by Mariner 10 (Limaye and Suomi, 1981), Pioneer Venus (Rossow et al., 1980) and Galileo
28 (Peralta et al., 2007) missions. The cameras on board Venus Express (Khatuntsev et al., 2013; Patsaeva et al., 2015; Bertaux et al., 2016) and Akatsuki (Horinouchi et al., 2018) orbiters resumed this study. The dynamics of the deeper cloud layer was derived from the VeGa balloons (Blamont et al., 1993) and from the continuous monitoring of Akatsuki IR cameras (Horinouchi et al., 2017).
Venus rotates very slowly and the planet’s atmosphere is in cyclostrophic balance. So the zonal winds are directed along the equator due to a balance between the equatorward component of centrifugal force and the meridional pressure gradient (Leovy, 1973). The cyclostrophic winds can be modelled based on the temperature field measurements. The temperature in the Venus atmosphere (40-200 km) was measured from orbiters (Taylor et al., 1983; Zasova et al., 2007; Limaye et al., 2017). However, the process of such acceleration of the atmosphere is still a subject to study, as is the observed dependence of wind speed on altitude.
The zonal super rotation in the upper layer of the clouds is supplemented by a meridional transfer of matter to the poles in Hadley cells of each hemisphere. This meridional transport is carried out at a much slower speed than the zonal one. The speed is lower than 10 m/s. It is assumed that the meridional circulation is effective on Venus in transferring warm air masses to the poles and colder air masses towards the equator (Limaye, 1985). Observations (Limaye, 2007; Peralta et al., 2007; Khatuntsev et al., 2017) show that the Hadley cell exists between the equator and latitude about 65º. It is the region where the top of the cloud going deeper affecting the radiative balance, a cold collar is observed (Garate-Lopez and Lebonnois, 2018). The polar collar is a cold air belt around the polar vortex. Its temperature inside the collar is about 30 degrees colder than outside at the same altitude (Piccioni et al., 2007) that may be caused by an adiabatic cooling of upwelling air.
The superposition of zonal rotation and meridional advection leads to the formation of a giant vortex at each of the poles, where air is rotating downwards with a period of 2.8 terrestrial days. The northern polar vortex was studied by Pioneer Venus and the southern one by means of VMC and VIRTIS instruments on board Venus Express (Piccioni et al., 2007). The vortices are similar in nature to a tropical cyclone on Earth (Limaye et al., 2009) and have a complex structure. On average, it is the dipole (Schofield and Diner, 1983) but the shape can be an ellipsoid to a tripodal structure (Sánchez-Lavega et al., 2017). However, a full description of the vortex dynamics is still to be established by global circulation models.
The wind speeds of zonal rotation decrease from 70 km to ∼85 km (Piccialli et al. 2012), but their variation increase (Sánchez-Lavega et al., 2017). At the altitudes nearing the mesosphere boundary (110 km) the SSAS circulation dominates. SSAS transfers air masses from the subsolar to the anti-solar point, as a result of the significant contrast between day and night temperatures in the thermosphere and the cryosphere. Its speed reaches 100-300 m/s (Sánchez-Lavega et al., 2017). The details of atmospheric motion in the transition from the range between zonal superrotation in the lower layers of the mesosphere have not been established yet.
The SSAS circulation transfers different atoms and ions to the night side produced by photolysis in the dayside. Several airglows are the products of this dynamic process as a result of the downwelling atoms motions of airmasses leading to excited state molecular recombination in the night-time mesosphere.