Department of Physics
University of Fribourg (Switzerland)
Investigation of surface nanostructures with
grazing angle x-ray fluorescence techniques
THESIS
presented to the Faculty of Science of the University of Fribourg (Switzerland) in consideration for the award of the academic grade of Doctor rerum naturalium
by
Stanisław H. Nowak
from Kielce, Poland
Prof. Dr. Philipp Aebi, University of Fribourg (President of the jury) Prof. Dr. Jean-Claude Dousse, University of Fribourg (Thesis Supervisor) Dr. hab. Joanna Hoszowska, University of Fribourg (Expert)
Prof. Dr. Marek Pajek, Jan Kochanowski University (External expert)
Fribourg, 6th December 2012.
Thesis supervisor Dean
To Piotr Kosztołowicz, to whom I owe my fascination with science
Contents
Contents . . . 5
Summary . . . 9
Résumé. . . 11
I
Introduction
13
I-1 Total reflection of x-rays . . . 15I-2 X-ray fluorescence techniques related to the total reflection of x-rays . . . 16
I-2.1 Total reflection x-ray fluorescence . . . 16
I-2.2 Grazing incidence x-ray fluorescence . . . 17
I-2.3 Grazing emission x-ray fluorescence. . . 18
I-3 GIXRF and GEXRF application for nanostructures characterisa-tion . . . 19
I-3.1 Angular profiles of surfaces containing individual par-ticles. . . 20
I-3.2 Angular profiles of dense particles’ distributions. . . 20
I-3.2.1 Nevot-Croce model . . . 21
I-3.2.2 Stack of layers of various density model . 21 I-3.2.3 Linear combination of angular profiles. . 22
I-3.2.4 Limitations of the models. . . 22
I-3.3 Periodic structures . . . 23
I-3.3.1 Grating-like substrates. . . 23
I-3.3.2 Multiple reflections in periodic structures 23
II
Experimental
25
II.A GEXRF measurements . . . 27II.A-1 Von Hamos spectrometer . . . 27
II.A-1.1 Spectrometer chamber . . . 28
II.A-1.2 Construction details and motorisation . . . 29
II.A-1.3 Bragg crystals . . . 31
II.A-2 Target holders . . . 32
II.A-2.1 Carrousel target holder. . . 32
II.A-2.2 Piezo target holder . . . 33
II.A-2.2.1 Design . . . 33
II.A-2.2.2 Spatial constraints . . . 34
II.A-2.2.3 Target mounting . . . 35
II.A-3 ESRF measurements . . . 35
II.A-3.1 ID21 beamline overview . . . 36
II.A-3.2 MI-975 experiment . . . 37
II.A-3.3 MI-1108 experiment . . . 38
II.A-4 SLS measurements. . . 38
II.A-4.1 SuperXAS beamline overview . . . 38
II.A-4.2 Experiment . . . 40
II.B GIXRF measurements . . . 43
II.B-1 Beamlines . . . 43
II.B-1.1 Plane grating monochromator beamline . . . 43
II.B-1.2 Four-crystal monochromator beamline. . . 44
II.B-2 GIXRF setup. . . 45
II.B-2.1 Ultra-high vacuum x-ray spectrometry chamber . . . 45
II.B-2.2 6-axis manipulator ultra-high vacuum chamber . . . 46
II.B-3 Reference-free analysis . . . 47
II.C Samples . . . 49
II.C-1 Evenly distributed structures . . . 49
II.C-1.1 Fe, Cr and MgO thermal evaporated structures . . . 49
II.C-1.2 NaCl nanostructures . . . 51
II.C-2 Periodic structures. . . 52
II.C-2.1 Cr pads. . . 52
II.C-2.2 Cr stripes . . . 52
II.C-2.3 Cr trapezoidal prisms . . . 53
II.C-2.4 Disk patterns made of one and two superposed 3d el-ements . . . 53
II.C-2.5 Samples with plane symmetries . . . 54
III
Data analysis and data processing
59
III.A CCD events analysis . . . 61III.A-1 Currently used algorithm . . . 61
III.A-2 New algorithm . . . 63
III.A-3 Energy window . . . 65
III.A-4 Background consideration . . . 66
Contents
III.B CCD image correction in the von Hamos geometry . . . 71
III.B-1 Image properties in the von Hamos geometry . . . 71
III.B-2 GEXRF related properties . . . 72
III.B-3 Applying corrections to a CCD image . . . 73
III.B-4 Calculations of images . . . 73
III.B-5 Angular resolution. . . 75
III.B-5.1 Darwin width . . . 75
III.B-5.2 Size of the fluorescence source . . . 76
III.B-5.2.1 Horizontal dimension . . . 76
III.B-5.2.2 Vertical dimension . . . 76
III.B-5.2.3 Physical source dimensions . . . 76
III.B-5.3 CCD pixel dimensions . . . 77
III.C Geometrical optics approach to GEXRF and GIXRF . . . 79
III.C-1 Standing waves . . . 79
III.C-2 Intermediate morphology . . . 80
III.C-3 Ray tracing . . . 80
III.C-3.1 Roughness model . . . 81
III.C-3.2 Reverse ray tracing algorithm . . . 82
III.C-3.3 Optical paths coherence . . . 85
III.C-3.4 Multi structures . . . 85
III.D Effective flux of incidence radiation . . . 87
III.D-1 Effective flux calculation . . . 87
III.D-2 GEXRF and GIXRF comparison . . . 88
III.D-3 Buried structures . . . 89
IV
Results and Discussion
91
IV.A Periodic structures. . . 93IV.A-1 Cr pads . . . 93
IV.A-1.1 XSW simulation . . . 94
IV.A-1.2 GO simulations. . . 95
IV.A-2 Cr stripes . . . 95
IV.A-2.1 XSW field calculations. . . 97
IV.A-2.2 GO calculations . . . 98
IV.A-2.3 Intensity modulation . . . 98
IV.A-2.4 Effective flux correction . . . 100
IV.A-3 Cr trapezoidal prisms . . . 101
IV.A-3.1 GO ray tracing simulations . . . 102
IV.A-4 Samples with plane symmetries. . . 104
IV.A-4.1 Cr disc samples. . . 104
IV.A-4.2 Co/Ni discs sample . . . 104
IV.B Evenly distributed structures . . . 107
IV.B-1 NaCl nanostructures . . . 107
IV.B-2 Fe and Cr layers of various roughnesses . . . 108
IV.B-2.1 Application of sample morphology models . . . 109
IV.C Remarks on experimental difficulties. . . 115
IV.C-1 Exit angle calibration . . . 115
IV.C-1.1 Calibration from the spectrometer corrections. . . . 115
IV.C-1.2 Calibration to the support material. . . 116
IV.C-1.3 Calibration to the reference structure . . . 116
IV.C-1.4 Calibration with the spectral background . . . 116
IV.C-2 Background extraction . . . 117
IV.C-3 Synchrotron radiation beam instabilities . . . 118
IV.C-3.1 Beam spot position . . . 119
V
Concluding remarks
121
V-1 Grazing angle x-ray fluorescence from surface nanostructures . . 123V-2 GO ray tracing . . . 123
V-3 Perspectives . . . 124
V-3.1 XRF quantification model . . . 124
V-3.2 Single shot GEXRF measurements . . . 125
V-3.3 Grazing emission x-ray absorption spectroscopy . . . 125
Glossary . . . 127 List of Figures. . . 131 List of Tables . . . 133 Bibliography . . . 135
Appendices
141
MATLAB functions . . . 143 A vonHamosSpot function . . . 145 B spe_read function . . . 151 C choose_files function . . . 153 D GEXRF_island function . . . 155 MATLAB tutorials . . . 159E Spectrometer parameters correction . . . 161
F GEXRF profile creation . . . 169
Acknowledgments . . . 179
Summary
The present Ph.D. thesis was realized in the Atomic and X-Ray Physics (AXP) re-search group of Prof. Jean-Claude Dousse at the Physics Department of the University of Fribourg. It is devoted to the development of high-resolution X-Ray Fluorescence (XRF) methods at grazing angles, namely the Grazing Emission (GEXRF) and Graz-ing Incidence (GIXRF) X-Ray Fluorescence methods. These grazing angle techniques probe a sample in the near surface area and allow to perform trace-element analysis, surface contamination control, depth profiling of buried impurities or implanted ions, structure determination of layers and interfaces, and characterization of on-surface par-ticles. A particular aim of this thesis was to establish the relations between the surface morphology and fluorescence intensity of a sample in the regimes of grazing emission and grazing incidence.
Most measurements were performed at synchrotron radiation facilities, namely at the European Synchrotron Radiation Facility (ESRF), in Grenoble, France, at the Swiss Light Source (SLS), atPSI, in Villigen, Switzerland, and at the Electron Storage Ring BESSY II, in Berlin, Germany. The GEXRFprojects were carried out using the von Hamos bent crystal spectrometer of Fribourg, whereas the GIXRF measurements were performed with the ultra-high vacuum x-ray spectrometry chamber and the 6-axis ultra-high vacuum manipulator of the Physikalish-Technische Bundesanstalt (PTB).
The thesis is organized as follows:
In Chapter I the basic concepts concerning the grazing angle XRF methods and their applications for nanostructures’ characterisation are presented together with an outlook of the related literature.
InChapter IIthe experiments carried out for this study are described in detail. In particular, the instruments used to perform theGEXRFandGIXRFmeasurements as
well as the different synchrotron radiation beamlines where these measurements took place are presented. The investigated samples and the methods used to prepare them are also discussed in this part.
Chapter IIIis devoted to the data analysis and data processing methods. In order to interpret correctly the measured GEXRF spectra, new software packages were de-veloped. They are presented in this chapter while a more detailed description of them is given in the Appendices, at the end of the thesis. First, a new algorithm for the analysis of CCD single and multiple hit events is discussed. The problems related to the correction of theCCDimages in the von Hamos geometry are then addressed with a special focus on the properties of images collected in the grazing emission arrange-ment. A novel analytical method based on Geometrical Optics (GO) for simulation of the XRF angular profiles of nanostructures and nanoparticles densely distributed on flat substrates is also presented. Finally the influence of the grazing incidence geometry on the effective flux of the exciting radiation for particulate media is described.
Chapter IV presents the experimental results obtained for sample of various mor-phologies characterized by periodic and evenly distributed structures. The characteris-tic spectral features and trends of the measured GEXRFand GIXRF angular profiles are described and discussed. The experimental results are compared to the theoreti-cal predictions from the GO model and to the values obtained from X-ray Standing Wave (XSW) simulations. At the end of this chapter, the experimental difficulties encountered during the different projects are discussed.
InChapter Vconclusions about the most significant aspects of the thesis are drawn. Future perspectives concerning possible applications of the described x-ray grazing angle techniques and developed data analysis methods are outlined.
Résumé
La présente thèse de doctorat a été réalisée au Département de Physique de l’Université de Fribourg dans le groupe de recherche « Atomic and X-Ray Physics » (AXP) du Prof. Jean-Claude Dousse. Elle est consacrée au développement de méthodes d’analyse basées sur la fluorescence X en haute-résolution et à angles rasants, plus spécifiquement la fluorescence X à émission rasante (GEXRF) et la fluorescence X à incidence rasante (GIXRF). Ces méthodes d’analyse à angles rasants permettent de sonder la surface d’échantillons ainsi que la région proche de la surface pour en extraire des informa-tions comme la présence d’éléments-traces et la contamination de surface, la distribu-tion en profondeur d’impuretés ou d’ions implantés, la structure de couches minces et d’interfaces et la caractérisation de particules déposées à la surface de substrats plats. Un objectif spécifique de cette étude était de déterminer comment l’intensité de flu-orescence dépendait de la morphologie de la surface de l’échantillon pour les cas de l’émission rasante et de l’incidence rasante.
La plupart des mesures présentées dans la thèse ont été effectuées auprès de sources de rayonnement synchrotronique comme l’Installation européenne de rayonnement syn-chrotron (ESRF) à Grenoble, France, la Source de lumière suisse (SLS) de l’Institut Paul Scherrer à Villigen, Suisse et l’Anneau de stockage d’électrons BESSY II à Berlin, Allemagne. Les mesures GEXRF ont été réalisées à l’aide du spectromètre à cristal courbé von Hamos de Fribourg tandis que les mesures GIXRF ont été effectuées en utilisant la chambre ultravide de spectroscopie X et le manipulateur ultravide à 6 axes du « Physikalish-Technische Bundesanstalt » (PTB) de Berlin.
Le mémoire de thèse est articulé de la manière suivante :
Dans le Chapitre I, les fondements des méthodesXRFà angles rasants ainsi que leur application pour la caractérisation de nanostructures sont présentés avec un passage en revue de la littérature existante.
Dans le Chapitre II, les expériences réalisées sont décrites en détails avec, en partic-ulier, une présentation complète des lignes de faisceau sur lesquelles les mesures ont été effectuées ainsi que des instruments utilisés pour ces mesures. Les échantillons analysés et les méthodes utilisées pour la préparation de ces derniers sont également discutés dans ce chapitre.
Le Chapitre III concerne les méthodes utilisées pour l’analyse et le traitement des données. Pour pouvoir interpréter correctement les spectresGEXRF, de nouveaux logi-ciels ont dû être développés. Les programmes correspondants sont présentés dans ce chapitre, une description plus complète de ces derniers étant donnée dans les annexes. Tout d’abord un nouvel algorithme développé pour l’analyse d’événements correspon-dant à des impacts simple et multiple sur la caméra CCD est discuté. Ensuite sont abordés des problèmes concernant la correction des imagesCCDobtenues en géométrie von Hamos avec un accent principal sur le cas de l’émission rasante X. On trouvera également dans ce chapitre la présentation d’un nouveau modèle basé sur l’optique géométrique (GO) pour la simulation des spectres XRFangulaires de nanostructures et de distributions denses de nanoparticules déposées sur des substrats plats. Enfin, l’influence de la géométrie à incidence rasante sur le flux du faisceau de photons utilisé pour irradier l’échantillon est analysée pour le cas des matériaux granulaires.
Le Chapitre IV présente les résultats obtenus pour des échantillons ayant des mor-phologies de surface correspondant à des distributions soit uniformes soit périodiques de structures de diverses formes et faites d’éléments différents. Les caractéristiques spectrales des profils angulaires GEXRF et GIXRF de ces échantillons sont présen-tées et commenprésen-tées. Les résultats expérimentaux sont comparés aux valeurs théoriques obtenues à partir du nouveau modèle géométrique (GO) et du modèle des champs d’ondes stationnaires X (XSW). Le chapitre se termine avec un inventaire des princi-pales difficultés expérimentales rencontrées durant la réalisation des différents projets.
Les conclusions principales du travail sont énoncées dans le Chapitre V. Une discus-sion sur les possibilités d’application des techniques de spectroscopie X à angles rasants et des méthodes d’analyse développées dans la thèse clôt ce dernier chapitre.
Chapter I
I Introduction
I-1
Total reflection of x-rays
Total reflection of electromagnetic waves passing from a material with a higher re-fractive index to a material with a lower rere-fractive index is a well known physical phenomenon. In the x-ray regime such an effect is also observed and was described by Compton already in 1923 [1].
In the x-ray regime the refractive index 𝑛 is given by the following formula:
𝑛 = 1− 𝛿 + 𝑖𝛽. (I.1)
The real part of the refraction index 1− 𝛿 is determined by the so called decrement 𝛿 which is related to the radiation dispersion and is given by:
𝛿 = 𝑁𝐴 2𝜋𝑟0𝜆 2𝜌∑︁ 𝑗 𝑛𝑗𝑍𝑗 𝐴𝑗 , (I.2)
where 𝑁𝐴 is the Avogadro number, 𝑟0 the classical electron radius, 𝜆 the wavelength of the incoming x-ray radiation, 𝜌 the density of the material and 𝑛𝑗, 𝑍𝑗 and 𝐴𝑗 the molar fraction, atomic number and atomic mass of the 𝑗𝑡ℎ element of the material, respectively. The imaginary component 𝛽 is a measure of the radiation attenuation in the material:
𝛽 = 1
4𝜋𝜇𝜆, (I.3)
where 𝜇 is the linear mass absorption coefficient. The coefficients 𝛿 and 𝛽 are both positive, and in the x-ray regime they are in the order of ∼10−6.
More precisely the refractive index can be calculated directly from the scattering factors 𝑓1 and 𝑓2 [2,3]: 𝑛 = 1− 𝑁𝐴 2𝜋𝑟0𝜆 2𝜌∑︁ 𝑗 𝑛𝑗(𝑓1𝑗− 𝑖𝑓2𝑗) 𝐴𝑗 . (I.4)
Comparing above equation with (I.2) and (I.3) the following relations can be deduced:
𝑓1𝑗 = 𝑍𝑗, (I.5) and: 𝜇 = 2𝑁𝐴𝑟0𝜆𝜌 ∑︁ 𝑗 𝑛𝑗𝑓2𝑗 𝐴𝑗 (I.6)
Actually, since 𝑓1𝑗 is defined as the ratio of the amplitude of the wave scattered by the 𝑗𝑡ℎ atom with respect to the one scattered by a single electron, 𝑍𝑗 corresponds to the maximum value of 𝑓1𝑗. According to Snell’s law the total reflection of a radiation passing from a material with refractive index 𝑛1 to a material with refractive index 𝑛2
occurs for the glancing angles1 smaller than the critical angle 𝜙𝑐:
𝜙𝑐= arccos 𝑛2 𝑛1
. (I.7)
The above equation entails the following condition on the refractive indexes:
𝑛2 < 𝑛1. (I.8)
Thus, in the x-ray regime whereℜ𝑛 < 1, the total reflection occurs in vacuum resulting in the so called total external reflection phenomena.
We should note, however, that even at total reflection conditions the evanescent radiation penetrates the near interface area of the material with lower refractive index. This is due to the electromagnetic field continuity condition.
Because for x-rays the refractive index is close to one, the critical angles are very small – usually not bigger than 1∘.
I-2
X-ray fluorescence techniques related to the total
re-flection of x-rays
I-2.1 Total reflection x-ray fluorescence
In theTotal-reflection X-Ray Fluorescence (TXRF)[4] technique the reflected radiation is used as an excitation probe that excites the sample only in the region above the surface and several nanometers below. The resulting fluorescence radiation is measured by a detector positioned on the top of the sample surface.
As allX-Ray Fluorescence (XRF) methods [5] the TXRF is also a nondestructive and element sensitive (and to some extent chemical sensitive) method. Additionally the method profits from a substantial decrease of the spectral background signal originating from the substrate material.
The TXRF method is mainly used for micro- and trace-element analysis of evap-orated solvents, aerosols and powders. Another common application is the surface contamination control. The detection limits are in the order of picogram to femtogram if pre-concentration methods are applied.
A detailed description of the TXRF method can be found in Klockenkämper’s monograph [4] and in several review papers (see, e.g., [6,7]).
1Note that here the angle of reflection is defined as a glancing angle, i.e., the angle between
the radiation direction and the sample surface. This is a common convention in grazing angle x-ray techniques.
I Introduction
Figure I.1: Calculated penetration depth (solid line) and reflectivity (dashed line) for Mo 𝐾𝛼 x-ray radiation impinging on silicon. The critical angle is 1.8 mrad. [8]
The Grazing Incidence X-Ray Fluorescence (GIXRF) technique, called alsoAngle Dependent X-Ray Fluorescence (ADXRF) is an extension of TXRF where the x-ray fluorescence is measured as a function of the incidence angle2.
I-2.2 Grazing incidence x-ray fluorescence
By varying the glancing angle continuously at very small angles the access to the sample structure in near surface area below the interface can be obtained. Figure I.1shows the penetration depth change when the incidence angle is varied. For incident angles below the critical angle, only the first few nanometers in the depth direction are reached by the incident radiation. Farther from the surface the x-rays are attenuated due to their evanescence character. For incident angles larger than the critical angle, the sample becomes sensitive to x-rays penetrating deeper into the sample. In this angular range the accessible depth region is limited by the material absorption coefficient for the incident x-rays.
The interference of the incident and reflected x-rays is another phenomenon that affects the GIXRF intensity. Also the interference pattern changes with the incident angle.
In addition toTXRFapplicationsGIXRFis also employed for nondestructive depth profiling [9], structure determination of layers and interfaces, and for the characterisa-tion of surface particles.
More information on GIXRFcan be found in [4,6–8].
2Here we should clarify the mismatch nomenclature found in the literature. Both TXRF and
GIXRF are referenced as a general name for all x-ray fluorescence techniques employing the grazing incidence of x-ray radiation. However,TXRFis more often used when fixed angles of incidence below the critical angle are employed. GIXRF in turn applies to measurements where the fluorescence intensity is measured as a function of the incidence angle which is varied around the critical angle. Synchrotron-radiation basedGIXRFis also addressed asX-ray Standing Wave (XSW)technique.
Figure I.2: Comparison of the GIXRF and GEXRF geometries. 1. incident beam, 2. sample, 3. detected fluorescent radiation, 4. detector, 5. reflected beam. In the
GIXRF setup the incident x-ray radiation is collimated and the angle of incidence is tunable; the fluorescent radiation is detected perpendicularly to the sample surface within a large solid angle. In the GEXRF setup the fluorescent radiation is detected within a small solid angle and the angle of detection is tunable while the beam incidence angle is large, e.g., 90∘. In the case of GEXRFthe excitation can be produced by any kind of ionizing radiation (x-ray radiation, electron beam, ion beam).
I-2.3 Grazing emission x-ray fluorescence
The operational principle of theGrazing Emission X-Ray Fluorescence (GEXRF) tech-nique [10–13] consists in measuring the intensity evolution of an excited x-ray fluores-cence line around its critical angle of total reflection. GEXRF can be regarded as a time-reversed TXRF or GIXRF experiment where the x-ray emitter and detector are exchanged (seeFigure I.2). Thus in behalf of the reciprocity theorem [14] theGEXRF
theoretical description can be based on derivations made forTXRFandGIXRF[10,15]. However, more formal approaches employing the Maxwell’s equations [12,13] and field expansion in plane waves [16,17] can be found in the literature.
Thereupon the angular evolution of GEXRF is equivalent to that of GIXRF. For exit angles below the critical angle, only the first few nanometers in the depth di-rection contribute to the measured fluorescence intensity, the x-rays emitted far from the surface vanishing due to their evanescence. For exit angles larger than the criti-cal angle, the x-ray fluorescence detection setup becomes sensitive to x-rays emitted deeper inside the sample. In the latter case the accessible depth region is limited by the self-absorption of the fluorescence x-rays.
The GEXRF setup allows the use of wavelength-dispersive instruments for the detection of the fluorescence radiation [18–20]. This provides a much higher spectral resolution and thus a better separation of the fluorescence lines, which is of prime importance for light elements (from 𝑍 > 4). A further advantage of theGEXRFsetup is the possibility of performing microanalysis and surface mapping, provided a sufficiently intense focused X-ray source is available [20]. Its main drawback resides in the lack of flexibility for the choice of the critical angle 𝜙𝑐 for total reflection. As the latter depends on the photon energy, in the GIXRF method 𝜙𝑐 can be varied continuously
I Introduction
Figure I.3: Three types ofGEXRFangular profiles for bulk-like, layer-like and particle-like structures. The critical angle positions correspond to the inflection points of the profiles. As shown in the middle panel, some information about the sample structure can be extracted straightforwardly from the measured profile: the critical angle position is indeed related to the optical density of the material, the distance between neighbour interference fringes correspond to the layer thickness, and the fluorescence intensity for 𝜙 ≫ 𝜙𝑐 is proportional to the total amount of fluorescent atoms. GIXRF profiles present similar features.
by tuning the energy of the incoming beam. This is, however, not possible with the
GEXRFtechnique since in this case the critical angles are determined by the energies of the fluorescence lines of the investigated element.
A detailed description of theGEXRF method and of possible applications can be found in the following review papers [6,13,21,22].
I-3
GIXRF and GEXRF application for nanostructures
characterisation
The GIXRF and GEXRF as its reciprocal method are well known for their utility in surface analysis [4–7,13,21,22]. As stated before they serve as very sensitive tools for trace element analysis [19, 20], thin layers’ characterisation [23] and non-destructive depth profiling of implanted impurities [9, 24]. Their usefulness for nanoparticles’ characterisation has also been proven [16,17,25–29].
Depending on the sample’s morphology three well described types ofGEXRFand
GIXRF angular profiles are distinguished [11,12]: bulk-like, layer-like and particle-like (see Figure I.3). For the bulk structure the emitted radiation is refracted once at the vacuum-bulk interface and the evolution of GEXRFfollows approximately the inverse of the reflection coefficient of the bulk material. For the layer-like structure, for angles
slightly above the critical angle, an interference pattern in the detected fluorescence can be observed that results from the multiple reflections on the top and bottom interfaces of the layer [15]. For particle-like structures the detected x-rays result from the direct and singly reflected radiation. Thereby the radiation intensity is doubled below the critical angle of the support material.
I-3.1 Angular profiles of surfaces containing individual particles
The angular profiles of surfaces containing individual particles have been studied both theoretically [17, 27] and experimentally [25–27]. In [17] the GEXRF angular profiles of small particles located on a flat support were analyzed theoretically. In [27] similar theoretical investigations were performed for the case of GIXRF with the use of the
XSW simulations. In addition to the particle shape also the particle size distribution and the x-ray coherence length were taken into account.
In both papers [17, 27] the appearing interference pattern was shown to contain valuable information about the particle structure and composition. However, as shown in [27] the nonuniform particle size distribution and the limited coherence length sig-nificantly reduce the interferences.
The experimental results reported in [25–27] confirm the theoretical predictions, demonstrating the utility of the method but also its ambiguity with respect to the interpretation of the data.
I-3.2 Angular profiles of dense particles’ distributions
The angular profiles of the x-ray fluorescence emitted by surfaces characterized by dense particles’ distributions are still not fully understood. Such structures can be considered as transition structures from particle-like to layer-like structures. In the literature they are usually treated as rough layer-like surfaces, the roughness being introduced as:
∙ a small perturbation of the interface potential within the Nevot-Croce model, ∙ a stack of layers with reduced average densities, or
∙ a composition of layers of different thicknesses.
A slightly different approach was presented in [30] where, in order to calculate the influence of the absorption effects, the sample surface was considered to be made of a series small towers of variable height and width. Yet, as stated by the authors, at the current stage of the simulations the results are still not satisfying.
I Introduction
I-3.2.1 Nevot-Croce model
Very dense particles’ distributions can be regarded as rough layers, the surface and in-terfacial roughness being quantitatively described with the Nevot-Croce model [31–34]. In this theoretical model the effect of the roughness is calculated using the distorted-wave Born approximation in which the roughness is considered as a small perturbation of an electromagnetic potential with a Gaussian random distribution along the inter-face.
In the Nevot-Croce model, as compared to a smooth surface, both the reflectivity 𝑟 and transmission 𝑡 coefficients are modified as follows:
˜ 𝑡 = 𝑡· exp(︃ −(𝑘𝑦− 𝑘 ′ 𝑦)2 2 𝜎 2 ℎ )︃ , (I.9) ˜ 𝑟 = 𝑟· exp(︀−𝑘2𝑦𝜎2ℎ)︀ , (I.10) where 𝑘𝑦 and 𝑘′𝑦 correspond to the incident and refracted wave vectors’ components perpendicular to the sample surface, respectively, and 𝜎ℎ2is the variance of the Gaussian distribution of the potential.
The relations (I.9) and (I.10) are valid up to 𝑂(𝑘𝑦𝜎ℎ). Thus they can be used for small roughnesses fulfilling the condition:
𝑘𝑦𝜎ℎ ≪ 1 (I.11)
Calculations with the Nevot-Croce model up to 𝑂(𝑘𝑦2𝜎ℎ2) and their application to
GIXRF were performed by de Boer [35–37]. The resulting formulas depend on therms
value of the interface roughness 𝜎ℎ, its lateral correlation length 𝜉 and its degree of perpendicular correlation, as well as on the degree of jaggedness. The results are valid for 𝑘𝑦𝜎ℎ≪ 1 and 𝜉𝑘2𝑦/ ⃒ ⃒ ⃒⃗𝑘 ⃒ ⃒ ⃒ ≪1 or 𝜉𝑘 2 𝑦/ ⃒ ⃒ ⃒⃗𝑘 ⃒ ⃒ ⃒ ≫1.
The distorted wave Born approximation has been explicitly applied to dense dis-tributions of islands on surfaces taking into account the correlation between particles’ size and spacing in Ref. [38, 39]. However only the x-ray scattering was considered without direct links toGIXRF.
The Nevot-Croce formalism is commonly used for roughness compliance inGIXRF
calculations [40]. However, the model is likely to fail for large rms values of the in-terfacial roughness. In general it is not suitable for grainy structures with separated components.
I-3.2.2 Stack of layers of various density model
The grainy region can be described as a transition layer in which the refractive index varies continuously with the depth [33, 41]. The interface can be then divided into
Figure I.4: Illustration of the stack of layers of various density model. The roughness is described by a stack of virtual layers with increasing density from zero to bulk. [41]
elementary layers in which the refractive index depends on the roughness distribution (see Figure I.4). In the most crude variant of this method the whole grainy region is approximated with a single layer of a low optical density [28].
In this model the structure height correlations and the local variation of the interface slope are not considered.
I-3.2.3 Linear combination of angular profiles
If the correlation length 𝜉 of the height distribution is large enough, the resulting angular profile can be approximated by the sum of the profiles corresponding to layers of various thicknesses. The method was proved to give good results when applied to large islands [19,42]. In [43] the method was applied to both particle-like and layer-like profiles.
A limitation of the method resides in the assumption that the different parts of the structure do not interact with each other.
I-3.2.4 Limitations of the models
While being certainly useful, the mentioned models employed for dense particles’ dis-tributions are too simple and do not cover phenomena such as highly correlated height distributions and large roughnesses [37], nor the propagation of the x-ray radiation through several particles [44].
However, a correct interpretation of these intermediate profiles would be of high im-portance, in particular for nanostructures’ investigations and forTXRFmeasurements of droplets where the quantification problem is one of the main issues.
I Introduction
I-3.3 Periodic structures
Periodic structures might represent a further model for the description of particle-layer transition structures. With the structuration techniques available today almost any arbitrary structure can be produced. Thus the effects of the pattern size, distance and surface coverage can be examined an then simulated with relatively simple models.
I-3.3.1 Grating-like substrates
The use of periodic substrates for GIXRFinvestigations has been reported by Tsuji et al. in [44]. In comparison to smooth surfaces a clear peak of fluorescence intensity was observed in the angular profile near the critical angle.
A theoretical description of theGEXRFwith a grating-like substrate was presented in [16]. As a result of the diffraction on the surface grating, distinct peaks were predicted to appear in the x-ray signal angular dependence. The magnitude of the latter can exceed several times the value of the x-ray intensity obtained with the use of a flat substrate under the same conditions of excitation.
The angular peaks positions 𝜙𝑀 can be approximated by:
cos 𝜙𝑀 = 𝑀 𝜆
𝑝, 𝑀 ∈ N (I.12)
where 𝜆 is the wavelength of the fluorescence x-rays, and 𝑝 is the period of the grating structure. Because the x-ray wavelengths are very small the above equation implies that the diffraction peaks are only visible for soft x-rays and very dense (𝑝 < 1 𝜇m) gratings.
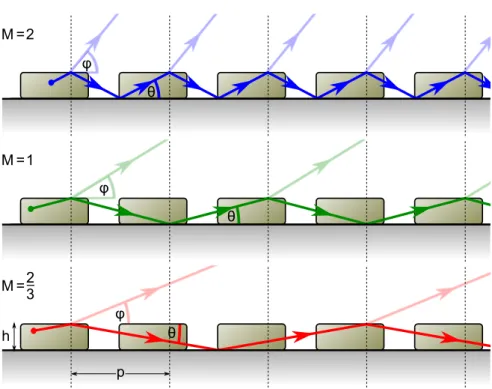
I-3.3.2 Multiple reflections in periodic structures
As for layer structures, x-rays can be reflected many times by a periodic structure. This means that the x-ray path consists of multiple reflections and the single radiation that leaves the structure is the radiation refracted at the top interface.
Such a situation can happen if the distance between the consecutive reflections on the top or bottom interfaces of the structure is a fraction or a multiple of the structure period (seeFigure I.5). Provided that the ray path is not refracted at the side interfaces of the structure, this condition can be written as follows:
tan 𝜃𝑀 = 𝑀 ℎ
𝑝, 𝑀 ∈ Q+ (I.13)
where ℎ and 𝑝 are the height and period of the structure, respectively, and 𝜃 is the angle between the x-ray path and the direction parallel to the interface. If the radiation exits
θ φ _ =2 M θ φ M N=1 _ M 2 3 M N= _ _ φ θ M p h
Figure I.5: Multiple reflections in a periodic structure. The period of the structure is indicated with dashed lines.
the sample by a side flank of the structure, 𝜃 can be approximated with the grazing angle 𝜙, whereas if it exits the structure at the top interface 𝜃 is given by:
𝜃 = arccoscos 𝜙
𝑛 , (I.14)
where 𝑛 is the refraction index of the material.
In the periodic case the distance between the resultingXRF angular profile struc-tures does not depend on the wavelength of the x-ray radiation.
Chapter II
II.A
GEXRF measurements
The presented GEXRFmeasurements were performed by means of the high-resolution von Hamos curved crystal x-ray spectrometer of the University of Fribourg [45]. In order to realise the synchrotron radiation based high-resolution GEXRF measurements the spectrometer was transported to theEuropean Synchrotron Radiation Facility (ESRF)
in Grenoble, France (beam line ID21) and to theSwiss Light Source (SLS) in Villigen, Switzerland (SuperXAS beam line).
II.A-1
Von Hamos spectrometer
The von Hamos spectrometer consists mainly of three components (seeFigure II.A.1):
∙ an x-ray source,
∙ a cylindrically-curved Bragg crystal, and ∙ a position-sensitive x-ray detector.
In the von Hamos geometry the crystal is bent cylindrically around the x-axis which is parallel to the direction of dispersion and provides vertical focusing in the non-dispersive z-direction.
Figure II.A.2: Schematic view of the von Hamos spectrometer of Fribourg: (1) crystal, (2) CCD detector, (3) target holder, (4) x-ray tube, (5) vacuum pump and (6) beam ports.
The use of a wavelength-dispersive setup brings two main advantages: a high an-gular (and consequently energy) resolution (see Sub-chapter III.B on page 71) and a high background rejection.
Most of the background events produced in the sample have a different energy that the one of the fluorescence x-rays of interest. As a consequence, they are not diffracted by the crystal and are thus eliminated. Remaining background events are related to scattered photons, cosmic rays and electronic noise of the detector. Two algorithms for background subtraction are presented in Sub-chapter III.A on page61.
II.A-1.1 Spectrometer chamber
The spectrometer in enclosed in a 180× 60 × 24.5 cm3stainless steel chamber mounted on a mobile stand (seeFigure II.A.2). The chamber can be pumped to about 10−7mbar by a turbo-molecular pump and a two-stage rotary pump.
The chamber is equipped with four beam ports located in such a way that the direction of the incoming beam relative to the axis of crystal curvature equals 0∘, 30∘, 60∘ and 90∘. The ports allow the connection to a synchrotron or ion accelerator beam line or the installation of an electron gun or collimated x-ray source. Additionally the ports can be used as view-ports for the visual control of the experiment under vacuum or to mount feedthrough electrical connectors for additional remote-controlled devices inside the chamber.
II.A GEXRF measurements
Three circular ports on the top of the spectrometer chamber permit access for the target, crystal and detector replacement. An x-ray tube can be mounted in place of the circular port above the target system.
In order to reduce the background an Al-Cu-Pb shielding separates the target cham-ber of the spectrometer from the crystal and detector parts.
II.A-1.2 Construction details and motorisation
For a fixed position of the crystal and detector, a certain angular range and consequently a certain energy interval is covered by the spectrometer. The size of the energy interval which varies with the central Bragg angle is determined by the detector extension in the direction of dispersion. In order to provide a wider range of available Bragg angles the crystal and the detector can be moved along translation axes (labeled DET for the detector and CRY for the crystal) which are both parallel to the dispersion axis. This permits to vary the Bragg angles from 24.4∘to 61.1∘. When changing the central Bragg angle the source-to-crystal and crystal-to-detector distances are both varied but kept equal.
In order to correct for deviations of the crystal curvature from the nominal value of 25.4 cm, the crystal can also be moved along an axis labeled CRF which is coplanar and perpendicular to the crystal and detector translation axes.
In the regular operation mode the x-ray source is defined by a rectangular slit placed on the detector axis. The real x-ray fluorescence source is located behind the slit. For each Bragg angle, the fluorescence source should be positioned so that its center lies on the straight line passing through the slit and the crystal center. For this reason, the target holder can be translated along an horizontal axis, labeled TAF, which is perpendicular to the CRY and detector DET axes (seeFigure II.A.3). A rod connects the target holder carriage to the slit-rotation system and ensures an automatic alignment of the slit for any displacement of the target.
In addition the target holder can be moved along an axis, labeled TAT, parallel and coplanar to the CRY and DET axes and rotated around a vertical axis, labeled TAL, tangential to the surface of the fluorescence source and perpendicular to the plane determined by the CRY and DET axes.
All the above mentioned axes are equipped with remote-controlled step motors and their main characteristics can be found inTable II.A.1. An overview of the translation axes is also depicted in Figure II.A.4.
TAF axis
Figure II.A.3: Target-slit system of the von Hamos spectrometer (from [45]).
Figure II.A.4: Spectrometer chamber with indication of the motion axes.
element moved axis name parallel to step range crystal CRY 𝑥 5 𝜇m 12.5 – 67.0 cm CRF 𝑦 2.5 𝜇m 23.6 – 26.6 cm detector DET 𝑥 5 𝜇m 28 – 112 cm target TAF 𝑦 2.5 𝜇m 1.17 – 5.10 cm TAT 𝑥 2.5 𝜇m 2.13 – 2.94 cm TAL 𝑧 0.00225∘ -58.1 – 90.8∘*
*Angle between the TAF axis and the normal to the sample surface.
Table II.A.1: Step motors’ characteristics. The ranges of the translation axes are given relative to the slit position.
II.A GEXRF measurements
II.A-1.3 Bragg crystals
The spectrometer can be equipped with different crystals whose dimensions and charac-teristics are listed in Table II.A.2. For all crystals, the nominal radius of curvature 𝜌 is equal to 254 mm. For the measurements, the chosen crystal is mounted on a moveable carriage that can be translated along the CRY and CRF axes.
Crystal 𝑎× 𝑏 × 𝑐 [mm2] ℎ [mm] 2𝑑 [Å] Energy range [keV] TlAP (001) 80× 50 × 0.25 20.60 25.772 0.544 – 1.178 ADP (101) 100× 50 × 0.30 20.80 10.642 1.317 – 2.853 SiO2 (1¯10) 100× 50 × 0.15 20.55 8.5096 1.647 – 3.568 LiF (200) 99× 46 × 0.60 21.15 4.0280 3.480 – 7.538 Ge (220) 99× 50 × 0.20 20.30 4.0000 3.504 – 7.591 Si (220) 85× 50 × 0.25 20.30 3.8410 3.649 – 7.849 SiO2 (2¯23) 100× 50 × 0.40 21.00 2.7500 5.097 – 11.041 SiO2 (2¯23) 85× 50 × 0.30 20.40 2.7500 5.097 – 11.041 LiF (420) 80× 50 × 1.10 21.10 1.8010 7.782 – 16.859 a b c h
Table II.A.2: Crystals’ characteristics.
II.A-1.4 Detector
For the detection of the diffracted x-rays a two-dimensional back-illuminated Charge-Coupled Device (CCD) camera is used. A detailed description of the detector can be found in [46].
TheCCDis 2.68 cm long (in the dispersion direction) and 0.80 cm high and consists of 1340× 400 pixels, each pixel having a size of 20 × 20 𝜇m2. TheCCD chip is cooled down to −45∘ by a cold finger mounted on a water cooled two-stage Peltier element. The cooling limits the dark charge noise of the CCD.
For the read-out and digitalization of the CCD signal, a ST-133 controller from Roper Scientific is used. During the read-out and clean-out process theCCDis covered by a dedicated x-ray shutter made of stainless steel and Al. The data transfer rate of the ST-133 controller being 1 MHz, the time needed to read-out a full CCD image amounts to about 0.5 s, while the time for opening or closing the shutter is shorter than 0.2 s.
The use of a 2D detector permits to correct the images for the geometrical aber-rations related to the von Hamos geometry and to improve therefore the instrumental broadening of the spectrometer. In addition, the energy resolution capability of the
CCD detector itself permits to sort good x-ray events by filtering the2D-images with appropriate energy windows. This permits to strongly reduce the background and to
TAL axis 2 1 4 carrousel wheel rotation axis 1cm 3
Figure II.A.5: Schematic view of the carrousel target holder: (1) samples, (2) Al or Cu made carrousel, (3) aluminium support, (4) step motor.
suppress events due to higher orders of diffraction. These two aspects will be discussed in details in Sub-chapter III.A on page61 andSub-chapter III.B on page 71.
II.A-2
Target holders
For the GEXRFmeasurements a precise control of the sample surface orientation rel-ative to the direction of the exiting fluorescence x-rays is needed. This alignment is realized by rotating the sample around the vertical TAL axis. The latter is driven by a step motor through a one-stage worm gear-tooth wheel system. The sample rotation corresponding to one step of the motor amounts to 0.00225∘, i.e., about 39 𝜇rad.
For the measurements presented in this work two target holders were used that are described below.
II.A-2.1 Carrousel target holder
This revolver barrel-like target holder consists of a motorized carrousel on which up to four targets can be fixed simultaneously (seeFigure II.A.5). The samples are mounted on the back side (as seen from the incoming beam) of the carrousel wheel. This per-mits to keep the sample surface at the same position in the y-direction whatever the sample thickness is. The carrousel wheel can be rotated around a horizontal axis via a remote-controlled motor, which permits the change of the samples without opening the spectrometer chamber. This is an important asset when measurements are performed at synchrotron radiation facilities, about one hour of beam time being indeed lost each time the spectrometer chamber has to be opened.
II.A GEXRF measurements
TAL axis
1
3
5
6
8
2
4
piezo
translation axis
pie
zo
rot
ation axi
s
7
1cm
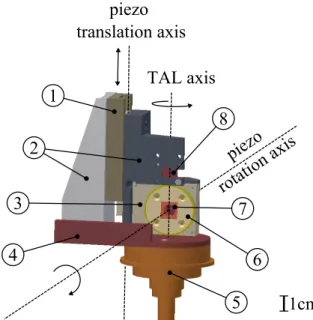
Figure II.A.6: Schematic view of the piezo target holder: (1) translation piezo motor SLC-2460-D-S, (2) aluminium supports, (3) rotary piezo motor SR-2812-S, (4) alu-minium base plate, (5) TAL axis motorized stage, (6) alualu-minium plate screwed on the rotor of the rotary motor, (7) sample, (8) fluorescence screen or 2𝑛𝑑 sample.
II.A-2.2 Piezo target holder
For the periodic structures’ measurements a dedicated target holder was fabricated that allows the rotation of the sample about an axis perpendicular to the sample surface and a vertical translation along an axis which is parallel to the TAL axis. It should be noted that the exit angle of the fluorescence x-rays is not changed by such a rotation, nor by the vertical translation and that, as a consequence, the Bragg condition is not affected by these sample movements.
II.A-2.2.1 Design
The piezo target holder is depicted in Figure II.A.6. It consists mainly of two piezo motors, one for the vertical translation and one for the rotation. The motors are mounted on aluminium custom machined supports. The whole assembly is fixed onto the motorized three-axes stage (described in Subsection II.A-1.2 on page 29) by two countersunk screws.
Piezo motors were chosen because of their compactness and positioning precision. The main characteristics of the two motors, which are both from the company SmarAct GmbH, are listed below:
– 35 mm course,
– 1 nm precision,
– enlarged blocking force;
∙ rotary positioner SR-2812-S – unlimited rotation,
– 2 𝜇∘ precision, – 8 mm aperture.
Both motors are Ultra-High Vacuum (UHV) compatible and are equipped with an optical positioning sensor. In order to enforce the vertical linear positioner a spring system compensating the weight of the mobile part had to be added later on in the vertical stage.
The piezo motors are steered by a modular control system (MCS) to which the motor are connected via two sensor modules. For the electrical connection between the piezo motors located in the spectrometer chamber and the sensors modules which are outside,High Vacuum (HV)feedthrough LEMO connectors mounted on an unemployed beam port are used. The MCS controller can be connected to a PC by means of an USB interface or controlled manually with an external joystick-like device.
II.A-2.2.2 Spatial constraints
As the overall dimensions of the piezo target holder are somewhat bigger than those of the carrousel target holder, the slit system had to be redesigned in order to enable the use of the spectrometer over the full Bragg angular range (24.4∘ - 61.1∘) or at least the widest possible part of it.
The new slit system is similar to the one presented inFigure II.A.3on page30but the slit width is no longer adjustable. This is, however, not dramatic because in the
GEXRFsetup the measurements are performed in the so called slit-less geometry [20] and in the latter geometry the slit is opened to its maximum aperture (about 2 mm).
Nevertheless, due to the enlarged dimensions of the piezo target holder the usable ranges of the TAT, TAF and TAL axes are diminished and, the following spatial constraints should be considered in addition to the limits quoted in Table II.A.1 on page30:
∙ TAL rotations should never exceed 20.25∘
∙ TAF and TAT positions should never be simultaneously closer to the slit than 1.375 cm and 2.5 cm, respectively.
II.A GEXRF measurements
Figure II.A.7: Mosaic photograph of an Al plate employed to fix the samples (here a Cr discs sample made with the Stencil technique, see Subsection II.C-2.4on page 53) on the rotor of the piezo motor. The thin Cr film was used for the alignment of the Cr discs patterns and the metallic Cr foil for the optimization of the acquisition parameters of the spectrometer.
II.A-2.2.3 Target mounting
The rotary piezo motor is fixed to the aluminium support so that the distance be-tween the front plane of the rotor and the TAL axis is 1.5 mm. The samples are glued (glue Electrodag 1415 from Agar Scientific Ltd) on dedicated aluminium plates (see
Figure II.A.7) which are screwed on the rotor of the piezo motor. For each sample the thickness of the aluminium plate is chosen so that the total thickness of the sample plus backing system is exactly 1.5 mm. As a consequence, the condition that the TAL axis should lie in the sample surface is automatically satisfied.
The use of an intermediate aluminium plate for the target mounting presents the additional advantage of preserving the position of the sample if later on the latter has to be put back on the target holder.
For the mounting of the second target (which can be replaced by a fluorescence screen), the sample is fixed on the rear side of the support (seeFigure II.A.6on page33) as in the case of the carrousel target holder.
II.A-3
ESRF measurements
Two experiments were performed at the ESRF, in Grenoble, France, both at the x-ray microscopy beamline ID21. During the first experiment (MI-975), samples with evenly distributed structures (see Section II.C-1 on page 49) were measured. The second experiment (MI-1108) was devoted to the investigation of samples with periodic structures (seeSection II.C-2on page52). A further objective of the second experiment was to probe the goodness of the theoretical predictions provided by the geometrical opticsGEXRF/GIXRF model (seeSub-chapter III.Con page 79).
II.A-3.1 ID21 beamline overview
The ESRF machine operates at an electron energy of 6 GeV and a maximum current of 200 mA. At the beamline ID21 monoenergetic photon beams with energies ranging from about 2 keV up to about 7.5 keV can be delivered to the users. Three different
Insertion Device (ID) can be used for the production of the primary photon beam, namely a linear undulator, a helical undulator and a linear wiggler. They are installed on a 4.8 m long low beta straight section of the storage ring. The horizontal and vertical
FWHM sizes of the photon source are 47 mm and 12 mm, respectively. The horizontal and vertical source divergences amount respectively to 82 mrad and 12 mrad at 7 keV and 85 mrad and 20 mrad at 2 keV.
Through the primary slits (aperture of 5× 12 mm2) the white beam produced by the insertion devices enters the lead shielded hutch and reaches the double mirror system used for the rejection of the higher energy photons resulting from theIDupper harmonics. Mirrors with Rh, Si and Ni coatings are available. The incident cut-off angle can be tuned from 5 mrad to 20 mrad. Downstream from the mirror system, lead shielding is no more necessary, the energy of the so-called pink beam being sufficiently low.
http://www.esrf.eu/UsersAndScience/Experiments/Imaging/ID21/Sxm/BeamlineOverview
II.A GEXRF measurements
The pink beam passes through a Bremsstrahlung stop and a collimator with a 5× 5 mm2 aperture and enters then into the optics cabin where it is further filtered and cleaned by several pre-focusing x-ray optics elements (beam steering multilayer, focusing mirrors, plane-grating monochromator).
At the entrance of the experimental cabin, a fixed exit double crystal monochroma-tor from Kohzu Precision Co. Ltd is installed which allows energy scans with negligibly small spatial deviations of the beam. The monochromator is equipped either with two Si (111) single crystals for measurements requiring a high energy resolution (rel-ative resolving power of 10−4) or a NiB4C multilayer optics for experiments requiring rather a high photon flux at a moderate energy resolution (relative resolving power of 10−3− 10−2).
In order to minimize the absorption of the produced x-rays, the beamline is operated at UHV upstream from the monochromator and at HV downstream, which allows a windowless connection of the von Hamos spectrometer to the beamline. For the present measurements no x-ray focusing optics was used and the von Hamos spectrometer was installed downstream from the Scanning X-ray Microscope (SXM) chamber to which it was connected with a 1.8 m long evacuated pipe.
II.A-3.2 MI-975 experiment
The experiment was carried out in early April 2009. The GEXRFangular profiles of Fe, Cr and MgO nanostructures thermally evaporated on Si substrates (see Subsec-tion II.C-1.1 on page 49) were measured using two different beamline setups:
1. In the first setup, the synchrotron radiation was produced by two undulators mounted in series. Upper-harmonics photons were rejected by means of a Ni coated mirror set at a cut-off angle of 7.5 mrad. The beam energy was tuned to 6.4 keV for the Cr measurements and to 7.2 keV for the Fe measurements by means of a double NiB4C multilayer monochromator. The resulting intensity on the samples was of the order of 2· 1013photons/s.
2. In the second setup (MgO and bulk Si measurements), an undulator was used and the upper-harmonics were suppressed with a Si coated mirror operated at a cut-off angle of 7.5 mrad. The beam energy was tuned to 2.3 keV and 2.9 keV, using the same multilayer monochromator as in the first setup. In this case, the beam intensity on the sample was about 3· 1012photons/s.
In order to reduce the wings of the spatial beam distribution a 1.5× 1.6 mm2 pin-hole was installed in theSXMchamber. TheGEXRFangular profiles were determined, using the K𝛼 x-ray lines of Fe, Cr, Si and Mg. For the Fe and Cr measurements, the von
Hamos spectrometer was equipped with a Ge (220) crystal, whereas for the MgO ones a TlAP (001) crystal was employed and the measurements were performed in second order of diffraction. For the calibration of the angular scale, the angular profile of the Si wafer of each sample was also measured, using an ADP (101) crystal.
II.A-3.3 MI-1108 experiment
During this experiment which took place in late November 2011, the GEXRFangular profiles of periodic nanostructures of chromium deposited on Si wafers were measured. Samples with different patterns (stripes, trapezoidal prisms, disks) were investigated (see Subsections II.C-2.2,II.C-2.3andII.C-2.4).
The beamline setup was similar to the one used in the first part of the experiment MI-975 (two undulators in series, Ni coated mirror, NiB4C multilayer monochromator) but, the beam energy was tuned to 6.48 keV and, instead of a pinhole, two slits with adjustable widths and perpendicular to each other were used to define the beam size. The latter varied between 0.05× 0.2 mm2 and 1.2× 1.2 mm2. For the biggest beam size, the intensity on the sample was 2.8· 1013photons/s.
TheGEXRFangular spectra of the periodic pattern samples were measured using the K𝛼 x-ray line of Cr. As in the previous experiment, for each sample the cali-bration of the angular scale was determined from the GEXRF angular profile of the corresponding Si wafer, using the Si K𝛼 x-ray line. For all measurements the von Hamos spectrometer was equipped with a SiO2 (1¯10) crystal, the Si K𝛼 x-ray line being observed in first order of diffraction, the K𝛼 x-ray line of Cr in second order.
II.A-4
SLS measurements
Our last experiment was carried out in mid March 2012 at theSLSSuperXAS beamline, in Villigen, Switzerland.
The SLS synchrotron facility is operated at an electron energy of 2.4 GeV and a current of 400 mA with a so-called top-up electron injection. In this mode the booster injects periodically electrons into the storage ring, keeping the intensity of the circu-lating electron beam constant. The top-up injection together with very small beam intensity losses ensures synchrotron radiation beams that are very stable in intensity and position.
II.A-4.1 SuperXAS beamline overview
SuperXAS is a beamline based on a 2.9 T bending magnet having a critical energy of 11.1 keV. The photon energy range available at the beamline spans from ∼4.5 keV to
II.A GEXRF measurements
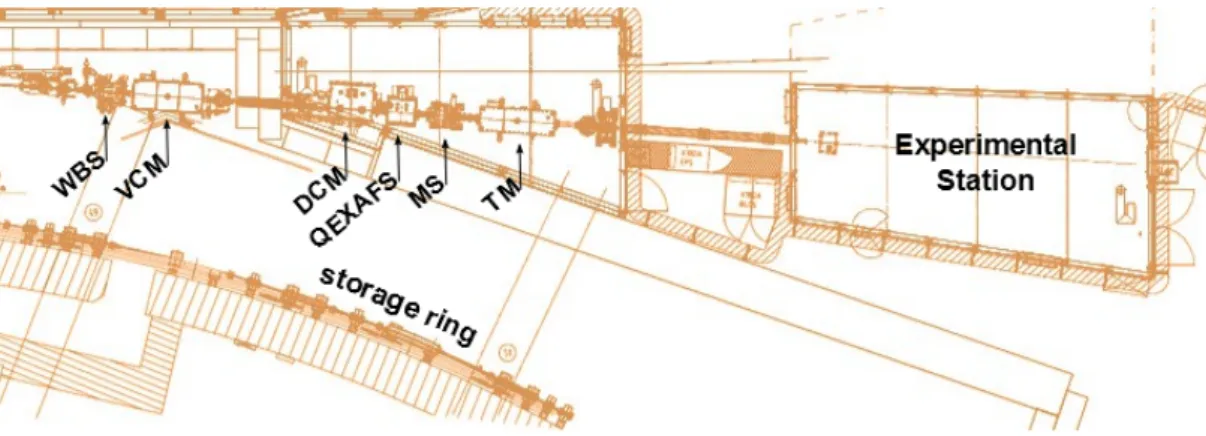
Figure II.A.9: Top view on the SuperXAS beamline: WBS – white beam slits, VCM – vertical collimating mirror, DCM – double crystal monochromator, QEXAFS – quick EXAFS monochromator, MS – monochromatic slits, TM – Toroidal Mirror.
∼35 keV. The horizontal and vertical FWHM sizes of the photon source are 53 𝜇m and 16 𝜇m, respectively, with divergences of 2 mrad in the vertical plane and 0.6 mrad in the horizontal one.
A schematic view of the superXAS beamline is presented in Figure II.A.9. As shown, the synchrotron radiation produced by the bending magnet passes first trough a graphite attenuator and a slit system (WBS) which define the intensity and dimensions of the so-called white beam. The latter is collimated in the vertical plane by a water cooled mirror (VCM) and monochromatized either by a double crystal monochromator (DCM) or, for fast scanning operation, by the quick EXAFS (QEXAFS) monochro-mator [47]. The Bremsstrahlung stopper serves to block the white and pink beams, while the secondary slits (MS) block the scattered beam and define the dimensions of the monochromatic beam which can be focused on the samples by means of a toroidal mirror (TM).
The substrates of the VCM and TM mirrors consist of 1100 mm long and 40 mm thick monocrystalline Si wafers which are 80 mm (VCM) and 70 mm (TM) wide. The optical active surfaces are made of Rh and Pt coatings with a Cr underlayer. In the case of the VCM mirror there is in addition a bare Si stripe between the Rh and Pt coatings. The Rh and Pt coatings and Si central stripe of the first mirror are 20 mm wide, while the width of the two coatings of the toroidal mirror amounts to 34 mm. The VCM mirror is bent cylindrically (radius of curvature adjustable from 4.5 km to 40 km) and the TM one is bent toroidally (bending radius from 3 km to 40 km). The mirror holders/benders are supported by massive granite blocks that are mechanically isolated from the vacuum chamber by means of edge-welded bellows. The mirrors can be remotely adjusted in five independent degrees of freedom (three rotations and two translations). The two translation stages allow to move the mirrors horizontally and
thus to change the coating between Pt and Rh (plus Si coating in the case of the VCM mirror).
The double crystal monochromator (DCM) consists of two Si (111) or Si (311) sin-gle crystals. The Si (111) crystals set is employed for the lower energy range (down to 4.5 keV) and the Si (311) one for the higher energies (up to 35 keV). The dimensions of the first crystal are 40× 70 × 10 mm3 and those of the second one 40× 170 × 30 mm3 (width× length × thickness). The exchange between the Si (111) and Si (311) crystal pairs can be done in vacuum by means of a remote-controlled linear stage. In or-der to withstand the thermal heat load the crystals are water cooled. The QEXAFS
monochromator consists of a goniometer which permits to select a specific Bragg angle and a fast oscillating channel cut crystal attached to the goniometer. The oscillation of the monochromator crystal is produced by an eccentric disk that is continuously rotated by a motor. This system permits to scan up to ∼40 energy points per second. Depending on the energy, a Si (111) or Si (311) crystal is used. The two crystals can be manually exchanged during shutdown periods.
Different components and detectors allowing setting up transmission and fluores-cence experiments as well as Resonant Inelastic X-ray Scattering (RIXS) and High Energy Resolution Fluorescence Detected X-Ray Absorption Spectroscopy (HERFD XAS) measurements can be installed in the experimental station. A sample manipu-lator consisting of several modules including horizontal and vertical movements plus a rotation is also available. The components corresponding to the different setups can be easily exchanged or removed.
II.A-4.2 Experiment
The von Hamos crystal spectrometer of Fribourg was installed in the experimental station downstream from the optical tables (see Figure II.A.10). For our experiment all unnecessary parts of the beamline equipment were removed from the beam path and replaced by a bare beam pipe closed at the spectrometer side by a Kapton window. To simplify the venting of the spectrometer, the beam port of the latter was not connected mechanically to the beam pipe but closed with a thin Kapton foil. The distance between the beam port and the downstream end of the beam pipe amounted to a few cm only, resulting in a negligibly small absorption of the incoming photons in air.
The beam energy was tuned to 8.5 keV, using the DCM monochromator and the Rh coating for both mirrors. In order to reduce the wings of the spatial beam dis-tribution and to preserve the angular resolution of the GEXRF measurements (see
Subsection III.B-5.2 on page 76) a height of 0.5 mm was adopted for the horizontal monochromatic slit, whereas the width of the vertical slit was varied between 0.2 and 3.5 mm, depending on the measured sample. For the widest beam the intensity on the sample was ∼7 · 1011photons/s.
II.A GEXRF measurements optical table rail rail cables cables
cables support stage x-ray beam
Figure II.A.10: Schematic drawing of the von Hamos spectrometer as installed at the
SLS SuperXAS beamline.
Several structures with plane symmetries were measured (see subsection II.C-2.4
and II.C-2.5). The GEXRF angular profiles were measured using the K𝛼 x-ray lines of Si, Co and Ni. The spectrometer was equipped with a Ge (220) crystal for the measurements of Ni and with a SiO2(1¯11) crystal for those of Si. The Co measurements were performed partly with the Ge (220) crystal in first order of diffraction and partly with the SiO2 (1¯11) crystal in second order of diffraction.
II.B
GIXRF measurements
II.B-1
Beamlines
The experimental GIXRF data were collected by Falk Reinhardt from Physikalisch-Technische Bundesanstalt (PTB) at two different beamlines of the electron storage ring BESSY II, in Berlin, Germany. The measurements in the soft x-ray range, i.e. the energy regime between 78 eV and 1860 eV, were performed at the Plane Grating Monochromator (PGM) beamline [48]. The measurements demanding a higher ex-citation energy were realized at the Four-Crystal Monochromator (FCM) beamline [49, 50], where x-ray energies between 1.75 keV and 10.5 keV are available. At both beamlines the incident synchrotron radiation is well characterized in terms of spectral purity and intensity profile in the focal plane.
II.B-1.1 Plane grating monochromator beamline
ThePGMbeamline is operated with two undulators characterized by periods of 180 mm and 49 mm, respectively. The undulators provide photons with energies ranging from 20 eV to 1900 eV with a high flux and a small transmittance of higher diffraction orders. The radiation impinging on the monochromator originates from the central cones of the first, third and fifth undulator harmonics.
The layout of the whole beamline is shown inFigure II.B.1. The first optical element is a horizontally deflecting water-cooled toroidal mirror (M1) which collimates the light in both the vertical and horizontal directions. The collimated beam passes trough the plane-grating/plane-mirror assembly (M2, PG), equipped with two gratings (1200 and 300 lines/mm) and a long rotatable plane mirror. All optical elements are Au-coated except the plane mirror and the 300 lines/mm grating whose surfaces are divided into two halves which are coated one with SiC, the other one with Au. The 300 lines/mm grating and the plane mirror can be translated transversely to the optical axis. As a result, depending on the photon energy, a different coating can be used for an optimum suppression of the photons corresponding to higher-order diffractions. A horizontally
Figure II.B.1: Schematic view of the plane-grating monochromator beamline (from [48]).
deflecting cylindrical mirror (M3) focuses the diffracted light vertically onto the exit slit. Finally the beam is refocused in both the vertical and horizontal directions at the toroidal mirror (M4).
An advantage of this beamline is the possibility to downsize the vertical spread of the beam profile down to 20 𝜇m.
II.B-1.2 Four-crystal monochromator beamline
The FCMbeamline is fed with the radiation from a bending magnet having a charac-teristic energy of 2.5 keV. The beamline covers the energy range from 1.75 to 10 keV. In order to achieve the required reproducibility in photon energy, the monochromator and focusing elements are decoupled.
The beamline layout is presented in Figure II.B.2. The beam produced by the bending magnet is first reflected by a toroidal mirror. The latter focuses the beam in the horizontal plane and collimates it in the vertical plane. A four-crystal geometry is used to monochromatize the beam, employing the setup proposed by DuMond [51] which provides a fixed exit beam without crystal translations (see Figure II.B.3). To
II.B GIXRF measurements
Figure II.B.2: Schematic view of the four-crystal monochromator beamline (from [49]).
cover the spectral range from 1.75 to 10 keV, two sets of four InSb (111) and Si (111) crystals are used. The two sets can be exchanged in vacuum by means of a horizontal translation. The monochromatized beam is then reflected by a quasi-flat mirror that can be bent down to a radius of 2 km to superpose the vertical and horizontal focal points. The beam at the FCMbeamline can be vertically focused down to 300 𝜇m.
II.B-2
GIXRF setup
II.B-2.1 Ultra-high vacuum x-ray spectrometry chamber
In order to perform theGIXRFmeasurements the samples need to be properly mounted and manipulated. To achieve this aim, a dedicated UHVx-ray spectrometry chamber was developed at thePTB. The latter allows to perform measurements in standard x-ray fluorescence conditions as well as in theGIXRFgeometry [52,53]. TheGIXRFspectra of the samples consisting of NaCl nanostructures (Subsection II.C-1.2 on page 51) and Cr pads (Subsection II.C-2.1 on page 52) were measured using this PTB’s x-ray spectrometry chamber.
Figure II.B.4: Sketch of the PTB’s GIXRF experimental setup: a) top view, b) view from the upstream side. The energy-dispersiveSDDdetector is aligned perpendicularly to the incident beam. This permits to minimize the intensity of the scattered radiation. The figure was taken form [54].
The sample fluorescence is produced by a monochromatic synchrotron radiation of well-known flux and intensity distribution in the focal plane. The intensity of the incident radiation is measured with a set of calibrated photodiodes. The latter are also used to determine the incident angle of the beam with respect to the sample surface (see
Figure II.B.4). Thanks to a precise knowledge of the chamber geometry, the incident angle can be set with a precision of ±0.005∘. Together with the known beam profile, this ensures the accurate determination of the effective solid angle of detection for any incident angle and photon energy [53].
As the x-ray spectrometry chamber is equipped with a single rotation axis, a great care was devoted to the mounting of the Cr pads sample on the target holder: the rows in which the pads are arranged were accurately aligned on the direction corresponding to the spread of the beam footprint on the sample surface (see Figure II.B.4.b).
II.B-2.2 6-axis manipulator ultra-high vacuum chamber
The Cr stripes sample (Subsection II.C-2.2 on page 52) was mounted on the UHV
6-axis manipulator developed recently at the PTB[55]. The latter consists of a 𝑥-𝑦-𝑧-translation stage and a 𝜗-𝜒-𝜙-rotation stage. Here 𝜒 denotes the angle of the sample surface with respect to the polarization plane of the incident synchrotron beam. Thus, for 𝜒 = 0∘, measurements of 𝑠-polarized photons are possible, whereas measurements performed at 𝜒 = 90∘ allow to minimize the scattering of the radiation in the sample. For 𝜒 = 90∘, 𝜙 corresponds to the angle of the incident beam relatively to the substrate surface. This angle can be varied from 0∘ to 45∘, enabling GIXRF and TXRF mea-surements as well as conventional XRF measurements in the standard 45∘/45∘-setup. The 𝜗-stage rotates the sample around an axis which is normal to the sample surface.
II.B GIXRF measurements
Figure II.B.5: Sample layout in the 6-axis manipulator chamber. The Cr stripes are parallel to the 𝑦-axis and lie in the 𝑥-𝑦-plane. 𝜙 represents the angle between the incident radiation and the 𝑥-𝑦-plane, whereas 𝜗 denotes the tilt angle between the 𝑦-axis and the projection of the incident beam on the 𝑥-𝑦-plane.
For the measurements, the sample was aligned so that the center of the stripes structure coincided with the 𝜙 and 𝜗 rotation centers. Then the angle 𝜗 was varied from slightly below 0∘ to slightly above 90∘ in steps of 5∘. At each 𝜗-angle the XRF
count rate was recorded with an SDD detector, varying the incident angle 𝜙 from 0∘ to 1.2∘ with a step width of 0.01∘. The sample layout is presented inFigure II.B.5.
II.B-3
Reference-free analysis
As mentioned above, at bothPTBbeamlines the incident synchrotron radiation is well characterized in terms of spectral purity and intensity profile in the focal plane. Thus the projection of the beam onto the sample surface, the so-called footprint of the beam (see Figure II.B.6), can be precisely calculated. The fluorescence radiation emitted by the sample is measured with a SDD detector with a well characterized efficiency and spectral response function. Furthermore, for any incident angle the solid angle
Figure II.B.6: Left: beam spot profile in the focal plane of the PGMbeamline for an exit slit width of 70 𝜇m. Right: beam spot profile projected on the wafer surface for an incident angle of 0.9∘. Both profiles were taken from Ref. [52].


![Figure II.B.1: Schematic view of the plane-grating monochromator beamline (from [48]).](https://thumb-eu.123doks.com/thumbv2/123doknet/15028431.686691/44.892.142.746.124.622/figure-ii-schematic-view-plane-grating-monochromator-beamline.webp)
![Figure II.B.2: Schematic view of the four-crystal monochromator beamline (from [49]).](https://thumb-eu.123doks.com/thumbv2/123doknet/15028431.686691/45.892.244.635.146.394/figure-ii-b-schematic-view-crystal-monochromator-beamline.webp)
