HAL Id: hal-02415507
https://hal.archives-ouvertes.fr/hal-02415507
Submitted on 17 Dec 2019
HAL is a multi-disciplinary open access
archive for the deposit and dissemination of
sci-entific research documents, whether they are
pub-lished or not. The documents may come from
teaching and research institutions in France or
abroad, or from public or private research centers.
L’archive ouverte pluridisciplinaire HAL, est
destinée au dépôt et à la diffusion de documents
scientifiques de niveau recherche, publiés ou non,
émanant des établissements d’enseignement et de
recherche français ou étrangers, des laboratoires
publics ou privés.
N. Perot, A. Le Cocguen, D. Carre, H. Lamotte, Anne Duhart-Barone, I.
Pointeau
To cite this version:
N. Perot, A. Le Cocguen, D. Carre, H. Lamotte, Anne Duhart-Barone, et al.. Sampling strategy
for dihydrogen flow rate characterization of radioactive waste. DEM 2018 - Dismantling Challenges:
Industrial Reality, Prospects and Feedback Experience, Oct 2018, Avignon, France. �hal-02415507�
Sampling strategy for dihydrogen flow rate characterization of
radioactive waste
Nadia Pérot 1*, Alexandre Le Cocguen1, Dominique Carré1, Hervé Lamotte1, Anne Duhart-Barone1,
Ingmar Pointeau1
1CEA Nuclear Energy Division, Centre de Cadarache, 13108 Saint-Paul-lez-Durance
* Nadia Pérot, [email protected]
Abstract
This paper describes the methodology used to define a sampling strategy adapted to opera-tional constraints in order to characterize the dihydrogen flow rate of 2714 nuclear waste drums produced by radiolysis reaction of organic mixed with -emitters. Thus, a sample of only 38 drums has been selected to be measured. Statistical analysis of drum measurement data of dihydrogen rate provided an estimation of the mean and the upper bound of the physical quan-tity of interest which gave a good convergence with global measurements from the ventilation system of the facility. Thereafter, performing a factorial data analysis has demonstrated the sampling strategy assumption validity and provided information that has been used for a re-gression analysis to develop a linear prediction model of dihydrogen flow rate production for the waste drum characterization.
KEYWORDS:radioactive waste characterisation, sampling strategy, statistical analysis.
Introduction
Some categories of radioactive waste drums may produce hydrogen gas because of the radiolysis re-action of organic matter like PVC, Polyethylene or cellulose mixed with -emitters in the waste. The evaluation of the hydrogen flow rate produced by radioactive waste drums is required for their disposal in final waste repositories. However, considering the time required for the H2 flow rate measurement of
only one drum (more than one month) and the need to characterize the population of 2714 drums (on the CEA center of Cadarache), only a small sample can be measured. Therefore it is necessary to develop a statistical sampling strategy to select a drum set of “reasonable” size that would be repre-sentative of the whole population.
This paper describes the methodology used to define a sampling strategy adapted to the operational constraints of the facility and to analyze the drum measurement data of H2 rate completed by the
vali-dation of the sampling strategy hypotheses. The following section presents the sampling strategy per-formed to identify a representative set of drums to measure and the analysis of the measurement data to estimate statistical indicators of the quantity of interest, the drum H2 flow rate. The third section is
dedicated to the validation of the sampling strategy hypothesis and finally, a regression analysis has been performed on the measurement data in order to develop a predictive model of drum H2 production.
Sampling strategy and statistical analysis
The need to characterize annual H2 production of this drum population corresponds in practice to an
objective of upper bound estimation. In this context, the Wilks method has been selected to determine the sample measurement size to estimate a 90% quantile1 of the studied population of drums with a
level of confidence of 90%. The great interest of this method [1] is its robustness and that no hypothesis is required.
The Wilks method has been introduced in the nuclear engineering community by the German nuclear safety institute (GRS) at the beginning of the 1990s [2], and then used for various safety assessment problems. This method [3,1] based on order statistics allows the user to precisely determine the required sample size in order to estimate, for a random variable, a quantile of order
𝛾
with confidence level β. We restrict our explanation below to the one-sided case. Suppose we have an i.i.d. (independent iden-tically distributed) n-sample X1, X2, ⋯ , Xn drawn from a random variable X. We note M = maxi(Xi). For1𝑞
𝛾 is a 𝛾-quantile of the random variable 𝑋, if 𝑃(𝑋 ≤ 𝑞𝛾) ≥ 𝛾, which means 𝑞𝛾is the value for which 𝛾
M to be an upper bound for at least γ. 100% of possible values of X with given confidence level β, we require
P[P(X ≤ M) ≥ γ] ≥ β (Eq. 1).
The Wilks formula stands that the sample size n must therefore satisfy the following inequality:
1 − 𝛾𝑛≥ 𝛽 (Eq. 2)
𝛾 0.9 0.9 0.9 0.95 0.95 0.95 0.95 0.99 0.99
𝛽 0.5 0.9 0.95 0.4 0.5 0.78 0.95 0.95 0.99
𝑛 7 22 29 10 14 30 59 299 459
Table 1 : Examples of values given in the first-order case by Wilks formula.
In Table 1, we present several consistent combinations of the sample size n, the quantile order γ and the confidence level β. For example, to have an estimation of the median (0.5-quantile) with a level of confidence of 90%, the Wilks formula requires a sample of size 5 and the corresponding Wilks first-order 0.5-quantile should be the maximum of the sample.
The equation (Eq. 1) is a first order equation because the upper bound is set equal to the maximum value of the sample. To extend Wilks formula to higher orders, we consider the n-sample of the ran-dom variable X sorted into the increasing order: X(1)≤ X(2)≤ ⋯ ≤ X(r)≤ ⋯ ≤ X(n). For all 1 ≤ 𝑟 ≤ 𝑛,
we set
𝐺(𝛾) = ℙ[ℙ(𝑋 ≤ 𝑋(𝑟)) ≥ 𝛾] (Eq. 3).
According to the Wilks formula, the previous equation can be recast as 𝐺(𝛾) = ∑𝑟−1𝑖=0𝐶𝑛1𝛾2(1 − 𝛾)𝑛−𝑖 (Eq. 4).
The value X(r) is an upper-bound of the γ-quantile with confidence level β if 1 − 𝐺(𝛾) ≥ 𝛽.
Increasing the order of Wilks formula helps reduce the variance in the quantile estimator, the price being the requirement of a larger n (according to formula 1 − 𝐺(𝛾) ≥ 𝛽). This Wilks formula can be used in two ways: when the goal is to determine the sample size required to estimate a γ-quantile with a given confidence level β; when a sample size is already available, then the wilks formula can be used to determine the couple (γ, β) and the order for the estimation of the Wilks quantile.
For the studied use case, the corresponding sample size is 38 for a unilateral second order quantile of level 90% with a level of confidence of 90%. Nevertheless, as the measurement cost and operation constraint are important, it has been decided to use as far as possible available measurements of 15 repackaged drums but with the necessity to have a representative sample of the whole population. The sample drum selection is performed according to two quantitative (Pu quantity and the production date) and two qualitative drum parameters (origin and spectrum) considered by expert judgement as the more relevant from the 17 characterising the studied population of drums. Therefore, we use a method con-sisting in a random selection associated to a relevant parameter representativeness validation with sta-tistical tests (Kolmogorov-Smirnov, Ansari-Bradley) for the numerical characteristics and the use of mul-tinomial and binomial distribution laws to represent the qualitative characteristic occurrence in the whole drum population of PEGASE facility [4]. The origin parameter/variable is modeled by a multinomial dis-tribution law and the spectrum variable is modeled by multinomial disdis-tribution law. In both case, the law parameters are fitted on the data of the whole drum population. Statistical tests are used to evaluate for each modality of each qualitative variable, if the proportion of occurrence in the random sample is rep-resentative of the whole population. If not (for quantitative or qualitative variables), a new random sam-ple is selected.
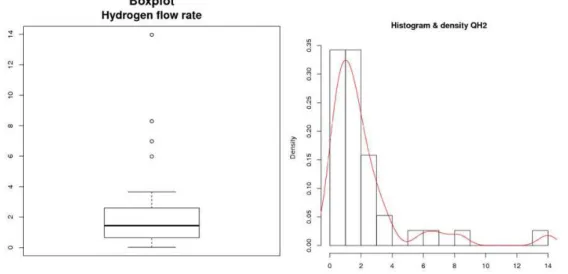
Thus a sample of 38 drums has are identified including 15 available drum measurements and with only 23 drums to measure. The summary statistics estimated with the H2 flow rate data are the following (the unity is l/year): mean 𝜇̂ = 2.18, median = 1.43, standard deviation 𝜎̂ = 2.67, Min = 0.02, Max = 13.97. Figure 1 presents measurement data dispersion on a histogram and a boxplot which seems to be closed to a lognormal distribution in the central part.
We can directly estimate the 95%-quantile from the log-normal theoretical distribution that has been fitted 𝑋 = ℒ𝒩(0.23,1.16) :
𝑞95%= 8.5 𝑙/𝑑𝑟𝑢𝑚/𝑦𝑒𝑎𝑟.
However, due to the small number of data that served to fit the probabilistic density function, little confi-dence can be accorded to this value, and justifying it to safety authorities could be difficult. Moreover, the log-normal distribution is rejected by the Shapiro-Wilks adequacy test (the most robust test for small sample size) with the threshold 5%.
A Wilks unilateral second-order 𝛾-quantile with a confidence level 𝛽, is deduced from equation (Eq. 4) and we obtain the following solution for (𝛾, 𝛽) = (90%, 90%):
𝒒
𝜶,𝜷𝒘= 𝒒
𝟗𝟎%,𝟗𝟎%𝒘= 𝟖. 𝟑 𝒍/𝒅𝒓𝒖𝒎/𝒚𝒆𝒂𝒓.
Figure 1 : Boxplot (left), histogram and smoothed-kernel density function (right) of the 38 hydrogen flow rates.
The statistical analysis of the sample measurement data provides estimations of mean and 90%-quan-tile for H2 flow rate for an equivalent standard drum (corresponding to 4.5 times the quantity of interest
for a primary drum) that are lower than the target threshold of 10 l/year/drum and present a good con-vergence using a global measurement from the ventilation system of the facility [5]. The sampling strat-egy [6] presented in this section is based on the Wilks method to determine the size of the drums to measure and the use of statistical tests to validate the representativeness of the measurement data according to relevant parameters. The aim of the following part is to confirm that the hypothesis used to guide the sampling strategy are valid.
Validation of sampling strategy hypothesis and regression analysis
The sampling strategy performed to estimate upper bounds of H2 flow rate of the drum population is
based on a sampling strategy according to 4 parameters considered as relevant. The question is to validate this hypotheses provided by expert judgement. For this purpose, a factorial analysis for mixed data (FAMD) [7,8] is implemented on the 38 data of the measurement sample completed by a hierar-chical cluster analysis. FAMD method is a combination of a principal component analysis (PCA) for quantitative data and a multiple correspondence factorial analysis (MCA) for qualitative data.
PCA is a statistical method that use an orthogonal transformation to convert a set of numerical obser-vations of possibly correlated variables into a set of values of linearly uncorrelated variables called cipal components. The visualization of the projection of the values of the studied variables on the prin-cipal components gives information on the existence of linear multiple correlations on these variables. MCA method is a data analysis technique that can be considered as a counterpart of PCA for qualitative (categorical) data.
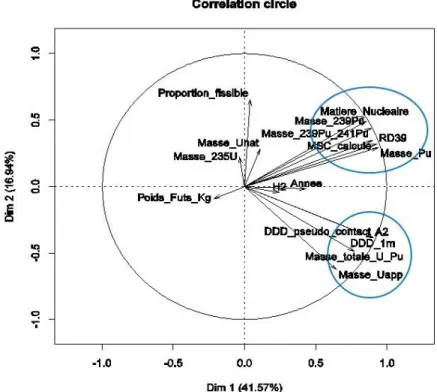
Figure 2 presents the correlation circle for the two first components of the principal component analysis (PCA) on which the drum quantitative parameters have been projected. These two components explain almost 60% of the data variability and the correlation circle highlights in particular, as expected, a strong
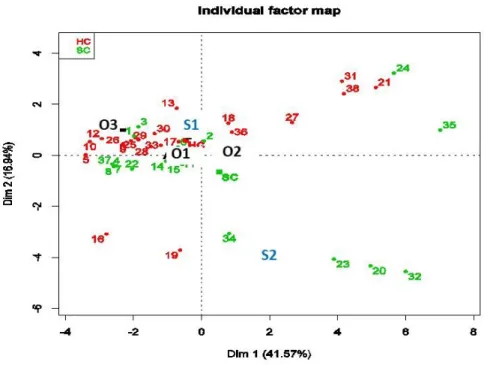
multiple correlation for Nuclear material, Mass of 239Pu, Mass of 239Pu and 241Pu, Mass of 241Pu and Mass of Pu on the one hand and another one for Contact dose rate, Dose rate at 1m, Total mas of U and Pu, Mass of depleted U on the other. Figure 3 presents the results of the method for the qualitative variable, the modalities have been projected on the two first components and shows the proximity of the first modality of the variable origin and the second modality of the variable spectrum.
Figure 2: Correlation circle of the CPA on quantitative data for the two first components.
A hierarchical cluster analysis is performed on the first component, the results presented on Figure 4 provide 5 clusters with the characteristics detailed in Table 2. For quantitative parameters/variables (resp. qualitative), correlation are the squared correlations (resp. the correlation ratios) with the first principal component (the cluster center). We can observe that the 4 given relevant initial parameters (from expert judgement) are finally cluster representative although Year of production and origin are in the same cluster. Nevertheless, two clusters are not taken into account; one should be represented by the parameter Mass of depleted U and the cluster containing Mass of Unat and the specific information parameter Classification is not significant considering the correlation values of 0.65. An FAMD on the whole population of drums provides the same results.
Figure 3: Representation of the qualitative variable modalities on the two first components of the FADM analysis.
Figure 4: Clusters resulting from the hierarchical clustering analysis performed on the sample of 38 measurement data.
Table 2: Description of the clusters provided by the hierarchical cluster analysis.
Both qualitative parameters “origin” (3 modalities) and “spectrum” (2 modalities) used for the sampling Parameter Correlation Parameter Correlation Parameter Correlation Parameter Correlation Parameter Correlation Date of
production 0.67
Proportion of fissile
material 0.86 Total Mass U and Pu 0.91 Mass of Pu 0.97 Mass of Unat 0.65 Mass of 235U 0.31 Spectre 0.86 Mass of depleted U 0.83 Mass of 239Pu and 241Pu0.98 Classification 0.65
Origin 0.58 Contact dose rate 0.95 Mass of 239Pu 0.98
Drum weight 0.23 Dose rate at 1m 0.95 Nuclear material 0.98
strategy and the clustering analysis provides 5 main clusters (some combination are not realistic), and for each of them, it could be developed a prediction model for the H2 flow rate production. Nevertheless,
the size of these clusters is very different in the measurement sample. Indeed, there are 22 data for the cluster corresponding to the origin “O1” and the spectrum “S1” but there are only 7 data for the cluster corresponding to the origin “O2” and the spectrum “S1”. The other clusters are even smaller. For a robust and reliable regression analysis, the studied sample has to be of sufficient size.
A regression analysis is performed on the cluster “O1-S1” (which corresponds to the closest modalities highlighted by the FADM analysis in the previous section) with 22 data with a general linear model regression with the elastic net regularization method [9] that combines the L1 and L2 penalties of the Lasso and Ridge methods to reduce the number of terms in the regression model, identify the important terms or predictors. This method treats the redundant terms and produces estimates with potentially lower predictive errors than ordinary least squares. The study is performed with glmnet R package. Therefore, performing this regression method, we obtain a linear model with 4 parameters (Production date, Mass of depleted U, Mass of 235U and Mass of Pu) which represent the 4 main clusters provided by the hierarchical cluster analysis:
𝑄𝐻2= −4.73 + 0.07 × 𝑃𝑟𝑜𝑑𝑢𝑐𝑡𝑖𝑜𝑛_𝑑𝑎𝑡𝑒 + 0.026 × 𝑀𝑎𝑠𝑠_𝑜𝑓_𝑃𝑢 + 0.006 × 𝑀𝑎𝑠𝑠_𝑜𝑓_𝑑𝑒𝑝𝑙𝑒𝑡𝑒𝑑_𝑈 ×
𝑀𝑎𝑠𝑠_𝑜𝑓_235𝑈 (Eq. 5)
The determination coefficient 𝑅2= 75 %, and the adjusted determination coefficient (which take into
account the number of data and the number of model terms) 𝑅𝑎2= 67 % are not close to 1 and do not
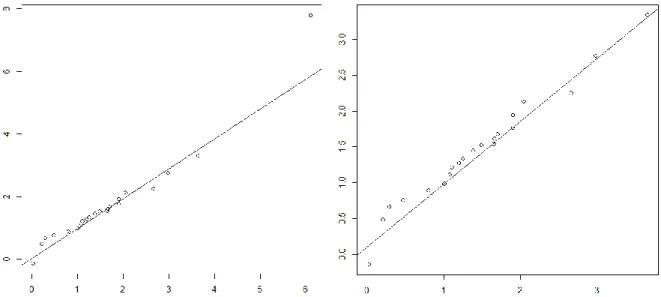
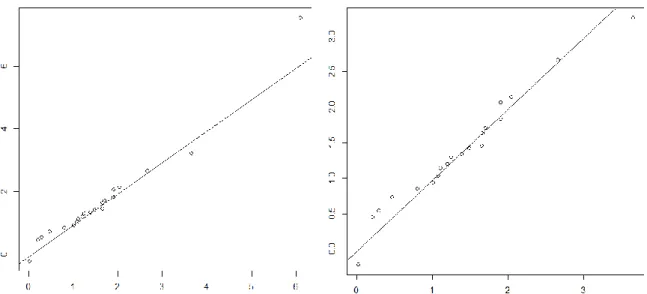
help to validate the model. Moreover, the quantile-quantile graph of Figure 5 which represents the plot of the theoretical model quantiles against the data empirical quantiles does not show a good adequacy of the model (Eq. 5)for a high quantile represented by the 37th data that could be an outlier or a
misin-formed data. In order to improve the model of H2 production rate prediction, the regression is performed
on the data of cluster “O1-S1” without the 37th data.
Figure 5:
Quantile-quantile graph of the model (Eq. 5) versus the measurement data for thecluster “O1-S1” (global on the left and without the higher quantile on the right).
We obtain the following linear model:
𝑄𝐻2= −5.52 + 0.078 × 𝑃𝑟𝑜𝑑𝑢𝑐𝑡𝑖𝑜𝑛_𝑑𝑎𝑡𝑒 + 0,014 × 𝑀𝑎𝑠𝑠_𝑜𝑓_𝑃𝑢 + 0,0058 × 𝑀𝑎𝑠𝑠_𝑜𝑓_𝑑𝑒𝑝𝑙𝑒𝑡𝑒𝑑_𝑈 ×
𝑀𝑎𝑠𝑠_𝑜𝑓_235𝑈 (Eq. 6)
The determination coefficient 𝑅2= 81 %, and the adjusted determination coefficient 𝑅
𝑎2= 78 % for the
model (Eq. 6) are closer to 1 than for the model (Eq. 5) and contribute to validate this model. Moreover, the quantile-quantile graph of Figure 6 shows a better adequacy for the central quantiles than for the previous model.
Figure 6: Quantile-quantile graph of the model (Eq. 6) versus the measurement data for the
cluster “O1-S1” without the 37th data (global on the left and without the higher quantile on the
right).
This model (Eq. 6) is then used to provide confidence intervals of H2 flow rate production for the1462
drums of the studied cluster “O1-S1” in the whole population and the following confidence intervals of level 95% and 90% are estimated:
𝐼
𝑐95%= [4.9; 12.9] l. year
−1for the drum with the higher predicted H2 production rate,
𝐼
𝑐90%= [5.6; 12.2] l. year
−1for the drum with the higher predicted H2 production rate.The estimation of the predicted H2 production rate for this drum is 8.88 𝑙. 𝑦𝑒𝑎𝑟−1.
Conclusion
We have presented here a methodology of sampling strategy to select a small sample to be measured in order to provide estimations of the mean and the upper bound of a physical quantity of interest. The results of the statistical analysis give a good convergence with global measurements from the ventilation system of the facility. Thereafter, performing a factorial data analysis demonstrates and completes the sampling strategy assumption validity (assumptions derived from expert judgement) and provides in-formation that are used for a regression analysis to develop a linear prediction model of dihydrogen flow rate production for the waste drum characterization of the studied facility.
This approach has demonstrated its value, so it is currently performed in order to characterize other physical quantities for waste drums on several CEA facilities.
Acknowledgment
The authors wish to thank Thierry Advocat and Eric Fillion, from CEA D&D research program for their support.
References
1) Blatman G., Delage T., Iooss B., Pérot N (2017), Probabilistic risk bounds for the characterisation of radiological contami-nation, EPJ Nuclear Sci. Technol. 3, 23. https://www.epj-n.org/articles/epjn/pdf/2017/01/epjn160031.pdf
2) E. Hofer (1993), Probabilitische unsicherheitsanalyse von ergenissen umfangenreicher rechenmodelle, GRS-A-2002. 3) Wilks S.S. (1941), Determination of sample sizes from setting tolerance limits, Anals of Mathematical Statistics. 4) Pérot N. (2010), Echantillonnage statistique pour l’estimation du debit d’hydrogène des colis de l’installation PEGASE, NT CEA/DEN/CAD/DER/SESI/LSMR/NT DR2 04/08/10.
5) Validation du caractère envelope du MOP par mesure de production de dihydrogène de radiolyse de fûts de déchets
primaires alpha Pu PEGASE, DSN/SEEC/LEEC-DER/SESI/LSMR-DPC/SECR/LRMO, (2014), NT
CEA/DEN/CAD/DSN/SEEC/LECD DO 67 23/07/14.
6) Pérot N. & al (2018), INSIDER H2020 project, WP3-Sampling strategy –Report on the state of the art, Deliverable D3.1. 7) Saporta Gilbert (1990), Simultaneous analysis of qualitative and quantitative data. Atti della XXXV riunione scientifica,
società italiana di Statistica, 63–72.
8) Pagès Jérôme (2014), Multiple Factor Analysis by Example Using R, Chapman & Hall/CRC, The R Series London 272 p. 9) Zou, Hui; Hastie, Trevor (2005), Regularization and Variable Selection via the Elastic Net, Journal of the Royal Statistical Society, Series B: 301-320.