HAL Id: cea-01874245
https://hal-cea.archives-ouvertes.fr/cea-01874245
Submitted on 14 Sep 2018
HAL is a multi-disciplinary open access
archive for the deposit and dissemination of
sci-entific research documents, whether they are
pub-lished or not. The documents may come from
teaching and research institutions in France or
abroad, or from public or private research centers.
L’archive ouverte pluridisciplinaire HAL, est
destinée au dépôt et à la diffusion de documents
scientifiques de niveau recherche, publiés ou non,
émanant des établissements d’enseignement et de
recherche français ou étrangers, des laboratoires
publics ou privés.
assessment in the west tokamak: first measurements
O. Meyer, J. Giacalone, A. Gouin, J. Pascal, C. Klepper, N. Fedorczak, Ph.
Lotte, E. Unterberg, D. Fehling, J. Harris
To cite this version:
O. Meyer, J. Giacalone, A. Gouin, J. Pascal, C. Klepper, et al.. Visible spectroscopy diagnostics for
tungsten source assessment in the west tokamak: first measurements. Review of Scientific Instruments,
American Institute of Physics, 2018, 89, pp.10D105. �10.1063/1.5035566�. �cea-01874245�
VISIBLE SPECTROSCOPY DIAGNOSTICS FOR TUNGSTEN SOURCE
ASSESSMENT IN THE WEST TOKAMAK: FIRST MEASUREMENTS
a)O. Meyer1,b), JC. Giacalone1, A. Gouin1, JY. Pascal1, C. C. Klepper2, N. Fedorczak1, Ph. Lotte1, E. A. Unterberg2, D. T. Fehling2, J. H. Harris2 and the WEST Team1,c)
1
CEA, IRFM, F-13108 Saint-Paul-Lez-Durance, France
2 ORNL, Oak Ridge, Tennessee 37831-6169, USA
(Presented XXXXX; received XXXXX; accepted XXXXX; published online XXXXX)
(Dates appearing here are provided by the Editorial Office)
The present work concerns the measurements obtained with the WEST Visible Spectroscopy system during the first experimental campaign. This system has been developed in the framework of the WEST (Tungsten [W] Environment in Steady-state Tokamak) project that equipped the existing Tore Supra device with a tungsten divertor in order to test actively cooled tungsten Plasma Facing Components (PFC) in view of preparing for ITER operation. The goal of this diagnostic is to measure the PFC sources and the deuterium recycling with spectral, spatial and temporal resolution adapted to the predicted power deposition profiles on the objects observed. Three kinds of PFCs are monitored: the ICRH antenna and LHCD launcher W limiters; one of the 6 W inner bumpers; the upper and lower W divertors. Large-aperture in vessel actively cooled optical systems (f-number ~ 3) were installed for each view and connected to optical fibres. A total of 240 optical fibers can be distributed on various detection systems including a fast response-time, multi-channel, filtered photodetector-based “Filterscope” system, developed by Oak Ridge National Laboratory (USA) as well as grating spectrometers optimized for multi-sightline analysis. The first WEST experimental campaign conducted in 2017 has been dedicated to plasma start-up development during which the visible spectroscopy system has provided crucial information related to the impurity content first and then impurity sources. The diagnostic setup for that first experimental campaign was limited to the inner bumper and outer limiters but was sufficient to demonstrate the optical setup was in accordance with the specifications. The Radiance calibration procedure allowed us to estimate fluxes from the main limiter of about 8×10¹⁸ atoms/(s.m²) and to show a first W source radial profile along the outboard limiter.
High Temperature Plasma Diagnostics Conference in the Review of Scientific Instruments. Authors must follow the instructions given in this document; it should be used as an instruction set. All files MUST be submitted through the online system at: http://rsi-htpd.peerx-press.org/
I. INTRODUCTION
The present work is about the commissioning and the first data analysis related to Visible Spectroscopy systems for W sources assessment1 developed in the framework of the WEST project2. This system, detailed in1, aims at providing information on the potential plasma particle and impurity sources produced by the principal W plasma facing components shown in figure 1. The originality of the system is that all optical elements are installed in the vacuum vessel and protected by actively cooled panels to be compatible with steady state operation. Each view is designed to monitor the object with an adapted geometry as described in Table 1. Each line of sight (LOS) is linked
via optical fiber to a patch panel that permits to dispatch the 240 LOS on various detection systems.
The first part of the paper gives an overview of the diagnostic setup that was operational for the first WEST
FIG 1: WEST In Vessel view. (Reproduced from O. Meyer, Rev. Sci. Instrum. 87, 11E309 (2016), with the permission of AIP Publishing)
a) Published as part of the Proceedings of the 22nd Topical Conference on
High-Temperature Plasma Diagnostics (HTPD 2018) in San Diego, California, USA.
b) Author to whom correspondence should be addressed:
experimental campaign C2 and shows the results of the alignments performed. The second part details the radiance calibration procedure that is a crucial point for the commissioning of this system. The last part of the paper shows and discusses the first experimental results produced by the WEST visible spectroscopy setup.
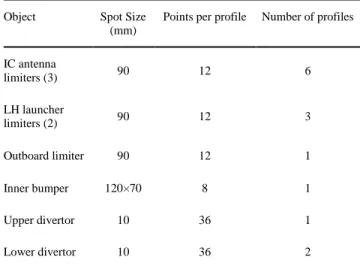
Table 1: Geometrical specifications for the views
Object Spot Size
(mm)
Points per profile Number of profiles
IC antenna limiters (3) 90 12 6 LH launcher limiters (2) 90 12 3 Outboard limiter 90 12 1 Inner bumper 120×70 8 1 Upper divertor 10 36 1 Lower divertor 10 36 2
II. VISIBLE SPECTROSCOPY SETUP FOR THE FIRST EXPERIMENTAL CAMPAIGN
A. Operational views and alignments results
The initial plan for the first experimental campaign was to have the divertor views, inner bumper view, outboard limiter view and LH launcher views available. Unfortunately, vacuum feedthroughs related technical issues delayed the commissioning of the divertor views and required the removal of the LHCD views with a plan to reinstate using a new feedthrough technique. Both divertor and LHCD views have been technically updated and will be reinstalled for the (mid-2018) C3 campaign. The views setup for the 2017 campaign was also limited to the inner bumper and outboard limiter views (ICRH views were available but the IC system was not operated). The
inner bumper is located on the high-field side as shown in figure 2(a) to protect the inner vessel during the current ramp up where the plasma is high field-side limited. It is composed of W coated graphite tiles bolted on actively cooled copper plates The view is essentially dedicated to the monitoring of W source during the plasma current ramp up. Figure 2(b) shows a picture taken during one of the alignments where the spots are produced on the observed surface by back illuminating the optical fibers. The spots size and spacing were measured to be in accordance with the initial specifications summarized in table 1.
The outboard limiter shown in figure 3(a) is a movable object dedicated to the protection of antenna and launchers during the plasma start-up; it is then the closest object to the plasma and the major main chamber source of impurities during that phase. The alignment shown in figure 3(b) is for 1 of the 2 extreme working positions. The observations are also in accordance with the specifications but some vignetting can be seen on the extreme lines of sight.
FIG 3: Outboard movable limiter view geometry. The optical setup is installed directly into the vacuum vessel behind the high field side panel and images 12 optical fibers on the limiter leading edge. (a & b) Pictures of the optical fibers back illuminated for alignment.
B. Detection system setup
1. Grating spectrometers
For the C2 experimental campaign, we commissioned three grating spectrometers: two Isoplane™ units permitting to treat 27 LOS each and mostly dedicated to measure the W I line at 400.9 nm on both inner bumper and outboard limiter with a spectral resolution of 0.1 nm FWHM (Full Width at Half Maximum). The third grating spectrometer allows a spectral resolution of 0.02 nm FWHM, permits to treat 15 LOS and will be mostly dedicated to the nH/(nH+nD) isotopic ratio estimate.
2. Fast acquisition filters spectrometer
The “Filterscope”, developed by Oak Ridge National Laboratory (USA) 3 4 5, is an integrated detection system, comprising 24 compact, filtered photomultiplier tubes in a single instrumentation crate, together with photomultiplier tubes and signal conditioning electronics and computer and
FIG 2: Inner bumper view geometry. (a) The optical setup installed behind a window in a low field side port images 8 optical fibers on the limiter. (b) Picture of the optical fibers back illuminated for alignments (optical fiber 2 from the bottom was not illuminated).
data acquisition. The Filterscope adds to the WEST visible spectroscopy capability by providing for ELM-resolving response time, with a target sampling period of 25 μs.
FIG 4: Input arrangement for the WEST ORNL Filterscope
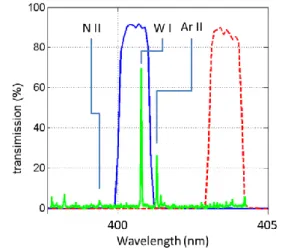
Figure 4 illustrates the system setup: the background subtracted W I and Dα lines are simultaneously measured on 5 Lines of Sight (LOS). The Dα line alone can be measured on 4 other LOS. A dedicated study was conducted in order to find suitable filters to measure the W I line and its associated background. The challenging part was to identify and discriminate the potential interfering lines. The lines identified are Ar II (401.29 nm) that will be injected for the operation of the WEST X-ray imaging crystal spectrometer, N II (399.5 nm) and the He I (402.6 nm). The filters, developed specifically for WEST, in close collaboration with Chroma Technologies in Vermont (USA), were installed for the C2 campaign. Figure 5 shows the measured transmission curves for the optimized Chroma filter pairs, including one for the main W I line (blue) and one for the associated background (red), taken in a region determined to be free of spectral lines, based on a study of available tokamak spectra databases. All the filters were tested and all of them meet the specifications.
FIG 5: Transmission of the filters developed to measure the W I line at 400.9 nm (blue curve) and the associated background (red curve). The spectrum in the background (green) is from a JET pulse #80297 including argon injection (courtesy Drs. M. Stamp and A. Meigs, UKAEA, 2016).
Regarding data acquisition and control, the Filterscope is synchronized to the WEST timing system by using analog triggers. Data and configuration settings are locally stored, then transferred after each pulse by synchronizing to an MDSPlus server installed on the WEST diagnostics computer network specifically for this collaborative diagnostic. Capability for continuous transfer in long pulse operation is also under development.
III. RADIANCE CALIBRATION
The general principle of the radiance calibration is to monitor a radiance reference source with the overall measurements setup in order to convert the counting rate measured (cts/s) in Radiance (W/(m2.sr) or Photon/(m2.sr.s)). The radiance calibration, if regularly done, is also a useful tool to quantify the overall transmission loss of the detection setup. We will particularly follow the transmission loss due to impurity coatings on the front windows during conditioning discharges but the long-term degradation of the optical fibers due to radiations will also be taken into account. In the case of the WEST visible spectroscopy system, the calibration procedure is more complex because of the patch panel interface since each of the 240 LOS could be connected to one of 78 available detection channels. We also developed a 3 steps calibration procedure illustrated by figure 6. We attached a “reference channel” to each detection system, after checking that all the detection systems channels have similar spectral responses, and a “reference line of sight” to each view. Thus, the number of radiance calibration is limited with 6 reference channels and 14 reference lines of sight.
FIG 6: Radiance calibration procedure
The first step is to perform a relative calibration of the detection systems. For the grating spectrometers systems equipped with Princeton Instruments “EMCCD” cameras we also introduced at this stage an electronic correction: the number of photoelectron per seconds Ṅe corresponding
to the photon rate detected by the camera is derived from the counting rate Ṅ (cts/s) using the equation (1):
𝑁̇𝑒= (𝐺𝐴𝐷𝐶× 𝑁)̇ 𝐺⁄ 𝐸𝑀 (1)
where GADC (e/ct) is the gain applied before the analog to
digital conversion and GEM is the Electron Multiplying
gain that allows to increase the electron signal before the readout to increase the signal to noise ratio. Working with the photoelectron rates gives us the opportunity to adjust
all the available settings to increase the signal-to-noise ratio along with conserving comparable data from pulse to pulse. Each channel is relatively calibrated regarding its reference channel, we determine for each channel i: 𝑅𝑒𝑙𝐶𝑎𝑙𝐶ℎ𝑎𝑛𝑛𝑒𝑙𝑖= 𝑁̇𝑒,𝑐ℎ𝑎𝑛𝑛𝑒𝑙 𝑟𝑒𝑓⁄𝑁̇𝑒,𝑐ℎ𝑎𝑛𝑛𝑒𝑙 𝑖 (2)
The second step concerns the relative calibration of the views. We install in the vessel and in front of the optics an integrating sphere calibrated in radiance R(λ) (Ph/(m².sr.s)) with a mechanical setup especially developed for this purpose. Once connected to a detection system relatively calibrated we can determine for each LOS j:
𝑅𝑒𝑙𝐶𝑎𝑙𝐿𝑂𝑆𝑗= 𝑁̇𝑒,𝐿𝑂𝑆 𝑟𝑒𝑓⁄𝑁̇𝑒,𝐿𝑂𝑆 𝑗 (3)
The last step is the Radiance calibration that concerns only the reference channels connected to the reference LOS. The instrumental setup is the same one as for the second step and we determine:
𝑅𝐶𝑎𝑙𝐶ℎ𝑎𝑛𝑛𝑒𝑙𝑟𝑒𝑓𝐿𝑂𝑆𝑟𝑒𝑓 (𝜆) = 𝑅(𝜆) 𝑁̇⁄ 𝑒,𝑟𝑒𝑓(𝜆) (4)
Each channel i connected to LOS j can also produce radiance calibrated data by applying the correction calculated in (2), (3) and (4) to the 𝑁̇𝑒 measured.
IV EXPERIMENTAL DATA
During the first experimental campaign, several milestones were reached. The first one was to develop an X point scenario with reliable breakdown and current ramp up. During that critical phase unexpected runaway electrons interacting with the outboard limiter were frequently observed. During this first phase, the visible spectroscopy system provided information concerning the plasma impurity content. Once a working X point scenario emerged, we commissioned the LHCD system and the second milestone reach was reached with 2 MW of LHCD power coupled into the plasmas. The visible spectroscopy system performed its first source diagnosis during this second phase.
A. Impurity composition during the first plasma breakdowns
The first plasma attempts produced low electronic temperature transients discharges that emitted mostly visible light (no lines discernible on the VUV spectrometers spectra). We also used the visible spectroscopy system for impurity content indicator. We first monitor the D line at 656.1 nm to give some information regarding the timing and the efficiency of the breakdown since the deuterium is the first species to be ionised during the current ramp up. We also monitor impurities in the 400 nm spectral range as shown in figure 7 that exhibits a spectrum acquired just after a venting. The spectrum reveals the presence of N II and O II lines but also Cl II lines that were consistent with a strong chlorine signal on the mass spectrometer measurements. A PVC object was accidentally left inside the vessel, after its removal the chlorine signals dropped significantly on both measurements. Once the breakdown
attempts phase was over, the plasma current reached quickly about 500 kA generating hotter plasmas and making the visible radiating layer moving at the edge of the plasma. It permitted the use of visible spectroscopy for source measurements.
FIG 7: Breakdown spectrum (10 ms exposure time)
B. Sources study on inner bumper and outboard limiter
First sources measurements were done on both inner bumper and outboard limiter in the 400 nm and 656 nm wavelength ranges. Figure 8 shows a typical spectrum measured by an equatorial LOS on the outboard limiter. One can observe that the 0.1 nm FWHM resolution is sufficient to discriminate most of the lines and namely the W I line at 400.9 nm. One can also notice in the various lines identified the presence of Mo I that is used as interlayer coating for the W coating on graphite tiles. The presence of Mo source is a consequence of tiles damaged during the runaway electron events. Carbon sources were also observed from the inner bumper coated tiles during the high field side limited plasma phases.
FIG 8: Outboard limiter spectrum (6 ms exposure time)
Our first W source analysis is summarized in the figure 9 that shows both W I and Mo I lines profiles along the outboard limiter sideways with a poloidal section showing the last closed magnetic surface, the outboard limiter position and the geometry of the visible spectroscopy LOS. With the radiance calibration procedure applied, we find for the W I line a radiance of 3×10¹⁶ Photon/(m².sr.s) for the maximum, the lower radiance measured with acceptable signal to noise ratio being about
2×10¹⁵ Photon/(m².sr.s) in accordance with our initial specifications1 (we still have some margin with the slit width or the camera electronic tuning). The W line profile is less peaked in the equatorial plane than the Mo one due to the fact that the runaway electrons induced more
FIG 9: W I (blue) and Mo I (red) radiances along the outboard limiter
damages in the equatorial plane location. In situ observations confirmed that point. Another interesting point is the radiance drop of both lines just below the equatorial plane (-0.05 m) that corresponds to the location of an embedded outer limiter gas puff injector operated during that pulse. The drop of radiance might be the consequence of a source reduction due to the increase of the local density.
To estimate the W flux Γ𝑊 𝐼 from the photon flux
Γ𝑝ℎ(400.9 𝑛𝑚) = 4π × R(400.9 nm) we use the relation (6)
where we set an S/XB of 20 corresponding to a temperature of 20 eV in multi machine fit from 6.
Γ𝑊= Γ𝑝ℎ(400.9 𝑛𝑚) × 𝑆/𝑋𝐵 (𝑇𝑒) (6)
The W flux finally obtained at the center of the limiter is about 8×10¹⁸ atoms/(s.m²) that is in accordance with W fluxes observed on ASDEX central column with similar gap of a few centimeters 7.
V Conclusion
A first part of the WEST Visible Spectroscopy Diagnostic for sources assessment instrumental setup was commissioned for the first WEST experimental campaign. The outboard limiter and inner bumper views were successfully aligned and calibrated in radiance in the challenging context of the patch panel feature that permits to dispatch the LOS on various detection systems. Those two views primarily provided first information about impurity content during the breakdown attempts phase and about W sources later in the campaign. The first W source measurements permitted to demonstrate that the system is operating in accordance with the initial specifications and that the values measured are comparable to ASDEX. At the moment of the paper submission, divertor views are being commissioned to complete the initial experimental setup in view of the C3 campaign next summer.
VI. ACKNOWLEDGMENTS
This work has been carried out within the framework of the EUROfusion Consortium and has received funding from the Euratom research and training programme 2014-2018 under Grant Agreement No. 633053. The views and opinions expressed herein do not necessarily reflect those of the European Commission.
1 O. Meyer, Rev. Sci. Instrum. 87, 11E309 (2016) 2 J. Bucalossi et al., Fusion Eng. Des. 86, 684–688 (2011). 3 R. J. Colchin et al, Rev. Sci. Instrum. 74, 2068 (2003) 4 N. Den Harder et al 2016 Nucl. Fusion 56 026014
5 T. Abrams et all IEEE Transactions on Plasma Science, vol. 46, no. 5,
pp. 1298-1305 (May 2018)
6 G.J. van Rooij et al. , Journal of Nuclear Materials 438 (2013) S42–S47 7 R. Neu, Plasma Phys. Control. Fusion 49 (2007) B59–B70