Total and partial pressure measurements for the Sulphur-Iodine
thermochemical cycle
D. Doizi*, V. Dauvois*, J. L. Roujou*, V. Delanne*, P. Fauvet*, B. Larousse*, O. Hercher*, P. Carles*, C. Moulin*, J. M. Hartmann**.
*Department of Physical Chemistry, CEA, CE Saclay, 91191 Gif sur Yvette CEDEX, FRANCE.
** LISA, Faculté des Sciences et Technologie, 61 avenue du Général de Gaulle, 94010 Créteil CEDEX, FRANCE.
Abstract:
First results on the measurement of total and partial pressures over the ternary system HI-I2
-H2O are reported. Using original optical online measurements, data on the gas phase
speciation are obtained which will help to scale and optimize the reactive distillation column we promote for the HI section of the Sulphur-Iodine cycle.
Nomenclature: FT-IR: Fourier Transform InfraRed, SRD: Spontaneous Raman Diffusion, CARS: Coherent AntiStokes Raman Spectroscopy.
Keywords: hydrogen production; Sulphur-Iodine thermochemical cycle
1. Introduction
The explosion in the energy demand, the exhaustion of fossil resources and the global warming due to a runaway greenhouse effect promote hydrogen as a new energy carrier. For a massive production of hydrogen, the use of nuclear energy appears attractive.
ln the framework of generation IV, the Nuclear Energy Division of the French Atomic Energy Authority CEA has decided to evaluate the possibility to use nuclear energy and thermochemical cycles [1-2] for the massive production of hydrogen [3]. Among the various available cycles, the Sulphur-Iodine cycle [4-5] has been chosen because it is purely thermochemical, shows a good coupling capability to a Very High Temperature nuclear Reactor, is internationally studied and has a potential good efficiency as well as low cost. This cycle is under evaluation versus high temperature electrolysis or hybrid cycles.
This work is conducted with partners such as Sandia National Laboratory and General Atomics, USA via an I-NERI collaboration agreement, and with European partners in a Specific Targeted Research Project named HYTHEC [6] in the sixth Framework Program on Research, Technological Development and Demonstration.
* Corresponding author: tel : 33 1 69 08 68 52, fax : 33 1 69 08 54 11 E-mail address: ddoizi@cea.fr
2. The Sulphur-Iodine cycle
The Sulphur-Iodine cycle is based on the following chemical reactions:
) 7 ( ] 870 [ 2 1 ) ( ) ( ) 6 ( ] 400 [ ) ( ) ( ) ( ) 5 ( ] 360 [ ) ( ) ( ) 4 ( ] 300 [ ) 4 ( ) ( ) 4 ( ) 3 ( ] 330 [ ) ( ) 2 ( ) 2 ( ] 230 [ ) 8 10 ( ) 2 ( ) 8 10 2 ( ) 1 ( ] 120 [ ) 4 ( ) 8 10 2 ( ) 16 ( ) ( ) 9 ( 2 2 3 2 3 4 2 4 2 4 2 2 4 2 2 4 2 1 2 2 2 2 2 2 2 2 4 2 2 2 2 2 2 C O SO SO C O H SO SO H C SO H SO H C O H SO H O H SO H L C I H HI C I O H HI I O H HI L C O H SO H I O H HI O H SO I g g g g g g l l l l l g l g l l l l g l
Reaction (1), named Bunsen reaction, is an exothermic reaction in liquid phase which produces two aqueous non miscible acidic phases:
L1, which is the upper sulphuric acid phase and
L2, the lower phase named HIx which contains a mixture of iodhydric acid, iodine and water.
In reaction (2), HI is removed from the L2 phase. This separation is the most important for the efficiency of the cycle. Reaction (3) is the thermal decomposition of HI. Reactions (5) to (7) occur in the vapour phase and lead to the decomposition of H2SO4 into H2O, SO2 and O2.
Iodine and sulphur dioxide are recycled to the Bunsen reaction.
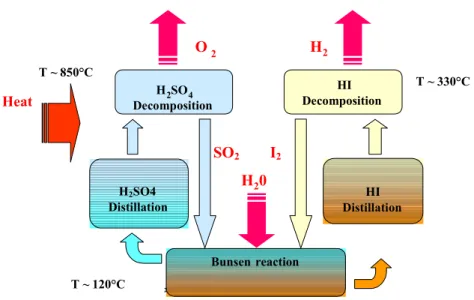
The Sulphur-Iodine cycle, which is schematically represented on figure 1, is composed of three sections:
- the Bunsen section,
- the HIx section,
- and the H2SO4 section.
Figure 1: General scheme of the Sulphur-Iodine cycle
HIx section is the most important one for the overall efficiency of the cycle. Three main difficulties are identified:
- the presence of an azeotrope in the binary mixture HI-H2O, which prevents a high
concentration of HI, SO2 I2 H2SO4 Distillation H2SO4 Decomposition H2 H20 HI Decomposition HI Distillation T ~ 120°C T ~ 850°C T ~ 330°C Heat O2 Bunsen reaction 2
- the incomplete and slow decomposition of HI into H2 and I2,
- the very large energy demand due to the important calorific capacity of the HIx mixture which contains large amounts of iodine and water.
The direct decomposition of HI in the gaseous phase is normally an incomplete reaction. It involves the circulation of large amounts of products and requires the evaporation of large water quantities.
To overcome this difficulty, RWTH-Aachen [7], in the 80’s, proposed the concept of reactive distillation which allows the distillation of the HIx mixture and the HI decomposition in the same reactor around 330°C.
A liquid-gas equilibrium is obtained in the middle of the column, gaseous hydrogen is collected at the top of the column and iodine is made soluble in the liquid phase at the bottom of the column. This concept of reactive distillation allows to change the non favoured decomposition of HI:
2 HI(g) H2(g) + I2(g), G = 11 kJ/mol,
into a thermodynamically favoured reaction where iodine is in the liquid phase: 2 HI(g) H2(g) + I2(l), G = - 29 kJ/mol.
This concept is very interesting from a thermodynamic point of view but remains to be experimentally validated.
To design and optimize the reactive distillation column that CEA has chosen to promote, a good model is necessary to describe the liquid vapour equilibrium of HIx mixtures. At the present time, the model used in CEA relies on total pressure measurements.
For an optimal design of the reactive distillation column, it is necessary to exactly calculate the vapour fluxes for H2O, HI and I2 which will be evaporated at each plate of the column.
Hence, the knowledge of the partial pressures of the species in the vapour phase for a wide concentration domain of the liquid phase is necessary. It starts from quasi pure iodine (bottom of the column) to a HI-H2O binary mixture with iodine traces at the top of the column.
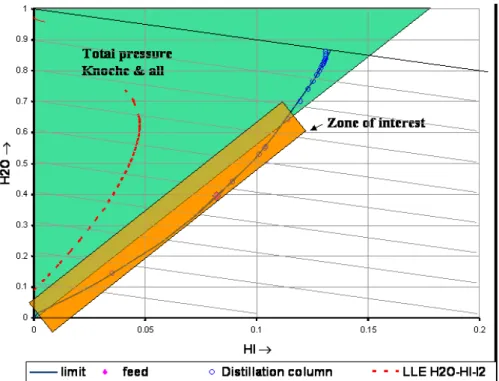
Figure 2 shows the domain of interest for the pressure measurements. Total pressure measurements carried out by Knoche [8] are available in the green domain. The domain to be explored for the reactive distillation column is the orange one for which no data are available.
Figure 2 : Domain of interest for the pressure measurements The specifications for the domain of interest are:
- temperature: 20°C < T < 320°C ;
- total pressure: 0 < P < 100 bars (in most cases below 50 bars).
- liquid phase composition (molar %):
5 % < [I2] < 60 %
15 % < [HI] /([HI] + [H2O]) < 18%
With such liquid compositions, vapour compositions are expected to be:
- 10% < [I2] < 30% (around 1020 atoms/cm3), - 0 % < [HI] < 50%,
- H2O: complement.
Species concentrations in the vapour phase are very high.
The total pressure knowledge is necessary to characterize the azeotrope compositions and the partial pressures knowledge (concentrations in the vapour phase) is necessary to optimize the separation of HI from H2O and I2.
3. Experimental approach
The total and partial pressure vapour measurements over the ternary mixture HI-I2-H2O are
difficult for two reasons:
The very high concentration of the species in the vapour phase,
The experimental conditions: high temperatures and pressures and very corrosive media.
These two types of difficulties have led to:
- On the one hand, the selection, the development and the qualification of appropriate analytical diagnostics for the vapour phase speciation.
- On the other hand, the conception, design and building of experimental devices able to contain these corrosive and concentrated mixtures.
A three step approach based on three experimental devices (I1, I2 and I3) has been developed. I1 is an experimental device devoted to the measurement of the total pressure in order to find the HI-H2O azeotropic concentrations versus temperature and iodine
concentration.
I2 is an experimental device devoted to the qualification of the analytical diagnostics for partial pressure measurements up to 130°C and around the atmospheric pressure. I3 is an experimental device under construction devoted to the partial pressure
measurements of the HIx mixtures in the whole process domain.
4. Choice and validation of “online” diagnostics
Among the various potential analytical diagnostics, offline and on line diagnostics can be distinguished. Offline analytical techniques consist in taking samples of the vapour phase to characterize it by titration after condensation [9]. Optical online diagnostics have been chosen to avoid tedious experiments and not to alter the vapour composition.
These optical techniques themselves may also be classified in two types:
Those resonant with the vapour phase (the electromagnetic beam is absorbed by the vapour, according to Beer Lambert law), such as UV-Visible or FT-IR spectrometry, Those non resonant with the vapour phase (the detected signal increases with the
concentration of the species) such as Raman spectroscopies.
UV-Visible spectrometry has been chosen for the measurement of iodine concentration and FT-IR spectrometry has been chosen for the measurement of hydrogen iodide and water concentrations. Raman spectroscopies are potential optical techniques for the detection of all species at once.
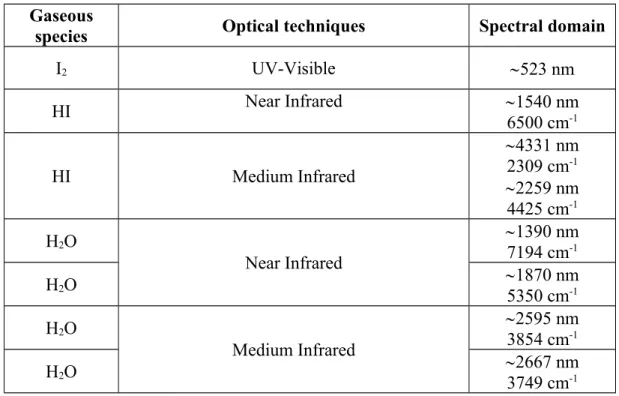
Table 1 summarizes the selection of the analytical resonant optical techniques that was made, the gaseous species to which they apply and the spectral domain identified for the measurements. These techniques have to be validated.
Gaseous
species Optical techniques Spectral domain
I2 UV-Visible 523 nm HI Near Infrared 1540 nm 6500 cm-1 HI Medium Infrared 4331 nm 2309 cm-1 2259 nm 4425 cm-1 H2O Near Infrared 1390 nm 7194 cm-1 H2O 1870 nm 5350 cm-1 H2O Medium Infrared 2595 nm 3854 cm-1 H2O 2667 nm 3749 cm-1
Table 1: Potential optical resonant techniques for the vapour speciation
Validation of the use of resonant techniques
The entire methodology for the selection, development and validation of the optical online techniques will be described in an other paper.
Briefly, UV-Visible and FT-IR spectrometry have been validated on pure substances and on binary HI-H2O mixtures:
up to 2 bars for iodine measurements.
Figure 3 shows the experimental pressure measurements versus temperature made for iodine in glass cells. Three different measurement devices were used:
an Ocean Optics HR 2000 spectrometer, a Cary 50, Varian, spectrometer,
a home-made diode laser absorption set up.
A good agreement between experimental and Thermo-Calc calculated values [10] is observed up to two bars.
Figure 3 : Iodine pressure measurements versus temperature
Around 1 bar for pure hydrogen iodide, pure water and the azeotropic HI-H2O binary
mixture using FT-IR spectrometry with a Bruker Vector 22 spectrometer. The calculation of the species concentrations is made following two approaches:
- using reference cells containing species with known equilibrium pressures and the FT-IR Bruker spectrometer Opus software,
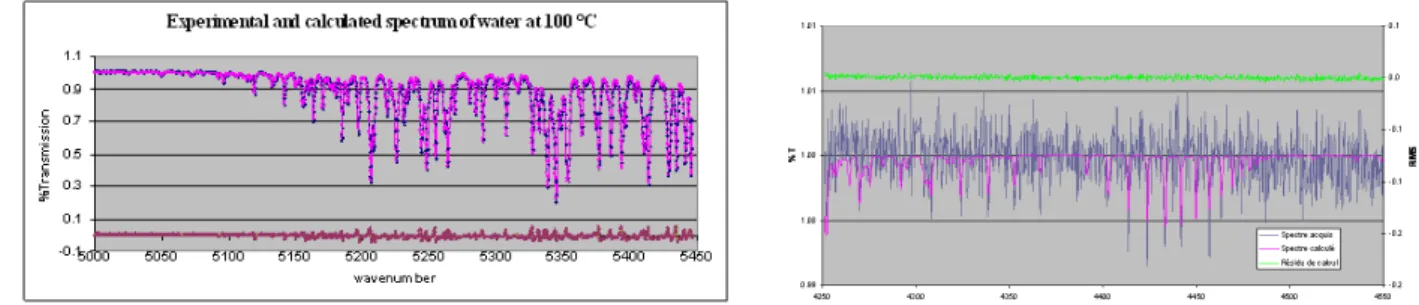
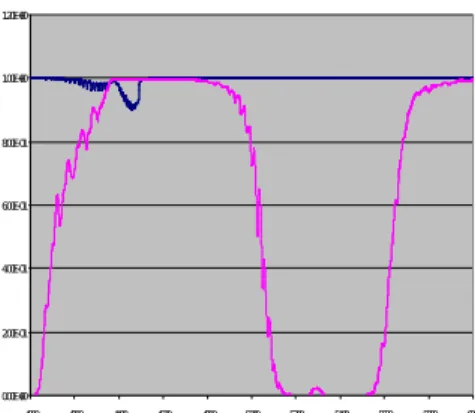
- using a model, based on HITRAN spectroscopic database, which has been developed for the process domain [11] where the use of reference cells will no longer be possible. For example, using this model, figures 4 and 5 show the results obtained for an azeotropic 15 % molar HI-H2O mixture around 100°C. The lines show the experimental FTIR spectra on the
appropriate spectral domains and the points represent the fit using the model. The curve of the residues shows the very good agreement between experience and modelling.
The accuracy between experiment and theory is around 20 % for hydrogen iodide (very weak signal) and it is below 10 % for water vapour.
Figure 4: Experimental and calculated FT-IR spectrum of H2O vapour at 100°C over the 15 %
molar HI-H2O mixture.
Figure 5: Experimental and calculated FT-IR spectrum of HI vapour at 120°C over the 15 % molar HI-H2O mixture.
For the whole process domain, the former optical diagnostics will be used after a careful choice of the optical pathlengths using the model for the prediction of FT-IR spectra. Figure 6 shows the FT-IR spectrum calculated at 50 bars and 600 K for HI (blue curve) and H2O (pink
curve). I2 Vapour pressure 1,0E-03 1,0E-02 1,0E-01 1,0E+00 1,0E+01 1,0E+02 1,0E+03 1,0E+04 200 250 300 350 400 450 500 temperature K p re ss u re i n m b a r Theoretical curve
Ocean optics spectrometric measurements Cary 50 spectrometric measurements Diode laser spectrometric measurements
It shows the existence of a spectral window (around 4000 cm-1) allowing the determination of
HI without any interference of water vapour.
Figure 6: Calculated FT-IR spectra of HI (blue curve) and H2O (pink curve) at 50 bars and
600 K.
Non resonant techniques are under evaluation and will be described in an other paper.
Table 2 summarizes the “online” optical techniques under evaluation, their field of application, the obtained and expected precisions and their relative cost.
Table 2: Grid of choice for the online optical techniques
5- I2 experimental device
In addition to the validation of online optical techniques on pure species and binary mixtures, the main objective of the I2 device is to measure the total and partial pressures up to 130 °C and 2 bars of the HIx mixtures using these optical ”online” techniques.
The I2 device is composed of a glass cell equipped with two different optical pathlengths: - a long optical pathlength for hydrogen iodide and water FT-IR measurements, - a short optical pathlength for iodine UV-Visible measurement.
It is equipped with a total pressure gauge, EBRO VM 2000.This glass cell and the reference cells are placed in a Memmert thermoregulated oven. The cells are placed on a mobile chariot to be successively aligned on the infrared beam to do the absorption measurements.
Figure 7 shows the photograph of the I2 device inside the oven. 0.00E+00 2.00E-01 4.00E-01 6.00E-01 8.00E-01 1.00E+00 1.20E+00 4000 4200 4400 4600 4800 5000 5200 5400 5600 5800 6000 Very expensive -To be defined I2, I3 -I2, HI, H2O, H2 CARS expensive -To be defined I2, I3 + I2, HI, H2O, H2 SRD medium 5 % 10 % I2, I3 ++ HI, H2O FTIR spectrometry low 10 % 30 % I2, I3(?) ++ I2, HI UV-Visible absorption spectrometry Cost Precision expected Precision obtained Suited to steps Validation estimation Species Techniques Very expensive -To be defined I2, I3 -I2, HI, H2O, H2 CARS expensive -To be defined I2, I3 + I2, HI, H2O, H2 SRD medium 5 % 10 % I2, I3 ++ HI, H2O FTIR spectrometry low 10 % 30 % I2, I3(?) ++ I2, HI UV-Visible absorption spectrometry Cost Precision expected Precision obtained Suited to steps Validation estimation Species Techniques
Figure 7: Photograph of the I2 device .
6- Experimental program in I2 device
The experimental device I2 has been defined first, to validate the choice of the “online” optical techniques and second, to realize the first experiments on total and partial pressure measurements around the atmospheric pressure.
After initial experiments on pure substances, binary mixtures and then ternary mixtures were studied following a specific experimental design analysis.
6.1) Binary mixtures HI-H2O:
Three binary mixtures were studied:
- the azeotropic mixture of H2O with 15.7% molar HI,
- a mixture of H2O with 22.2% molar HI,
- a mixture of H2O with 7.2 % molar HI for which only total pressure measurements
were done.
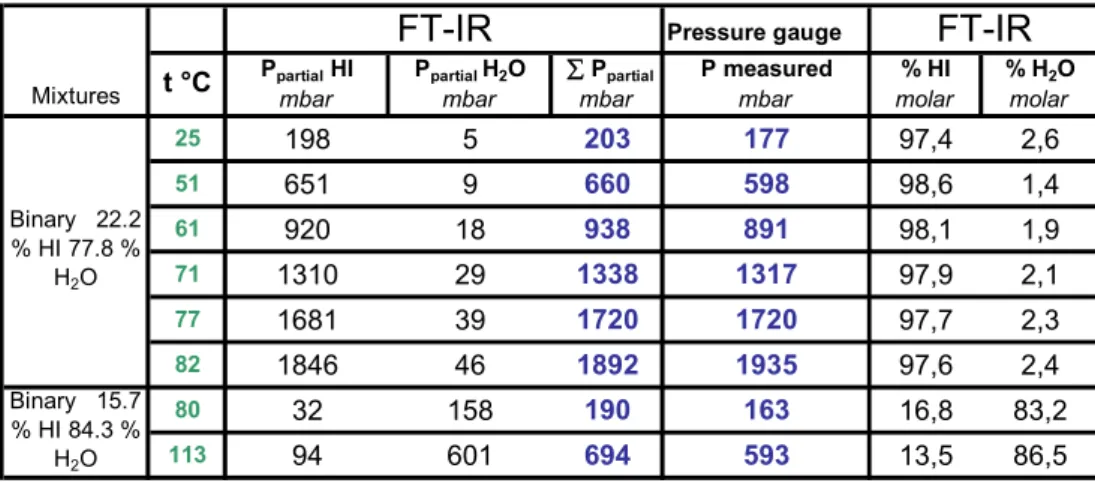
Table 3 summarizes the experimental results.
Pressure gauge
Ppartial HI Ppartial H2O Ppartial P measured % HI % H2O
mbar mbar mbar mbar molar molar
25 198 5 203 177 97,4 2,6 51 651 9 660 598 98,6 1,4 61 920 18 938 891 98,1 1,9 71 1310 29 1338 1317 97,9 2,1 77 1681 39 1720 1720 97,7 2,3 82 1846 46 1892 1935 97,6 2,4 80 32 158 190 163 16,8 83,2 113 94 601 694 593 13,5 86,5 Binary 15.7 % HI 84.3 % H2O Mixtures FT-IR FT-IR Binary 22.2 % HI 77.8 % H2O t °C
Table 3: Experimental results for two binary mixtures HI-H2O
This table contains the temperature of the experiment, the total pressure measured with the pressure gauge, the partial pressure calculated from FT-IR spectra (using Bruker Opus
software and the data from the reference cells) and the calculated molar composition of the vapour phase.
The sum of the partial pressures is in good agreement with the total pressure measured by the pressure gauge.
As expected, for the azeotropic 15.7 % molar HI-H2O mixture, the liquid and vapour phases
have nearly the same composition. Beyond this azeotrope composition, the vapour is very rich in hydrogen iodide (>97%).
Figure 8 summarizes the results of total pressure obtained on pure and binary mixtures and their comparison with the values tabulated in the literature.
Figure 8: Total pressure measurements: comparison between experimental and calculated (Aspen code) values [12].
Up to the azeotrope composition, the agreement between our values and the literature values is excellent. Beyond the azeotrope composition, no literature values are available. The total pressure calculated using models is lower than the total pressure measured. For example, using Prophy model [13], at 82°C, the calculated total pressure is 1463 mbar compared to a total pressure measured of about 1935 mbar.
Prophy model is based on Neumann‘s thermodynamic model [14] used to describe the HI-I2
-H2O-H2 reactive liquid-liquid-vapour system.
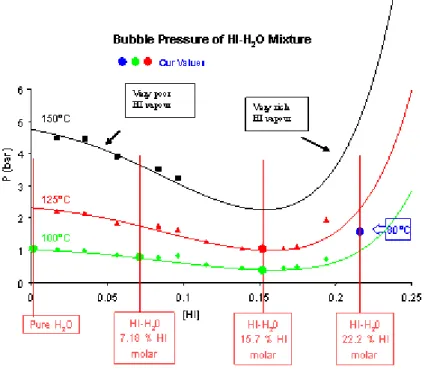
6.2) Ternary mixtures
HI-I2-H2O ternary mixtures have been studied for various iodine and hydriodic acid
compositions.
Total pressure measurements have been made first to localize the position of the azeotropes
and to compare the results with the experimental values of Knoche and Neumann [8,14]. For three different iodine concentrations, the total pressure has been measured around 130°C for
compositions have been corrected to take into account the depletion of the concentration of each species due to its vaporization.
Figure 9: Total pressure measurements around 130°C: comparison of experimental results and literature.
( Our experimental points for three 85, 65, 39 % molar iodine concentrations, * Neumann experimental points [14], ▲total pressure minima according to Knoche [8]). The position of the total pressure minima is in good agreement with the results of the literature [8,14]. The total pressure value at this minimum is slightly different for high iodine content [8].
For a fixed iodine content equal to 39 ± 0.5 %, (corrections of mixture composition are taken into account), total pressure values (sum of partial pressures) were compared with Prophy model utilized in the Prosim code. The results of this comparison are shown on the figure 10.
9,5 10,0 10,5 11,0 11,5 12,0 12,5 13,0 0 100 200 300 400 500 600 700 800 900 1000 1100 1200 1300 1400 1500 1600 1700 Our measurements Prophy calculations Neumann value M ea su re d to ta l p re ss ur e (m ba r) [HI] molar %
Figure 10: Total pressure experiments versus [HI] for [I2] equal to 39 ± 0.5 % around
The agreement between Prophy model and our experimental values is good around Neumann point on the left of the total pressure minima. This is certainly due to the fact that this model utilizes the experimental values of Neumann.
On the right of the total pressure minima, our measurements exhibit a sharper profile than the one predicted by the model.
Partial pressure measurements have been carried out using FTIR and UV visible absorption
measurements described previously. For iodine content close to the Bunsen exit (~39 %), three initial HI concentrations have been studied: 9.6 %, 11.67 % and 13.11 %.
The results are summarized in table 4. This table contains the corrected concentration values of each species, the temperature of the experiments, the partial pressures calculated with Bruker Opus software from the experimental FTIR spectra of HI and H2O, the partial pressure
of iodine measured with the Ocean Optics spectrometer (except for the first mixture). The sum of the partial pressures is compared with the total pressure measured with the pressure gauge. The experimental results are then compared with Prophy model.
Table 4: Partial pressure measurements for three ternary initial liquid compositions
For all the liquid compositions tested, there are noticeable differences between our experimental values and the values calculated using Prophy model for the compositions of the gaseous phase. However, the model gives good trends, especially for HI concentration: this one is very low on the left of the azeotrope, and increases at the azeotrope and more particularly on the right of the azeotrope.
5- Conclusions and perspectives
An original approach developed to measure the total and partial pressures over the ternary HI-I2-H2O mixture has been presented.
The first results on the study of the liquid vapour equilibrium of the HI-I2-H2O ternary
mixtures around 1 bar and 130°C obtained in the experimental device I2 have been presented. Concerning total pressures, there is a good agreement between the results presented in this study and those previously obtained by Neumann and Knoche. Concerning partial pressures, the results of this study clearly indicate the need for a better knowledge of the vapour speciation for HI concentration especially for liquid compositions higher than the one of the azeotrope composition for each iodine concentration.
An experimental design analysis for various iodine concentrations is in progress which will provide complete data to build a reliable model of the ternary HI-I2-H2O mixtures essential to
6- References
[1] Funk, J. E., Thermochemical hydrogen production : past and present, Int J Hydrogen Energy, 2001, 26: 185-190.
[2] H.Norman, J.H., Besenbruch, G. E., Brown, L. C., O’Keefe, D. R., Allen, C. L., DOE Contract N° DE-ATO3-83SF11929, GA-A18257 (1982).
[3] Vitart, X., Thermochemical production of hydrogen. Nuclear Production of Hydrogen. Technologies and Perspectives for Global Deployment. Chapter 4. International Nuclear Societies Council. Current Issues in Nuclear Energy Series. Editors : Masao Hori, Jorge Spitalnik. November 2004. ISBN : 0-89448-570-9.
[4] Onuki, K., Nakajima, H., Ioka, I., Futakawa, M., Shimizu, S., IS process for thermochemical hydrogen production, JAER-Review 94-006, 1994.
[5] Goldstein, S., Borgard, J. M., Vitart, X., Upper bound and best estimate of the efficiency of the iodine sulphur cycle. Int J Hydrogen Energy, 2005; 30(6): 619-626.
[6] Le Duigou, A., HYTHEC: an EC funded search for a long term massive hydrogen production route using solar and nuclear technologies. Int J Hydrogen Energy, submitted. [7] Roth, M., Knoche, K. F., Thermochemical water splitting through direct HI decomposition from H2O/HI/I2 solutions. Int J Hydrogen Energy 1989; 14: 545-549.
[8] Engels, H., Knoche, K. F., Vapour pressures of the system HI/H2O/I2 and H2.
Int. J. of Hydrogen Energy, 1996; 11: 703-707.
[9] Berndhäuser, C., Knoche, K. F., Int J Hydrogen Energy 1994; 19(3): 239-244. [10] Thermo-Calc software, www.thermocalc.com
[11] Hartmann, J. M., Bouanich, J., P., Boulet, C., Bulanin, M. O., Domanskaya, A. V., Kerl. K., Self broadening and shifting of HI lines in the 1-0 and 2-0 infrared bands, J. of Quant. Spectr.and Rad. Transfer, 2005; 151-163.
[12] Mathias, P. M., Brown L. C., Thermodynamics of the sulfur-iodine cycle for
thermochemical hydrogen production, in: presented at 68th Annual Meeting of the Society of Chemical Engineers, japan, March, 2003.
[13] Prosim software, www.prosim.net
![Figure 10: Total pressure experiments versus [HI] for [I 2 ] equal to 39 ± 0.5 % around 130°C](https://thumb-eu.123doks.com/thumbv2/123doknet/12892053.370696/11.892.205.616.777.1071/figure-total-pressure-experiments-versus-hi-equal-around.webp)
