HAL Id: hal-01117683
https://hal.archives-ouvertes.fr/hal-01117683
Submitted on 17 Feb 2015
HAL is a multi-disciplinary open access
archive for the deposit and dissemination of
sci-entific research documents, whether they are
pub-lished or not. The documents may come from
teaching and research institutions in France or
abroad, or from public or private research centers.
L’archive ouverte pluridisciplinaire HAL, est
destinée au dépôt et à la diffusion de documents
scientifiques de niveau recherche, publiés ou non,
émanant des établissements d’enseignement et de
recherche français ou étrangers, des laboratoires
publics ou privés.
Reconsidering Corporate Ratings
Bertrand Hassani, Xin Zhao
To cite this version:
Documents de Travail du
Centre d’Economie de la Sorbonne
Reconsidering Corporate Ratings
Bertrand H
ASSANI,Xin Z
HAOReconsidering Corporate Ratings
Bertrand Hassani
∗and Xin Zhao
†Abstract
In this paper, a new corporate ratings methodology is proposed. In this innovating approach cor-porate ratings are calibrated from data with different frequency in two-steps. Information of firms’ credit quality from annual accounting ratios and daily credit derivative spreads yields are combined through a Bayesian approach. To test the performance of this new rating, an empirical analysis is carried out on a sample of 197 public traded international corporations with credit ratings from the big-three credit rating agencies. The ratings generated from the presented approach perform better than the ratings from the external agencies as it is more representative of companies’ credit quality over time, therefore this approach is a suitable alternative to internal rating methods.
JEL: C23; E44; G15
Keywords: Corporate Rating, Market Implied Rating, Corporate Bond Yields.
1
Introduction
Credit risk is the risk that counterparts default on their obligations, i.e. the risk that a debtor cannot fulfill his repayment obligations. Credit events include the loss of the principal, the default on interest, cash flows disruption or cost escalation. The losses related to credit events vary in amounts and causes. For example, a company which fails to pay one of it’s employee on the due date for special reason is mechanically considered as default. Therefore, the occurrence of a credit event is not necessarily an evidence of the risk of the investment. In order to limit the risk of losing the money to potentially lent to borrowers, sovereigns, companies, etc, a bank should undertake various verifications and evaluate the potential loss engendered by potential credit events.
Corporate ratings represent key factors for financial institutions to evaluate the credit risk of investing in the rated companies. In the global financial markets, external corporate ratings are issued by credit rating agencies (CRAs). Among the CRAs, the top three (i.e. Moody’s, S&P’s and Fitch’s Rating) occupy more than 95% of the market. The power of CRAs has been showed during the last decade, where the ratings have been applied as a global benchmark of corporate credit risk. For instance, it has been required by Basel II for the calculation of credit capital requirement for certain banks (BIS (1996)[4]). Nevertheless, the late and slow reaction to the default of Enron, Worldcom and Lehman Brother undermined the trust of their ratings from people who relied on them to make investment decisions. The inherent conflict of interesting in the credit rating industry exhibited by Becker and Milbourn (2011)[6] and Bolton et al. (2012)[9] implies many questions on the CRAs. The credit rating crisis of 2007-2008 raised the doubts on CRAs’ credibility. Evidence of “rating shopping” shadowed their reputation (Benmelech and Dlugosz (2010)[7]). Credit risk matters to everyone in the market. Thus, corporate ratings should be precise and accurate. The new regulation and supervision authorities require more prudent rating methodologies (BIS(2011)[5]). Investors, entrepreneur, financial institutions have been relying on and will still rely on credit ratings to make decisions even though the external ratings have been criticised and doubted for long (White (2010)[29]). Trustable evaluations of the creditworthiness of corporations are required by the fast growing market. Therefore, the purpose of this paper is to introduce a new approach which improves the traditional corporate rating methodology and furthermore provides useful credit references to market
∗Group Head of Non-Financial and Operational Risk Methodology, Grupo Santander, [email protected] †University Paris 1 Panth´eon-Sorbonne, CES UMR8174, 106-112 Bd de l’Hoˆpital, 75013, Paris, [email protected]
practitioners.
Two branches of studies have been built up for corporate ratings in literature, the accounting-data-based approach and the market-data-based approach. The first one (the traditional approach) is based on fundamental analysis using accounting data. Altman (1968)[1] introduce the Z-Score model that build the relationship between accounting data and corporate credit quality. Lo (1986)[25] and Altman et al. (1994)[2] extend the analysis to logit models. Kim and Sohn (2008)[23] apply the random effects model for the study of credit rating. The advantages of this approach are intuitive and based on fundamentals. The main drawbacks are the data limitation and time delay. It cannot adjust to or reflect updated information (Heflin et al. (2011)[18]). Financial statements reflect what happened in the past, while market prices are forward looking. An appealing corporate rating, however, should be consistent with the market, such that it will neither bring surprises nor be completely anticipated. Therefore, market-data-based approach arose during the last decades. Ederington et al. (1987)[14] measure the influence of ratings on bond yields; Hull et al. (2004)[20] examine the theoretical relationship among bond yields, CDS spreads and credit rating; Micu et al. (2004)[26] study the link between ratings and CDS using event study method; Daniels and Jensen (2005)[13] use principal component analysis, regression and event study methods to study the relation of CDS spreads, credit spreads and credit rating; Jorion and Zhang (2007)[22] discuss the effect of ratings on stock prices; Flannery et al. (2010)[15] and Hart and Zingales (2011)[17] suggest that CDS spreads are substitutes of credit ratings; Chen et al. (2013) control difference in default risk which are not captured by ratings by a “distance to default” measure according to the Moody’s KMVT M default prediction model with a large data set of CDS spreads. This approach
picks up more subtle and fast-moving changes of credit relevant data, such that market sentiment de-livered through market data can be captured. The drawback is that the stability of ratings may be impaired regarding the higher volatility of market information. Nevertheless, considering the fact that investors prefer to minimise transition costs, rating stability is desired and important. In sum, these two approaches are both based on valuable information of corporate credibility. Each of them has pros and cons. Past analysis proved the importance of both resources of information. The natural of the data frequency, however, brings the difficulty to combine them. The contribution of this paper is to introduce a new approach to combine these two information sets. Using this new approach, we can provide better corporate ratings as more reliable, subjective, efficient, and stable.
As we mentioned, the frequency difference of the accounting data and market data causes the fact that it is difficult to put them in a single model. The solution suggested is to evaluate the credit score from the two information sets separately, and then combine them through credibility theory. To test the per-formance of this new approach, an empirical study is carried out in two steps. In the first step, a sample of accounting data and market values of the corporations rated by the three major CRAs is collected for the study. These data are used to explore the relationships between accounting data, market data and ratings. In the second step, the new ratings averaged from the accounting ratings and CDS ratings are compared to the CRAs’ ratings. This approach has several advantages compared to the traditional ones. The low frequency accounting data and the timeless market data are combined in the estimates which make a rating reflecting both fundamental and market sentiment. Secondly, credibility weight are given to accounting-data-based ratings and market-price-based ratings with respect to the variance of the two ratings in order to obtain a relatively stable rating framework.
The paper is organised as follows. Methodologies of accounting-data-based and market-price-based ratings are expressed in the next section. The algorithm to calculate the weights is also given in Section 2. Our empirical analysis is exhibited in Section 3, while a fourth section concludes.
2
Methodology
This section introduces the methodology to combine market and accounting data to evaluate the credit quality of a company. Table 2 presents the mapping to transform the rating letters1 into numeric values,
labeled as credit scores in this context. Credit scores mapped from the external ratings represent the corporate credit quality evaluated by the CRAs. The notations used in the model are: Rδ, RAcc and
RCDS, which refer to the final ratings, accounting ratings and CDS ratings respectively; Sδ, SAcc and
SCDS, which refer to the final score, accounting score and CDS score.
The objective is to assign appropriate credit scores to companies in order to generate fair ratings. A two-steps approach combining the information obtained from the two data sources is proposed to meet the needs. The underlying idea is a weighted average of the credit score obtained from the two sets of information, as exhibited in the following model:
Sδ,i= wi· SAcc,i+ (1 − wi) · SCDS,i (1)
where Sδ,iis the weighted average of credit scores of corporation i implied from accounting data and CDS
data; SAcc,i and SCDS,i are the credit scores of corporation i derived from accounting and CDS data;
and wi is the weight given to the two basic credit scores.
Accounting Score
According to reports published by the largest CRAs (Samson, S. B. (2008)[27], Cantor et al. (2002)[12], and Hunter et al.(2013)[21]), accounting data is the fundamental resource of their quantitative rating methodologies2. In literature, models based on accounting ratios have been proposed to evaluate the credit risk. On the other hand, CRAs’ ratings have been proved can be explained by the accounting ratios. Based on previous researches, we calibrate the credit score based on accounting data in this sub-section.
SAcc,iin equation (1) is a function of the accounting ratios, e.g. SAcc,i= f (Acci), where Acci is a matrix
of accounting data. Accounting ratios relevant to companies’ credit quality include leverage ratios, debt ratios, liquidity ratios, activity ratios, and profitability ratios (Table 4). Previous studies in this field covered potential models based on linear regression, cross-sectional regression, panel regression, logistic regression and probit regression, etc. The choice of both the methodology and the accounting variables are mainly based on empirical analysis of the explanatory power to history default probability. In the empirical study, we firstly recalibrate CRAs’ quantitative rating methodology. Different models are tested to find the best model to calculate the accounting data based credit scores. Then, the accounting data based credit scores are calculated using the best performance model.
Market Score
There are three alternatives of market information reflecting corporate credit quality: bond markets, equity markets or CDS markets. Among the three potential market information for credit quality of the underlying entities, CDS are considered as a better proxy than bond and equity prices which are intrinsi-cally biased (Norden and Weber (2004) and Hull et al. (2004)). CDS spreads implied credit ratings can quickly adjust themselves to changes in the market (Acharya and Johnson (2007)).
Theoretically, CDS spreads represent pure credit risk. However, in practice there are evidences show-ing that this does not hold in general. The reason of the variation include liquidity, risk appetite, etc. Scneider et al. (2007) find evidence that equity market volatility measured by the VIX index influence the valuation of the CDS. Callen et al (2007) proved that CDS prices are not only decided by the credit
1Since the standard corporate ratings issued by the CRAs are in the alphabetic format, we need to map these letters to
the values which can be used in the study.
quality of the corporation but also by the liquidity of the product and others marginal factors. Therefore, market risk and liquidity risk premiums are considered at that level. In this study, we follow Fitch’s market implied rating approach. CDS values are used as a matrix of the credit quality of the company to derive market implied rating. The approach is extended to filter the market and liquidity risk premium using relevant market information.
SCDS,i is a function of the market data, e.g. SCDS,i = g(CDSi), where CDSi is a matrix of the CDS
relevant market data of company i. The basic relationship is: higher CDS implied credit scores are assigned to the companies with lower CDS values. CDS values are the filtered value of CDS daily prices with respect to liquidity and market risk premia. The spectrum of the corresponding CDS implied credit scores are calibrated based on the history relationship with the CRAs’ rating scores.
Weight and δ Score
The “δ-Rating” is obtained through the average of the accounting data based ratings and market im-plied ratings using the credibility weight ω. B¨uhlmann-Straub method3, the most extensively used and
important model in credibility theory, is applied to compute the weight ω (B¨uhlmann and Alois(2005)). Theorem 1 (B¨uhlmann-Straub). The credibility estimator µ in the simple B¨uhlmann-Straub model:
A.1 The random variables Xkj (j = 1, . . . , n) are, conditional on Θk = ϑ, independent with the same
distribution function Fϑ and conditional moments
µ(ϑ) = E[Xkj|Θk = ϑ],
σ2(ϑ) = V ar[Xkj|Θk = ϑ].
A.2 The pairs (Θ1, X1), . . ., (ΘK, XK) are independent and identically distributed.
is given by µ = ωXi+ (1 − ω)X (2) where ω = n n +σ2 τ2 , σ2= E[σ2(Θ)], τ2= V ar(µ(Θ)). (3) Xi= 1 n n X j=1 Xi,j X = 1 Kn K X i=1 n X j=1 Xij
Practically, in our case, Xj is the rating implied by the market information and X is the fundamental
rating estimated through accounting data. Moreover ω is the weight given to market implied rating and lead to the“δ−rating”, as it is the weighted average of the two previous components.
δ Rating
For the exact same reason mentioned above, the numbers to the letters to give the ratings comparable to the CRAs’ ratings need to be transferred. The ratings from these scores are given by the following mapping: Rδ (or RAcc or RCDS) =
AAA(Stable) if s0< Sδ (or SAcc or SCDS) ≤ s1
AAA(Negative) if s1< Sδ (or SAcc or SCDS) ≤ s2
AAA(Watch Negative) if s2< Sδ (or SAcc or SCDS) ≤ s3
.. .
D(Stable) if sn−1< Sδ (or SAcc or SCDS) ≤ sn−2
D(Negative) if sn< Sδ (or SAccor SCDS) ≤ sn−1
D(Watch Negative) if Sδ (or SAccor SCDS) ≤ sn 3This approach is also called empirical Bayesian method
where s0, s1, · · · , sn are given in Table 3.
3
Empirical Study
In this section, a sample of accounting and market data from 197 public traded companies who are rated by the CRAs and with market data available are collected. These 197 companies are selected from 30 countries worldwide, and cover 35 segments of industry4.
In the first step, we use the data to recalibrate the CRAs’ quantitative credit scoring model. Then, the accounting data based credit scores and market data based credit scores are derived from the sample. Finally, the δ rating are calculated and compared with the CRAs’ ratings.
Accounting Data and Scores
Ratios in Table 4 of the selected 197 corporations are collected from Datastream, which is from 2004 to 2011 on annually basis. For each group of ratio, the accounting ratio with best data quality5are selected.
Leverage ratio is calibrated by liabilities/assets; debt ratio equals total debt/total assets; liquidity ratio equals current asset/liabilities; profitability ratio equals EBIT/assets. Table 6 exhibits statistics of the whole period and sub-period from 2004-2007, and 2008-2011. Table 7 shows statistics of whole sample, and sub-sample of investment and non-investment grade6companies’ financial ratios. The results support
the hypothesis relations listed in Table 4, except for activity ratio. The investment grade corporations have lower leverage and debt ratio, higher liquidity and profitability ratio, and bigger size. There is no significant difference of the growth rate between the two groups.
To recalibrate CRAs’ quantitative rating model, different regression approaches are applied to the sample. The results of the methods are summarized in Table 8 and 9. The p−values and the adjusted R2-values indicate that the accounting data can explain around 30% to 50% of the ratings issued by the CRAs with the simple linear regression. Yet, with logit and probit regression, the explanation power decrease sharply to less than 10%. This observation is consistent with the rating methodologies announced by the CRAs. Their reports state that they assign the rating according to the ordinary level of the ratios, which is closer to linear regression than other regression models. Besides, after 2007 accounting ratios give better explanation to ratings than before in terms of higher adjusted R2-values. It indicates that
the CRAs rely more on the fundamental data than other factors since the start of the crisis.
There is a clear break point for the influence of leverage ratio. Before the year 2007, the higher leverage is considered as a positive sign for the credit quality. Whereas since the crisis, which was blamed for excessive leverage, the high leverage is considered as the factor of credit quality with a negative symbol. Activity ratio, profitability ratio and size played as a positive factor for corporation credit quality through the eight years. Debt ratio had negative sign from 2004 to 2008, but the sign changed to positive after 2009. The interpretation is that during and after the crisis, only those bigger and stronger corporations are able to financing themselves trough raising debt. The companies with weaker credit quality are either forced to reduce their total debt or delist because of the capital chain break. Liquidity ratio show positive sign from 2004 to 2009 but statistically insignificant. After 2010, it had positive sign and significant at 2011. This result is ambiguous. As we known, the new Basel regulation increased the requirement of liquidity ratio for banks. Even through it is not implemented for corporations, there are many cases of bankruptcy during the crisis because of the insufficient cash flow. The inconsistence of this regression results with the fact in the market bring the doubt on the accuracy of the ratings given by the credit rating agencies. Finally, influence of growth rate is not consistent through the years. It is reasonable, because the growth rate depends on the development stage and industry of the corporations which is not
4The list of countries and industries are given in Table 4. 5Best quality in terms of less missing value and outliers.
6A corporation is considered investment grade if its rating is BBB- or higher by Standard & Poor’s and Fitch’s or Baa3
necessarily linear related to the credit quality of the corporation.
To test whether there is difference between the ratings given to investment grade and non-investment grade corporations, we do the same regression to the two sub-groups of the data. The results are listed in Table 10, 11, 12, and 13. There is no significant difference. Moreover, the results of panel regression with pooling, fix effect, random effect, and logit and probit methods are tabulated in table 14. With the simple pooling regression method, the panel data of financial ratios can explain around 30% of the CRAs’ ratings. The R2 of fixed effect, logit and probit regressions are much smaller, which indicate that the
CRAs do not consider the difference in business practices across companies, neither non-linear relation between the accounting ratios and credit quality of the corporations. The R2 of random effect panel regression is around 30% which means that there the ratings measure the changes over time but not across entities. Compare the results between the year 2004-2006 and 2007-2011, there is a clear evidence that the world switched from a leveraging to a deleveraging. Besides, the influence of liquidity ratio is insignificant through the whole period, which indicate that this important credit variable has not been paid enough attention by the CRAs. Across the 8 years, debt ratio showed negative sign; profitability, activity and size are considered as a good signal; the influence of growth rate is still undefined.
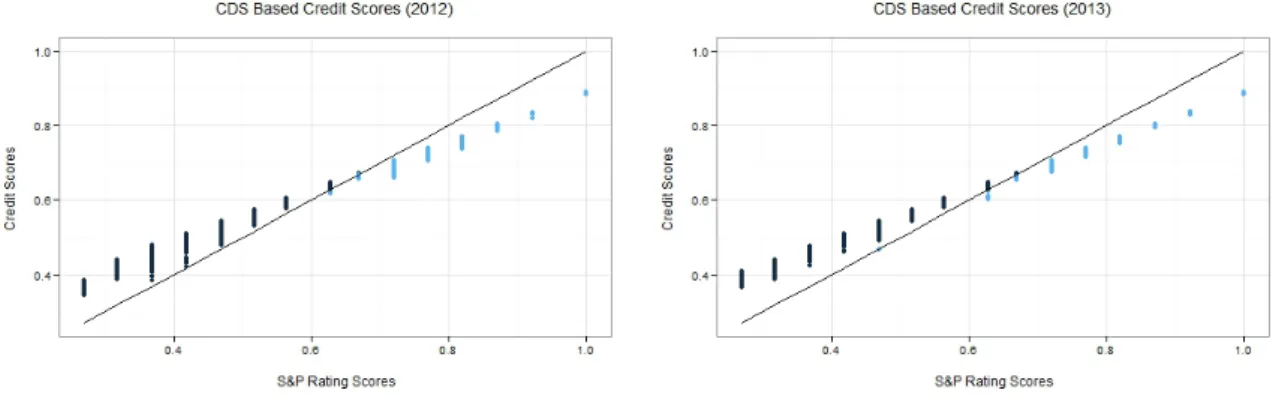
To calculate the accounting data based ratings for the year 2012 and 2013, we collected the same ratios for the sample and use the linear regression model with the data from 2007-2011 to estimate the accounting data based credit scores. The forecast scores using the accounting data are compared with the credit scores CRAs’ ratings. Figure 1 plots the accounting data based scores against the S&P’s rating scores for year 2012 and 2013. Table 16 summaries the difference between the S&P’s rating scores and the forecasted rating scores. The results show that accounting based scores are higher than the S&P’s rating scores at the lower range of credit scores which corresponding to the category of non-investment grade ratings. For the investment grade ratings, at the higher range of credit scores, accounting based scores are lower than the S&P’s rating scores.
Figure 1: Accounting Data Based Credit Scores vs. S&P’s Rating Scores Market Data and Score
The selected companies’ 5 year credit default swap (CDS) daily last price, bid and ask prices are collected from Bloomberg on from the 1st Jan. 2008 to 31th Dec. 2011. Table 15 show the statistics of the sample of CDS last, bid and ask prices by each rating groups according to the Moody’s updated rating at the corresponding data collect date. If CDS prices reflect the credit risk of the corporations as the same way of the CRAs’ ratings, then CDS of the reference entities with similar ratings should be priced similarly or vice versa. Ideally, there should be a clear spectrum where the entity with higher rating has lower CDS prices. The value in Table 15 indicates the level of CDS prices increase with lower ratings which shows a clear relation with market information and CRAs’ ratings on an average level. However, there is not a clear boundary of the CDS value for each rating group. Figure 4 shows the evolvement of the CDS last, bid and ask price series through the time by each rating groups. Figure 5 show the average value
of the select companies’ CDS daily last prices for each rating groups for the last six months’ CDS data and ratings in 2013. A clear fact reflects from the time series plots is that CRAs’ rating is an ordinary risk matrix rather than absolute risk estimation of the credit of the companies. The average CDS prices varies significantly through the three years period within each rating groups. On the one hand, the fact consistent with the CRAs’ principle of issuing the “through the cycle ratings”, on the other hand it reflects market are much more sensitive to the actual credit quality of the entities which serves better investors interesting.
To calculate the implied CDS rating of the selected companies. We collected a larger group of companies’ 5 year CDS data to generate the spectrum of the CDS implied scores. Then, the data of 2012 and 2013 are applied to the generate the CDS implied credit scores. The results are show in Figure 2. Market data implied credit scores show the same trends as the accounting data implied credit scores. Generally, the non-investment grade rated companies’ credit qualities are underestimated with reference to the CDS implied scores. On the other hand, the investment grade rated companies’ credibility are overestimated. For each company, there are around 250 estimation point for the CDS implied credit scores. The companies with lower credit scores tends to have more volatile estimations, which impairs the stability of CDS implied ratings.
Figure 2: CDS Implied Credit Scores δ-Rating
Based on the accounting data implied credit scores and CDS data implied credit scores, the weight w is calculated by equation 3. Thereafter, the weighted averaged score Sδ,i is computed for each company
i. The accounting based credit scores, CDS implied scores, weights and δ-Score of period from July. 2013 to Dec. 2013 are summarized in Table 17 and exhibit in Figure 3. The CDS score is the average market implied SCDS,i for each company, accordingly τ2 is calculated by the 6 months’ variance. Since
accounting based credit scores are much stable compared to CDS implied credit scores, higher weight wi
are given to SAcc,i (Table 17).
Generally, δ-Score follows the same trend as the S&P’s rating scores. The disparity aggravates at the two tails. Taken S&P’s rating scores as benchmark, SAcc,i, SCDS,i and Sδ,i all indicate lower credit quality
at the right tail and higher credit quality at the left tail for most companies. The cut-off line is around 0.55. According to S&P’s rating scores (Table 2), this is coincident with the threshold of investment grate ratings. If a company has the score lower than 0.55, it will fall into the non-investment or ”junk” investment rated groups. Since Sδ,iis the weighted average of SAcc,i and SCDS,i, it is not surprising that
the result follows the same feature as the accounting based credit score and CDS implied credit score. Nevertheless, Sδ,i is more updated compare to SAcc,i and more stable compare to SCDS,i. Through the
weight w, and the time period of calculating SCDS,i and w, the more frequent market information and
less frequent fundamental information of the companies credibility are combined to have a relative stable and updated estimation. This approach provide the flexibility of updating the credit information of the
underlying entity and also abide by the fundamental information of the company.
Figure 3: Credit Scores and S&P’s Rating Scores
4
Conclusion
During last decades, credit rating agencies provided good service to financial market. They contributed to the growing of over the border investment and international investment. Unfortunately, the value of such their ratings has been questioned since the recent financial crisis. Criticism has been raised on the credibility of the ratings. No matter it is because of the potential conflict of interest to earn high fees for the issuers or the dated rating methodologies, the fact is the accuracy of their ratings are quite questionable. In this paper, we studied the corporate ratings through two difference approaches and propose a methodology to updating the credit information of the underlying entity and also abide by the fundamental information of the company.
There are several interested results have been discussed in this study. Firstly, the accounting data are used to recalibrate the CRAs’ rating methodology. After testing all the potential models, we find the simple linear regression can provide the best explanation of their ratings using accounting ratios. The study also shows that the model needs to be updated after the 2007 where the affect of leverage has been changed for evaluating the credit quality of the company. Secondly, the CDS implied ratings are consistent as the CRAs’ on an average level. The lower the CDS value, the higher the ratings of the entity. The diverse happens when it comes to the very high or low rated companies. This scenario is true for all the approaches which include the accounting data implied ratings, market data implied ratings and the δ-ratings. This finding can help to explain the cases when the highly rated “AAA” companies suddenly fallen into the bottom. But what is also interested is the underestimations on the other tails, which indicated the potential investment opportunities might be underrated.
In brief, the results consistently proved the bias of CRAs’ ratings and provide several approaches to adjust the CRAs’ ratings. It is true that only using quantitative modeling cannot capture the complex structure of the credibility of the companies, but the experts adjustments should follow the correct logic
and have strong rational rather than driven by the short-term benefits.
References
[1] Altman, E. I. (1968) Financial ratios, discriminant analysis and the prediction of corporate bankruptcy, The Journal of Finance, 23(4): 589-609.
[2] Altman, E. I., Agarwal, A. and Varetto, F. (1994) Corporate Distress Diagnosis: Comparisons Using Linear Discriminant Analysis and Neural Networks, Journal of Banking and Finance 18.
[3] Altman, E. I. and Rijken, H. A. (2004) How rating agencies achieve rating stability. Journal of Banking and Finance 28, 2679-2714.
[4] Amendment to the Capital Accord to Incorporate Market Risks (1996) Basle Committee on Banking Supervision.
[5] Basel III: A global regulatory framework for more resilient banks and banking systems (2011) Basle Committee on Banking Supervision.
[6] Becker, B. and Bilbourn, T. (2011) How did increased competition affect credit ratings ? Journal of Financial Economics, 101, 493-514.
[7] Benmelech, E. and Dlugosz, J. (2010) The Credit Rating Crisis, NBER Macroeconomics Annual, 24: 161-207.
[8] Blume, M. E., Lim, F. and Mackinlay, A. C. (1998) The Declining Credit Quality of U.S. Corporate Debt: Myth or Reality? The Journal of Finance, 4: 1389-1413.
[9] Bolton, P., Freixas, X. and Shapiro, J. (2012) The credit ratings game. The Journal of Finance, 67(1), 85-112.p
[10] B¨uhlmann, H. and Alois G. (2005) A Course in Credibility Theory, Springer-Verlag, New York. [11] Chen, R., Cheng, X. and Wu, L. (2013), Dynamic Interactions Between Interest Rate, Credit, and
LIquidity Risks: Theory and Evidence from the Term Structure of Credit Default Swap Spreads. Review of Finance 17 (1): 403-441.
[12] Cantor, R., Fons, J. S., Mahoney, C. (2002) Understanding Moody’s Corporate Bond Ratings And Rating Process, Moody’s Investors Service Global Credit Research, Special Comment, New York. [13] Daniels, K. N. and Jensen, M. S. (2005) The Effect of Credit Ratings on Credit Default Swap Spreads
and Credit Spreads. Journal of Fixed Income, 15(3): 16-33.
[14] Ederington, L. H., Yawitz, J. B. and Roberts B. E. (1987) The informational content of bond ratings, The Journal of Financial Research, 10(3): 211-226.
[15] Flannery, M., Houston, J. and Partnoy, F. (2010) Credit default swap spreads as viable substitutes for credit ratings, University of Pennsylvania Law Review, 158, 2085-2123
[16] Goh, J.C. and Ederington, L. H. (1993) Is a Bond Rating Downgrade Bad News, Good News, or No News for Stockholders? The Journal of Finance 48(5): 2001-2008.
[17] Hart, O. and Zingales, L. (2011) A new capital regulation for large financial institutions, American Law and Economics Review, 13(2), 453-490.
[18] Heflin, F., Shaw, K. W. and Wild, J. J. (2011) Credit ratings and disclosure channels, Research in Accounting Regulation, 23:20-33.
[19] Hull, J. nad White, A. (2000) Valuing Credit Default Swaps I: No Counterparty Default Risk. Journal of Derivatives, 8: 29-40.
[20] Hull, J. C., Predescu, M. and White, A. (2004) The Relationship Between Credit Default Swap SPreads, Bond Yields, and Credit Rating Announcements, Journal of Banking & Finance, 28(11): 2789 - 2811.
[21] Hunter, R., Oline, M., Kastholm, D., and Steel, A. (2013) Corporate Rating Methodology, FitchRat-ings, Master Criteria, Global.
[22] Jorion, P. and Zhang, G. (2007) Information effects of bond rating changes: The role of the rating prior to the announcement, The Journal of Fixed Income, 16(4): 45-59.
[23] Kim,Y., and Sohn, S. (2008) Random effects model for credit rating transitions, European Journal of Operational Research, 184: 561-573.
[24] Lando, D. (2004) Credit Risk Modeling. Princeton University Press, Princeton and Oxford.
[25] Lo, A. W. (1986) Logit Versus Discriminant Analysis: A Specification Test and Application to Corporate Bankruptcies, Journal of Econometrics, 31: 151-178.
[26] Micu, M., Remolona, E. and Wooldridge, P. (2004) The price impact of rating announcements: Evidence from the credit default swap market, BIS Quarterly Review June, 55-56.
[27] Samson, S. B. (2008) Corporate Ratings Criteria, Standard & Poor’s, McGraw-Hill Inc., New York. [28] Sobehart, J., Keenan, S. and Stein, R. (2000) Benchmarking Quantitative Default Risk Models: A
Validation Methodology, Moodys Investors Service.
[29] White, L. J.p (2010) Markets: The credit rating agencies, The Journal of Economic Perspectivres, 24(2), 211-226.p
S&P Moody’s Fitch
AAA Aaa AAA Prime
AA+ Aa1 AA+
High Grade
AA Aa2 AA
AA- Aa3
AA-A+ A1 A+
Upper Medium Grade
A A2 A
A- A3
A-BBB+ Baa1 BBB+
Lower Medium Grade
BBB Baa2 BBB
BBB- Baa3
BBB-BB+ Ba1 BB+
Non-Investment Grade Speculative
BB Ba2 BB BB- Ba3 BB-B+ B1 B+ Highly Speculative B B2 B B- B3 B-CCC+ Caa1 CCC+ Substantial Risks CCC Caa2 CCC CCC- Caa3 CCC-CC Ca CC Extremely Speculative C C D C DDD In Default DD D
1 AAA Stable 0.67 BBB+ Watch Positive 0.34 B+ Negative
0.99 AAA Negative 0.66 BBB+ Positive 0.33 B+ Watch Negative
0.98 AAA Watch Negative 0.65 BBB+ Stable 0.32 B Watch Positive
0.97 AA+ Watch Positive 0.64 BBB+ Negative 0.31 B Positive
0.96 AA+ Positive 0.63 BBB+ Watch Negative 0.3 B Stable
0.95 AA+ Stable 0.62 BBB Watch Positive 0.29 B Negative
0.94 AA+ Negative 0.61 BBB Positive 0.28 B Watch Negative
0.93 AA+ Watch Negative 0.6 BBB Stable 0.27 B- Watch Positive
0.92 AA Watch Positive 0.59 BBB Negative 0.26 B- Positive
0.91 AA Positive 0.58 BBB Watch Negative 0.25 B- Stable
0.9 AA Stable 0.57 BBB- Watch Positive 0.24 B- Negative
0.89 AA Negative 0.56 BBB- Positive 0.23 B- Watch Negative
0.88 AA Watch Negative 0.55 BBB- Stable 0.22 CCC Watch Positive
0.87 AA- Watch Positive 0.54 BBB- Negative 0.21 CCC Positive
0.86 AA- Positive 0.53 BBB- Watch Negative 0.2 CCC Stable
0.85 AA- Stable 0.52 BB+ Watch Positive 0.19 CCC Negative
0.84 AA- Negative 0.51 BB+ Positive 0.18 CCC Watch Negative
0.83 AA- Watch Negative 0.5 BB+ Stable 0.17 CC Watch Positive
0.82 A+ Watch Positive 0.49 BB+ Negative 0.16 CC Positive
0.81 A+ Positive 0.48 BB+ Watch Negative 0.15 CC Stable
0.8 A+ Stable 0.47 BB Watch Positive 0.14 CC Negative
0.79 A+ Negative 0.46 BB Positive 0.13 CC Watch Negative
0.78 A+ Watch Negative 0.45 BB Stable 0.12 C Watch Positive
0.77 A Watch Positive 0.44 BB Negative 0.11 C Positive
0.76 A Positive 0.43 BB Watch Negative 0.1 C Stable
0.75 A Stable 0.42 BB- Watch Positive 0.09 C Negative
0.74 A Negative 0.41 BB- Positive 0.08 C Watch Negative
0.73 A Watch Negative 0.4 BB- Stable 0.07 D Watch Positive
0.72 A- Watch Positive 0.39 BB- Negative 0.06 D Positive
0.71 A- Positive 0.38 BB- Watch Negative 0.05 D Stable
0.7 A- Stable 0.37 B+ Watch Positive 0.04 D Negative
0.69 A- Negative 0.36 B+ Positive 0.03 D Watch Negative
0.68 A- Watch Negative 0.35 B+ Stable
*This table shows the mapping from the standard alphabets ratings to the numerical credit scores.
Table 2: Ratings and Corresponding Scores
[1, 0.995) AAA Stable [0.675, 0.665) BBB+ Watch Positive [0.345, 0.335) B+ Negative [0.995, 0.985) AAA Negative [0.665, 0.655) BBB+ Positive [0.335, 0.325) B+ Watch Negative [0.985, 0.975) AAA Watch Negative [0.655, 0.645) BBB+ Stable [0.325, 0.315) B Watch Positive [0.975, 0.965) AA+ Watch Positive [0.645, 0.635) BBB+ Negative [0.315, 0.305) B Positive [0.965, 0.955) AA+ Positive [0.635, 0.625) BBB+ Watch Negative [0.305, 0.295) B Stable [0.955, 0.945) AA+ Stable [0.625, 0.615) BBB Watch Positive [0.295, 0.285) B Negative [0.945, 0.935) AA+ Negative [0.615, 0.605) BBB Positive [0.285, 0.275) B Watch Negative [0.935, 0.925) AA+ Watch Negative [0.605, 0.595) BBB Stable [0.275, 0.265) B- Watch Positive [0.925, 0.915) AA Watch Positive [0.595, 0.585) BBB Negative [0.265, 0.255) B- Positive [0.915, 0.905) AA Positive [0.585, 0.575) BBB Watch Negative [0.255, 0.245) B- Stable [0.905, 0.895) AA Stable [0.575, 0.565) BBB- Watch Positive [0.245, 0.235) B- Negative [0.895, 0.885) AA Negative [0.565, 0.555) BBB- Positive [0.235, 0.225) B- Watch Negative [0.885, 0.875) AA Watch Negative [0.555, 0.545) BBB- Stable [0.225, 0.215) CCC Watch Positive [0.875, 0.865) AA- Watch Positive [0.545, 0.535) BBB- Negative [0.215, 0.205) CCC Positive [0.865, 0.855) AA- Positive [0.535, 0.525) BBB- Watch Negative [0.205, 0.195) CCC Stable [0.855, 0.455) AA- Stable [0.525, 0.515) BB+ Watch Positive [0.195, 0.185) CCC Negative [0.845, 0.835) AA- Negative [0.515, 0.505) BB+ Positive [0.185, 0.175) CCC Watch Negative [0.835, 0.825) AA- Watch Negative [0.505, 0, 495) BB+ Stable [0.175, 0.165) CC Watch Positive [0.825, 0.815) A+ Watch Positive [0.495, 0.485) BB+ Negative [0.165, 0.155) CC Positive [0.815, 0.805) A+ Positive [0.485, 0.475) BB+ Watch Negative [0.155, 0.145) CC Stable [0.805, 0.795) A+ Stable [0.475, 0.465) BB Watch Positive [0.145, 0.135) CC Negative
[0.795, 0.785) A+ Negative [0.465, 0.455) BB Positive [0.135, 0.125) CC Watch Negative
[0.785, 0.775) A+ Watch Negative [0.455, 0.445) BB Stable [0.125, 0.115) C Watch Positive [0.775, 0.765) A Watch Positive [0.445, 0.435) BB Negative [0.115, 0.105) C Positive [0.765, 0.755) A Positive [0.435, 0.425) BB Watch Negative [0.105, 0.095) C Stable [0.755, 0.745) A Stable [0.425, 0.415) BB- Watch Positive [0.095, 0.085) C Negative
[0.745, 0.735) A Negative [0.415, 0.405) BB- Positive [0.085, 0.075) C Watch Negative
[0.735, 0.725) A Watch Negative [0.405, 0.395) BB- Stable [0.075, 0.065) D Watch Positive [0.725, 0.715) A- Watch Positive [0.395, 0.385) BB- Negative [0.065, 0.055) D Positive [0.715, 0.705) A- Positive [0.385, 0.375) BB- Watch Negative [0.055, 0.045) D Stable [0.705, 0.695) A- Stable [0.375, 0.365) B+ Watch Positive [0.044, 0.035) D Negative
[0.695, 0.685) A- Negative [0.365, 0.355) B+ Positive [0.035, 0]p D Watch Negative
[0.685, 0.675) A- Watch Negative [0.355, 0.345) B+ Stable
*This table shows the mapping from numerical credit score between 0 to 1 to the standard alphabets ratings from D watch
negative to AAA stable.
Accounting Ratio Correlation with Credit
Leverage Ratio Liabilities/Assets
-Liabilities/Tangible Assets
-Long Term Liabilities/Assets
-Debt Ratio Total Debt/Total Assets
-EBIT/Interest Expense +
Liquidity Ratio Current Assets/Liabilities +
Quick Ratio1 +
Activity Ratio Account Payable/Net Sale
-Profitability Ratio EBIT1/Assets +
EBIT/Net Sales +
Net Income/Assets +
Net Income/Operating Income +
Retained Earnings/Assets +
Size Asset/CPI2 +
Growth Rate3 Current Operating Income/Last Operating Income +/-Table 4: Financial Ratios
* In this table, we list the candidate accounting ratios examined in this study. Categories of the ratio are listed in the first
column. Second column exhibits the formula. The relation between the ratio and the credit quality are given in the last column. For example, “+” means the increase in the ratio leads to the increase of the credit quality, or a better rating; “-” means the
increase in the ratio leads to the decrease of the credit quality, or worse rating.
1.EBIT refers to earning before interest and tax. 2.CPI refers to consumer price index.
3.Growth rates reflect the development stage of the corporation. 4.FFO refers to funds from operation.
Countries
AUSTRALIA LUXEMBOURG
BELGIUM MALAYSIA
BRAZIL MEXICO
CANADA NETHERLANDS
CAYMAN ISLANDS NEW ZEALAND
DENMARK PORTUGAL
FINLAND PORTUGAL
FRANCE SPAIN
GERMANY SWEDEN
HONG KONG SWITZERLAND
INDIA THAILAND
ISRAEL UNITED ARAB EMIRATES
ITALY UNITED KINGDOM
JAPAN UNITED STATES
KOREA VENEZUELA
Industries
AIRCRAFT & AEROSPACE: EQUIPMENT METALS & MINING
AUTOMOTIVE NATURAL PRODUCTS PROCESSOR
CHEMICALS NON-U.S. BANK
CONSTR & ENGINEERING SERV: HOMEBUILDING PACKAGING: PLASTICS
CONSUMER PRODUCTS PHARMACEUTICALS: GENERAL & SPECIALTY
DEFENSE REINSURANCE
ENERGY REIT
ENVIRONMENT REOC
FINANCE-CAPTIVE RESTAURANTS: FAST FOOD
FINANCE-NON CAPTIVE RETAIL
FOREST PRODUCTS: PULP & PAPER SECURITIES HOLDING CO.
GAMING: CASINOS SERVICES
HEALTHCARE TECHNOLOGY
INSURANCE TELECOMMUNICATIONS
LODGING TRANSPORTATION SERVICES
MANUFACTURING U.S. BANK HOLDING CO.
MEDIA UTILITY
WHLSL DSTRBTN: HEALTHCARE
Y ear Compan y Score Lev erage Debt.Ratio Liquidit y .Ratio Activit y .Ratio Profi tabilit y.Ratio Size Gro wth.Rate Min. 2 , 004 1 0 .140 0 .010 0 .010 0 .001 0 -0 .801 8 , 206 0 .220 1st Qu. 2 , 006 50 0 .550 0 .142 0 .130 0 .077 0 .013 0 .033 96 , 220 0 .908 Median 2 ,008 99 0 .615 0 .251 0 .245 0 .140 0 .044 0 .068 223 , 500 1 .046 Mean 2 , 008 99 0 .638 0 .269 0 .260 0 .218 0 .091 0 .072 3 , 696 , 000 , 000 , 000 1 .070 3rd Qu. 2 , 009 148 0 .750 0 .381 0 .363 0 .288 0 .103 0 .110 599 , 400 1 .184 Max. 2 ,011 197 1 0 .883 0 .940 0 .999 0 .989 0 .537 324 , 000 , 000 , 000 , 000 4 .139 Y ear Compan y Score Lev erage Debt.Ratio Liquidit y .Ratio Activit y .Ratio Profi tabilit y.Ratio Size Gro wth.Rate Min. 2 , 004 1 0 .200 0 .010 0 .010 0 .002 0 -0 .300 8 , 206 0 .291 1st Qu. 2 , 005 50 0 .550 0 .101 0 .164 0 .070 0 .014 0 .045 92 , 150 0 .979 Median 2 ,006 99 0 .650 0 .209 0 .269 0 .129 0 .044 0 .079 210 , 200 1 .090 Mean 2 , 006 99 0 .652 0 .230 0 .282 0 .206 0 .094 0 .085 3 , 449 , 000 , 000 , 000 1 .129 3rd Qu. 2 , 006 148 0 .750 0 .330 0 .378 0 .288 0 .109 0 .119 562 , 600 1 .214 Max. 2 ,007 197 1 0 .876 0 .940 0 .995 0 .968 0 .537 324 , 000 , 000 , 000 , 000 4 .139 Y ear Compan y Score Lev erage Debt.Ratio Liquidit y .Ratio Activit y .Ratio Profi tabilit y.Ratio Size Gro wth.Rate Min. 2 , 008 1 0 .140 0 .010 0 .010 0 .001 0 .00000 -0 .801 8 , 386 0 .220 1st Qu. 2 , 009 50 0 .550 0 .181 0 .097 0 .085 0 .012 0 .020 101 ,000 0 .826 Median 2 ,010 99 0 .600 0 .301 0 .216 0 .142 0 .044 0 .059 237 , 300 0 .985 Mean 2 , 010 99 0 .624 0 .309 0 .237 0 .231 0 .088 0 .060 3 , 943 , 000 , 000 , 000 1 .010 3rd Qu. 2 , 010 148 0 .730 0 .414 0 .345 0 .298 0 .098 0 .100 621 , 200 1 .139 Max. 2 ,011 197 1 0 .883 0 .837 0 .999 0 .989 0 .305 307 , 700 , 000 , 000 , 000 3 .163 T able 6: Statistics Of the Acc ou n ting Data (By Y ear)
Y ear Compan y Score Lev erage Debt.Ratio Liquidit y .Ratio Activit y .Ratio Profi tabilit y.Ratio Size Gro wth.Rate Min. 2 , 004 1 0 .140 0 .010 0 .010 0 .001 0 -0 .801 8 , 206 0 .220 1st Qu. 2 , 006 50 0 .550 0 .142 0 .130 0 .077 0 .013 0 .033 96 , 220 0 .908 Median 2 ,008 99 0 .615 0 .251 0 .245 0 .140 0 .044 0 .068 223 , 500 1 .046 Mean 2 , 008 99 0 .638 0 .269 0 .260 0 .218 0 .091 0 .072 3 , 696 , 000 , 000 , 000 1 .070 3rd Qu. 2 , 009 148 0 .750 0 .381 0 .363 0 .288 0 .103 0 .110 599 , 400 1 .184 Max. 2 ,011 197 1 0 .883 0 .940 0 .999 0 .989 0 .537 324 , 000 , 000 , 000 , 000 4 .139 Y ear Compan y Score Lev erage Debt.Ratio Liquidit y .Ratio Activit y .Ratio Profi tabilit y.Ratio Size Gro wth.Rate Min. 2 , 004 1 0 .530 0 .010 0 .010 0 .001 0 -0 .801 8 , 206 0 .220 1st Qu. 2 , 005 50 0 .600 0 .128 0 .116 0 .085 0 .015 0 .037 115 ,300 0 .918 Median 2 ,007 103 0 .650 0 .230 0 .224 0 .140 0 .047 0 .073 281 , 300 1 .055 Mean 2 , 007 1 00 .600 0 .689 0 .242 0 .235 0 .220 0 .095 0 .078 4 , 533 , 000 , 000 , 000 1 .070 3rd Qu. 2 , 009 150 0 .750 0 .346 0 .336 0 .288 0 .105 0 .114 927 , 900 1 .185 Max. 2 ,011 197 1 0 .787 0 .796 0 .999 0 .989 0 .345 324 , 000 , 000 , 000 , 000 3 .083 Y ear Compan y Score Lev erage Debt.Ratio Liquidit y .Ratio Activit y .Ratio Profi tabilit y.Ratio Si z e Gro wth.Rate Min. 2 , 004 2 0 .140 0 .010 0 .018 0 .003 0 .00001 -0 .545 8 ,386 0 .291 1st Qu. 2 , 006 53 0 .350 0 .246 0 .228 0 .056 0 .007 0 .017 68 , 870 0 .856 Median 2 ,008 84 0 .450 0 .391 0 .362 0 .105 0 .031 0 .055 108 , 400 1 .015 Mean 2 , 008 91 .900 0 .413 0 .392 0 .370 0 .209 0 .074 0 .047 263 , 100 1 .068 3rd Qu. 2 , 010 140 0 .500 0 .506 0 .495 0 .300 0 .092 0 .082 200 , 800 1 .175 Max. 2 ,011 197 0 .520 0 .883 0 .940 0 .958 0 .733 0 .537 8 , 087 , 000 4 .139 T able 7: Statistics Of the Ac coun ting Data (By In v estmen t Grade and Non-In v estmen t Grade)
2004 2005 2006 2007 V a ri a ble Linear Logit Probit Linear Logit Pro bi t Linear Logit Probit Linear Logit Probit In tercept 0.7685 0.8150 0.7358 0.7683 *** *** *** *** (0.0518) (0.0525) (0.0435) (0.0354) Lev erage 0.2410 3.1130 1.8176 0.3183 4.1024 2.2532 0.2932 3.8845 1.9234 -0.0163 -0.4249 -0 .2 152 * *** ** ** ** ** ** (0.1499) (2.1954) (1.2103) (0.1374) (1.8104 ) (1.0343) (0.1266) (1 .712 0) (0.9848) (0.0365) (0.4850) (0.2905) Debt -0.7176 -9.3614 -5.6122 -0.7610 -9.7475 -5.5785 -0.6590 -8.6144 -4.6957 -0.3582 -4.7062 -2 .6 613 Ratio *** *** *** *** *** *** *** *** *** *** *** *** (0.1791) (2.6164) (1.4680) (0.1664) (2.1937 ) (1.2748) (0.1446) (2 .051 8) (1.1494) (0.0781) (1.1298) (0.6366) Liquidit y 0.0001 0.0012 0.0005 0.0001 0.0016 0.0009 0.0027 0.0501 0.0272 0.0011 0.0157 0.0131 Ratio (0.0003) (0.0036) (0.0023) (0.0003) (0.0027 ) (0.0019) (0.0044) (0 .058 0) (0.0333) (0.0017) (0.0271) (0.0135) Activit y 0.0589 1.0276 0.5441 0.0505 0.8043 0.4057 0.0546 0.9079 0.4365 0.0980 1.6229 0.8365 Ratio *** *** *** *** *** *** *** *** *** *** *** *** (0.0092) (0.1875) (0.0981) (0.0111) (0.1677 ) (0.0909) (0.0097) (0 .192 8) (0.0806) (0.0133) (0.2610) (0.1239) Profitabilit y 0.5300 7.4548 4.5146 0.3529 5.3667 2.7853 0.3936 7.4193 2.9949 0.4697 6.8907 3.8828 Ratio *** *** *** *** ** ** *** *** *** *** *** *** (0.1735) (2.5790) (1.4240) (0.1756) (2.5482 ) (1.3154) (0.1368) (2 .129 5) (1.0601) (0.1264) (1.7473) (1.0194) Size 1.13E-15 2.47E-14 1.38E-14 9.13E-16 1.69E-14 8.79E-15 1.2E-15 2E-14 1.03E-14 1.04E-15 1.69E-14 9.77E-15 *** *** *** *** *** ** *** *** *** *** *** *** (4.93E-16) (1.03E-14) (6.41E-15) (4.03E-16) (6E-15) (3.6E-15) (3.32E-16) (5.16E-15) (2.79E-15) (3.13E-16) (4.93E-15) (2.78E-15) Gro wth -0.0278 -0.2157 -0.1896 -0.0552 -0.6515 -0.4235 -0.0138 -0.1587 -0.1158 -0.0690 -0.8749 -0 .4 789 Rate *** ** ** (0.0356) (0.4719) (0.2844) (0.0366) (0.4917 ) (0.2725) (0.0311) (0 .457 3) (0.2377) (0.0259) (0.4035) (0.2077) R 2 0.3449 0.0844 0.0848 0.2634 0.0612 0.0594 0.3175 0.0728 0.0712 0.3797 0.0901 0.0906 Adj R 2 0.3207 0.0507 0.0511 0.2361 0.0266 0.0247 0.2922 0.0386 0.0370 0.3567 0.0566 0.0571 T able 8: Re gr e ssion Results of Accoun ting Ratios to Credit Scores (20 04-2007)
2008 2009 2010 2011 V a ri a ble Linear Logit Probit Linear Logit Probit Linear Logit Probit Linear Logit Probit In tercept 0.6787 0.8276 0.8183 0.6940 *** *** *** *** (0.0319) (0.0389) (0.0408) (0.0388) Lev erage -0.4385 -6.4 -3.4531 -0.7042 -10.655 -5.9393 -0.717 -11.0198 -6.1093 -0.4965 -7.1961 -4.0721 *** *** *** *** *** *** *** *** *** *** *** *** (0.1302) (2.1008) (1.1551) (0.1213) (1.9112 ) (1.0867) (0.1132) (1.7461) (1.0101) (0.1203) (1.742) (1.0262) Debt -0.0216 -0.148 -0.3152 0.1665 2.5924 1.4146 0.2352 3.9901 2.0468 0.0125 0.4187 0.0196 Ratio ** *** ** (0.1239) (1.9708) (1.0763) (0.1129) (1.6512 ) (0.9682) (0.1064) (1.5281) (0.9068) (0.1146) (1.6001) (0.9504) Liquidit y 0.0018 0.033 0.0158 0.0001 -0.0021 -0.001 2 -0.0017 -0.0234 -0.0176 -0.0063 -0.0979 -0.0546 Ratio * ** * (0.0015) (0.021) (0.013) (0.002) (0.0268) (0.017) (0.0029) (0.0435) (0.0247) (0.0036) (0.0492) (0.0299) Activit y 0.0735 1.1807 0.6235 0.0664 1.1589 0.5792 0.0468 0.8461 0.4118 0.0293 0.5202 0.2494 Ratio *** *** *** *** *** *** *** *** *** *** *** *** (0.0106) (0.1957) (0.099) (0.0095) (0.2113 ) (0.0863) (0.0086) (0.1527) (0.0774) (0.008) (0.134 8) (0.0688) Profitabilit y 0.3109 4.7082 2.6241 0.711 11.0222 6.2639 0.6358 10.6349 5.540 8 0.3576 5.8889 3.2296 Ratio *** *** *** *** *** *** *** *** *** *** *** *** (0.0739) (1.2575) (0.6434) (0.1284) (2.0372 ) (1.1294) (0.1526) (2.406) (1.3148) (0.1334) (2.0165) (1.1131) Size 1.21E-15 2.15E-14 1.14E-14 4.97E-16 1.01E-14 4.41E-15 1.05E-15 1.86E-14 8.56E-15 5.52E-16 9 .7 5E-15 4.43E-1 5 *** *** *** ** *** *** *** * ** * (3.39E-16) (5.95E-15) (3.19E-15) (3.18E-16) (4.64E-15) (2.75E-15) (3.35E-16) (5.14E-15) (2.88E-15) (3.2E-16) (4.65E-15) (2.65E-15) Gro wth 0.0827 1.1057 0.718 -0.0724 -0.971 -0.6557 -0.0872 -1.2738 -0.7487 0.044 0.707 9 0.42 74 Rate *** *** *** *** *** *** *** *** *** (0.0357) (0.5355) (0.3064) (0.0258) (0.3749 ) (0.2209) (0.0316) (0.4534) (0.268) (0.036) (0.507 5) (0.2971) R 2 0.4903 0.0994 0.1004 0.5006 0.1064 0.1059 0.4283 0.0921 0.0908 0.3605 0.0707 0.0745 Adj R 2 0.4727 0.0682 0.0692 0.4833 0.0754 0.0749 0.4085 0.0604 0.0593 0.3383 0.0385 0.0424 T able 9: Re gr e ssion Results of Accoun ting Ratios to Credit Scores (20 08-2011)
2004 2005 2006 2007 V a ri a ble Linear Logit Probit Linear Logit Probit Linear Logit Probit Linear Logit Probit In tercept 0.7792 0.8348 0.7247 0.7622 *** *** *** *** (0.0444) (0.0441) (0.0456) (0.0376) Lev erage 0.0219 0.2130 0.1615 0.0553 0.9236 0.1379 0.1691 2.5626 1.2773 -0.0206 -0.6300 -0.3411 (0.1322) (2.4803) (1.3382) (0.1205) (2.0903) (1.1646) (0.1145) (1.881 2) (1.1002) (0.0402) (0 .68 41) (0.3966) Debt -0.3380 -5.3503 -3.4128 -0.3630 -5.9407 -3.0491 -0.4055 -5.9480 -3.4588 -0.2169 -3.0528 -1.7675 Ratio ** * ** ** ** ** *** *** *** *** ** ** (0.1619) (2.8992) (1.6475) (0.1486) (2.4924) (1.4439) (0.1348) (2.227 8) (1.3092) (0.0778) (1 .30 63) (0.7728) Liquidit y -2.45E-07 6.66E06 -0.0002 0.0003 0.0037 0.0024 0.0011 0.0466 0.0206 0.0021 0.0386 0.0241 Ratio * (0.0002) (0.0037) (0.0023) (0.0002) (0.0028) (0.0019) (0.0038) (0.064 8) (0.0365) (0.0014) (0 .03 09) (0.0146) Activit y 0.0525 0.9794 0.5741 0.0509 0.8335 0.4857 0.0489 0.8536 0.4497 0.0776 1.4093 0.7452 Ratio *** *** *** ** *** *** *** *** *** *** *** *** (0.0078) (0.1962) (0.1094) (0.0094) (0.1809) (0.1036) (0.0083) (0.197 6) (0.0865) (0.0116) (0 .25 93) (0.1297) Profitabilit y 0.1715 2.6276 1.7487 0.2007 2.7154 1.4948 0.2976 5.5323 3.0887 0.3045 5.8505 3.3503 Ratio ** ** ** ** ** ** (0.1626) (2.9447) (1.6448) (0.1703) (2.9787) (1.6465) (0.1479) (2.578 6) (1.4259) (0.1512) (2 .72 85) (1.4977) Size 1.1E-15 2.42E-14 1.37E -14 8.77E-16 1.7E-14 9.37E-15 1.02E-15 1.89E-14 1.02E-14 9.13E-16 1.64E-14 9.47E-15 *** ** ** *** *** *** *** *** *** *** *** *** (3.99E-16) (1.03E-14) (6.4E-15) (3.16E-16) (5.99E-15) (3.61E-15) (2.78E-16) (5.05E-15) (2.9E-15) (2.63E-16) (4.83E-15) (2.89E-15) Gro wth -0.0325 -0.3136 -0.2658 -0.0750 -1.1269 -0.7964 -0.0028 0.0295 -0.0360 -0.0509 -0.8377 -0.5224 Rate *** ** *** * * * (0.0304) (0.49 84) (0.3063) (0.0302) (0.56 04) (0.2943) (0.0338) (0 .5 446) (0.3247) (0.0286) (0 .4 868) (0.2865) R 2 0.3294 0.0822 0.0832 0.2815 0.0658 0.0679 0.2791 0.0638 0.0649 0.3261 0.0753 0.0769 Adj R 2 0.2999 0.0420 0.0431 0.2493 0.0362 0.0384 0.2469 0.0221 0.0232 0.2963 0.0343 0.0360 T able 10: Re gr e ssion Results of In v estmen t Grade Corp orations Accoun ting Ratios to Credit Scores (2004-2007)
2008 2009 2010 2011 V a ri a ble Linear Logit Probit Linear Logit Probit Linear Logit Probit Linear Logit Probit In tercept 0.6474 0.7435 0.7809 0.6687 *** *** *** *** (0.0283) (0.039) (0.0411) (0.0345) Lev erage 0.1645 3.2919 1.9057 -0.1097 -2.2923 -1.4274 -0.2177 -4.9620 -3.1185 0.02 0.24 77 0 .0 452 * ** ** (0.1414) (2.8446) (1.616) (0.1498) (2.7851) (1.5343) (0.1323) (2.565 2) (1.4283) (0.1275) (2.3701) (1.3286) Debt -0.3615 -6.6547 -3.803 -0.115 -1.3033 -0.7347 0.0526 2.0657 1.3572 -0.1828 -2.9833 -1 .8 662 Ratio *** ** *** (0.133) (2. 7 905) (1.5167) (0.1344) (2.527) (1.381) (0.1172) (2.342 3) (1.2678) (0.1154) (2.1854) (1.2097) Liquidit y 0.0001 0.0097 0.0019 -0.0009 -0.0209 -0.0121 -0.0006 -0.0192 -0.0105 -0.0074 -0.1211 -0 .0 745 Ratio ** ** ** (0.0013) (0.0229) (0.014) (0.0017) (0.0267) (0.0175) (0.0024) (0.050 7) (0.0261) (0.003) (0.0514) (0.0312) Activit y 0.0657 1.1466 0.6207 0.0533 0.9144 0.5027 0.042 0.7562 0.425 0.0331 0.5844 0.3306 Ratio *** *** *** *** *** *** *** *** *** *** *** *** (0.0088) (0.1994) (0.1031) (0.0081) (0.1833) (0.0885) (0.0076) (0.159 5) (0.0861) (0.0073) (0.1578) (0.08) Profitabilit y 0.1391 3.4193 1.9284 0.4378 8.2901 4.8985 0.4801 9.2951 6.0642 0.0742 2.0994 1.6133 Ratio * ** ** *** *** *** *** *** *** (0.0774) (1.5762) (0.9396) (0.1389) (2.4439) (1.4471) (0.1742) (3.249 7) (1.8852) (0.1333) (2.6043) (1.3953) Size 8.62E-16 1 .8 9E-14 1.05E-14 7.36E-16 1.36E-14 6.58E-15 8.51E-16 1.59E-14 8.35E-15 3.93E-16 6.77E-15 3.65E-15 *** *** *** *** *** ** *** *** *** (2.8E-16) (6.06E-15) (3.75E-15) (2.69E-16) (4.55E-15) (2.79E-15) (2.79E-16) (4.96E-15) (3E-15) (2.61E-16) (4.45E-15) (2.71E-15) Gro wth 0.0601 0.9061 0.5938 -0.0487 -0.7268 -0.5132 -0.0986 -1.594 -0.9785 0.0241 0.339 0.3134 Rate * * * * *** ** ** * (0.0309) (0.6039) (0.3335) (0.0276) (0.4658) (0.2842) (0.0345) (0.680 5) (0.3689) (0.0327) (0.5816) (0.3424) R 2 0.385 0.0756 0.07 14 0.3072 0.06 0.0576 0.2651 0.0543 0.0536 0.2045 0.0395 0.041 Adj R 2 0.3576 0.0344 0.0300 0.2761 0.0178 0.0153 0.2315 0.0110 0.0103 0.169 -0.0033 -0.0018 T able 11: Re gr e ssion Results of In v estmen t Grade Corp orations Accoun ting Ratios to Credit Scores (2008-2011)
2004 2005 2006 2007 V ariable Linear Logit Probit Linear Logit Probit Linear Logit Probit Linear Logit Probit In te rc ept 0.4507 0.4084 0.4686 0.5357 *** *** *** *** (0.0866) (0.0917) (0.0496) (0.0574) Lev erage 0.4625 13.3260 7.7920 0.4628 15.5514 7.867 8 0.3473 5.7202 4.9270 0.0120 0.1979 -0.5199 ** *** ** (0.3259) (10.6564) (5.8754) (0.2083) (5.9818) (3.3330) (0.2234) (5.6115) (3.2201) (0.2133) (6.5325) (3.7522) Debt -0.6904 -20.707 1 -12.3819 -0.5506 -18.4105 -9.6850 -0.4183 -9.0099 -5.9981 -0.2326 -6 .1 861 -3.0171 Ratio * * * ** *** ** * * (0.3497) (11.6910) (6.4487) (0.2564) (7.2457) (4.1015) (0.2443) (5.9429) (3.5478) (0.2556) (7.6904) (4.3350) Liquidit y -0.0332 -1.3585 -0.8163 0.0034 0.1178 0.0573 -0.0003 -0.1617 -0.0784 -0.0028 -0 .1 348 -0.0733 Ratio * ** ** (0.0297) (0.9138) (0.5338) (0.0017) (0.0489) (0.0272) (0.0083) (0.2043) (0.1214) (0.0061) (0.1825) (0.1010) Activit y -0.0193 -2.7848 -1.6539 -0.1061 -3.1860 -1.4815 0.2083 6.0730 3.2272 1.1200 35.2556 20.8877 Ratio * ** ** *** *** *** (0.1883) (5.5947) (3.3280) (0.0553) (1.4075) (0.8596) (0.1250) (4.5107) (2.4388) (0.3985) (13.5528) (7.0740) Profitabilit y 0.2097 9.4365 5.4909 0.1934 8.3522 3.0150 0.2053 13.6387 2.61 33 0.0411 1.1378 0.6698 Ratio ** (0.2329) (8.5703) (4.3415) (0.1694) (6.0457) (2.6339) (0.1353) (6.3619) (1.9701) (0.1161) (3.5097) (1.9637) Size 2.11E-09 1.44E-06 8.56E-07 6.04E-08 1.86E-06 8.47E-07 -8.34E-08 -2.49E-06 -1.31E-06 -2.03E-07 -6.4E-06 -3.81E-06 * ** * *** *** *** (1.19E07) (3.53E06) (2.1E06) (3.44E-08) (8.62E07) (5.3E07) (4.52E-08) (1.67E06) (8.95E07) (5.8E08) (2.03E06) (1.12E06) Gro wth 0.0729 2.0726 1.3098 0.0552 1.5829 0.8227 -0.0017 -0.2263 0.0124 -0.0375 -0 .7 044 -0.3514 Rate (0.0562) (1.8546) (1.0110) (0.0687) (1.6735) (1.0468) (0.0270) (0.6794) (0.3790) (0.0264) (0.6045) (0.3815) R 2 0.4290 0.1467 0.1616 0.3105 0.1130 0.0926 0.3842 0.1377 0.1123 0.5203 0.1992 0.2058 Adj R 2 0.2473 -0.1248 -0.10 52 0.1174 -0.1258 -0.1517 0.2046 -0.1037 -0.1363 0.3743 -0.0344 0.0152 T able 12: Regres sion Results of Non-In v estmen t Grade Corp orations Accoun ting R ati os to Credit Sc or e s (2004-2007)
2008 2009 2010 2011 V a ri a ble Linear Logit Probit Linear Logit Probit Linear Logit Probit Linear Logit Probit In tercept 0.5537 0.6724 0.5822 0.6086 *** *** *** *** (0.057) (0.0862) (0.0613) (0.0571) Lev erage -0.4103 -10.6271 -6.1521 -0.5991 -11.2991 -6.6876 -0.4918 -13.1929 -7.5337 -0.4382 -13.2184 -6.7 ** *** *** *** *** *** *** *** *** *** *** *** (0.1636) (3.8102) (2.1845) (0.2064) (3.8789 ) (2.3113) (0.1654) (4.321) (2.3123) (0.1628) (5. 04 51) (2.434) Debt 0.0417 3.0088 1.7913 0.1298 2.7654 1.6804 0.0813 4.0186 2.2554 0.0174 2.8857 0.58 Ratio (0.1411) (2.9569) (1.816) (0.1517) (2.7346 ) (1.6307) (0.1408) (3.599) (1.8868) (0.1404) (3. 92 33) (1.9857) Liquidit y 0.0015 -0.0184 0.0043 0.0106 0.2177 0.1252 0.0107 0.3112 0.1612 0.0008 0.0557 0.0078 Ratio (0.0038) (0.0909) (0.0494) (0.0101) (0.1859 ) (0.1095) (0.0128) (0.3344) (0.1713) (0.0089) (0. 21 53) (0.1243) Activit y 0.0431 0.6722 0.411 0.1681 3.1507 2.0407 0.0176 0.4251 0.2683 0.0021 -0.0231 0.0012 Ratio * * ** (0.0495) (1.0467) (0.6333) (0.0944) (1.6524 ) (1.028) (0.0167) (0.4231) (0.2215) (0.0104) (0. 22 31) (0.1456) Profitabilit y 0.1813 4.0455 2.4962 0.4062 6.8934 4.4601 -0.0062 1.0682 0.2794 -0.1327 -1.734 -0.5394 Ratio ** *** ** * * ** (0.0869) (2.0326) (1.1341) (0.2071) (3.7393 ) (2.2337) (0.1702) (3.704) (2.2331) (0.1661) (3. 76 14) (2.3611) Size -6.56E-08 -7.1E-07 -3.64E-07 -7.6E-08 -8.25E-07 -4.51E-07 7.19E-09 3.91E-07 3.3E-07 7.13E-08 1.72E-06 9.4E-07 * (4.26E-08) (9.12E-07) (5.63E-07) (5.79E-08) (9.82E-07) (6.21E-07) (4.94E-08) (1.08E-06) (6.55E-07) (4.63E-08) (1.07E-06) (6.65E-07) Gro wth 0.0644 0.4125 0.586 -0.0515 -0.9929 -0.5538 0.0074 0.1984 0.0432 -0.0124 0.3498 0.1946 Rate (0.0674) (1.3943) (0.8566) (0.0394) (0.8411 ) (0.4287) (0.0324) (0.6712) (0.4285) (0.047) (1.2018) (0.7032) R 2 0.4607 0.0983 0.0992 0.3702 0.0716 0.0733 0.4821 0.1145 0.1185 0.5129 0.1321 0.141 Adj R 2 0.3587 -0.0723 -0.0712 0.2542 -0.0994 -0.127 1 0.3937 -0.0367 -0.0320 0.4208 -0.0321 -0.0215 T able 13: Regres sion Results of Non-In v estmen t Grade Corp orations Accoun ting R ati os to Credit Sc or e s (2008-2001)
2004-2011 2004-2006 2007-2011 P o oling Fixed Effect Random Effect Log it Probit P o oling Fixed Effect Random Effect Logi t Probit P o oling Fixed Effect Random Effect Logit Probit In tercept 0.6932 0.65 08 0.8082 0.7684 0.67 42 0.8333 0.6923 0.651 3 0.7769 *** *** *** *** *** *** *** *** *** (0.0125) (0.0062) (0.0882) (0.0274) (0.0107) (0.0707) (0.0144) (0.0064) (0.0677) Lev erage -0.037 -0.0324 -0.0803 -0.666 -0.3079 0.2782 0.10 59 0.3493 3.9074 1.99 73 -0.0490 -0.0170 -0.1637 -0.8644 -0.4017 *** *** *** *** *** *** ** *** *** *** *** *** *** (0.0137) (0.0068) (0.0825) (0.2120) (0.1050) (0.0770) (0.0421) (0.1462) (1.0728) (0.6065) (0.0163) (0.0078) (0.0572) (0.2527) (0.1269) Debt -0.2928 -0.0304 -0.3296 -3.6449 -2.1527 -0.6936 -0.1780 -0.8340 -9.3096 -5.1879 -0.2692 0.0052 -0.2201 -3.3024 -1.9775 Ratio *** * *** *** *** *** *** *** *** *** *** *** *** *** (0.0262) (0.0184) (0.1120) (0.3824) (0.2057) (0.0907) (0.0500) (0.1722) (1.2898) (0.7278) (0.0313) (0.0213) (0.0834) (0.4674) (0.2483) Liquidit y 4.87E-05 1.08E-05 0.0002 0.0006 0.0003 0.0001 0.00 01 0.0001 0.0011 0.00 06 0.0001 -0 .0007 0.0015 -0.0035 0.0009 Ratio * (0.0002) (0.0001) (0.0013) (0.0021) (0.0014) (0.0002) (0.0001) (0.0005) (0.0021) (0.0014) (0.0010) (0.0004) (0.0041) (0.0139) (0.0076) Activit y 0.0593 0.00 09 0.079 7.0936 0.4624 0.0546 0.00 38 0.0608 0.8972 0.45 17 0.0604 -0 .0025 0.0780 1.0013 0.4640 Ratio *** *** *** *** *** *** *** *** *** *** *** *** (0.0036) (0.0034) (0.0100) (0.6415) (0.0298) (0.0057) (0.0053) (0.0100) (0.1036) (0.0504) (0.0045) (0.0038) (0.0099) (0.0883) (0.0373) Profitabilit y 0.4881 0.19 85 0.8588 0.9645 3.76 08 0.4118 0.16 45 0.4921 6.8615 3.26 00 0.5274 0.086 7 1.0277 7.7364 4.104 8 Ratio *** *** *** *** *** *** *** *** *** *** *** *** *** *** *** (0.0416) (0.0232) (0.1741) (0.0671) (0.3266) (0.0899) (0.0456) (0.1747) (1.3704) (0.7064) (0.0517) (0.0247) (0.1563) (0.8167) (0.4126) Size 1.03E-15 -1.28E-16 1.14 E-1 5 1.57E-14 8.42E-15 1.08E-15 -2.31E-17 1.19E-15 1.9E-14 1E-14 9.81E-16 1.54E-16 1.08E-15 1.43E-14 7.74E-15 *** *** *** *** *** *** *** *** *** *** *** *** (1.26E-16) (2.37E-16) (3.26E-16) (1.85E-15) (1.03E-15) (2.21E-16) (1.92E-16) (3.88E-16) (3.54E-15) (2.01E-15) (1.52E-16) (4.24E-16) (3.12E-16) (2.16E-15) (1.23E-15) Gro wth -0.0252 -0.0101 -0.1445 -0.2785 -0.1968 -0.0308 -0.0087 -0.0736 -0.3313 -0.2381 -0.0371 -0.0225 -0.1358 -0.4581 -0.2878 Rate ** * * ** *** *** *** ** *** *** (0.0105) (0.0047) (0.0827) (0.1427) (0.0801) (0.0193) (0.0062) (0.0541) (0.2665) (0.1493) (0.0126) (0.0048) (0.0669) (0.1723) (0.0978) R 2 0.3019 0.09 31 0.2698 0.0592 0.059 0.3023 0.16 14 0.2983 0.0698 0.06 85 0.3223 0.055 9 0.2908 0.0603 0.060 3 Adj R 2 0.2987 0.08 96 0.267 0.0556 0.0554 0.2940 0.15 28 0.2911 0.0602 0.05 89 0.3175 0.050 1 0.2864 0.0545 0.054 5 T able 14: Re gr e ssion Results of P anel Accoun ting Data
Statistic Rating Mean St. Dev. Min Max PX LAST AAA 37.448 9.510 12.990 65.950 PX BID 35.665 9.248 11.530 62.740 PX ASK 39.236 9.799 14.450 69.160 PX LAST AA 61.432 27.745 12.927 190.809 PX ASK 60.365 28.773 11.232 194.783 PX BID 62.505 26.882 14.115 186.833 PX LAST AA-63.679 33.952 10.167 290.000 PX ASK 61.431 33.045 8.434 282.813 PX BID 65.923 34.996 11.160 297.188 PX LAST A+ 75.543 44.424 19.393 590.789 PX ASK 72.318 42.184 17.142 564.661 PX BID 78.777 46.908 21.391 616.916 PX LAST A 93.906 71.730 14.353 687.104 PX ASK 91.606 70.791 12.020 681.316 PX BID 96.205 72.780 16.684 692.891 PX LAST A-120.832 85.359 21.505 696.856 PX ASK 118.753 84.340 19.960 680.242 PX BID 122.899 86.610 23.050 713.470 PX LAST BBB+ 122.222 88.604 31.273 929.386 PX ASK 118.904 86.306 26.879 902.990 PX BID 125.543 91.045 34.598 964.330 PX LAST BBB 158.941 103.540 31.434 1,298.611 PX ASK 154.762 101.089 28.364 1,248.312 PX BID 163.124 106.066 32.787 1,348.910 PX LAST BBB-172.274 110.508 36.635 1,543.817 PX ASK 168.315 107.886 34.535 1,489.898 PX BID 176.234 113.283 38.736 1,597.736 PX LAST BB+ 289.721 193.666 48.553 1,972.479 PX BID 282.103 188.311 46.364 1,907.850 PX ASK 297.332 199.049 50.405 2,037.107 PX LAST BB 309.619 199.260 51.619 1,660.993 PX BID 301.391 193.565 49.098 1,610.074 PX ASK 317.833 204.988 54.141 1,711.912 PX LAST BB-423.314 231.583 29.447 1,735.296 PX BID 413.431 226.330 27.784 1,708.415 PX ASK 433.175 236.809 31.109 1,777.215 PX LAST B+ 576.303 298.849 152.576 2,568.295 PX ASK 562.078 290.392 147.492 2,494.015 PX BID 590.534 307.401 157.660 2,642.575 PX LAST B 789.877 415.043 193.222 3,309.824 PX ASK 768.528 399.755 186.299 3,140.742 PX BID 811.514 431.107 200.146 3,496.217 PX LAST B-1,087.992 607.673 257.500 3,974.826 PX BID 1,055.841 584.599 249.125 3,616.623 PX ASK 1,120.033 629.842 265.875 3,974.826 PX LAST CCC+ 1,347.919 1,342.924 132.139 9,580.198 PX BID 1,309.431 1,300.437 128.212 9,580.198 PX ASK 1,389.203 1,391.435 136.066 9,661.282 PX LAST CCC 1,234.540 1,012.121 95.997 9,158.865 PX BID 1,197.341 968.938 91.083 7,952.916 PX ASK 1,269.413 1,045.610 100.910 9,298.397
Figure 5: Average 5 year CDS Last Price (2013 1st. July - 31 Dec.
Min. 1st Qu. Median Mean 3rd Qu. Max. Std. 2012 -0.28860 -0.07380 -0.01246 0.00000 0.07724 0.33010 0.09735615 2013 -0.275200 -0.079680 -0.016570 -0.004204 0.072800 0.344100 0.09686277
Table 16: Difference between the accounting based score and S&P’s rating scores
Statistic N Mean St. Dev. Min Max
Campany 197
S& P Rating Score 0.636 0.148 0.205 1.000 Accounting Score w 0.727 0.065 0.619 0.948 Accounting Credit Score 0.628 0.088 0.305 0.872
CDS Score 0.623 0.105 0.214 0.762
δ-Score 0.627 0.090 0.298 0.844