HAL Id: hal-01159216
https://hal.archives-ouvertes.fr/hal-01159216
Submitted on 2 Jun 2015
HAL is a multi-disciplinary open access
archive for the deposit and dissemination of
sci-entific research documents, whether they are
pub-lished or not. The documents may come from
teaching and research institutions in France or
abroad, or from public or private research centers.
L’archive ouverte pluridisciplinaire HAL, est
destinée au dépôt et à la diffusion de documents
scientifiques de niveau recherche, publiés ou non,
émanant des établissements d’enseignement et de
recherche français ou étrangers, des laboratoires
publics ou privés.
CSMA/CA with RTS/CTS Overhead Reduction for
M2M Communication with Finite Retransmission
Strategy
Baher Mawlawi, Jean-Baptiste Doré
To cite this version:
Baher Mawlawi, Jean-Baptiste Doré. CSMA/CA with RTS/CTS Overhead Reduction for M2M
Com-munication with Finite Retransmission Strategy. IEEE International Wireless ComCom-munications &
Mobile Computing Conference, Aug 2015, Dubrovnik, Croatia. �hal-01159216�
CSMA/CA with RTS/CTS Overhead Reduction for
M2M Communication with Finite Retransmission
Strategy
Baher Mawlawi
1,2,3, Jean-Baptiste Dor´e
11
CEA-Leti Minatec, 17 rue des Martyrs, 38054 Grenoble Cedex 9, France
2University of Lyon, INRIA, France
3
INSA-Lyon, CITI-INRIA, F-69621, Villeurbanne, France
{baher.mawlawi, jean-baptiste.dore}@cea.fr
Abstract—The number of Machine to Machine (M2M) appli-cations is increasing rapidly especially in cellular communication systems. These applications should support a very high number of stations (STAs) and facilitate communication without any human intervention. To fulfill these requirements random access protocols are a possible choice. Carrier sense multiple access collision avoidance (CSMA/CA) protocol with request to send and clear to send (RTS/CTS) mechanism presents high degradation of the throughput and packet drop probability performance especially when the packets size are small. The medium access control (MAC) overhead caused by the RTS and CTS messages is high comparing to the total duration of successful transmission. In order to reduce the MAC overhead we propose in this work a new strategy to serve many users successively. This strategy consists on sending many RTS in parallel by different stations on different frequency sub-bands. Once the RTS messages do not collide with each other, there will be no need to resend the RTS and wait for a CTS to gain the channel access. In this paper, this proposed strategy is investigated and we demonstrate that it reaches better saturation throughput and packet drop probability especially in loaded networks.
Index Terms—Multiband Carrier sense multiple access/collision avoidance (M-CSMA/CA), throughput, MAC protocol, scheduling, M2M, overhead reduction, finite retransmission, packet drop probability.
I. INTRODUCTION
M2M systems are deemed to create a revolution in the ongoing years. According to the researchers [1] 20 billion devices will be part of M2M communication by the end of 2020. The huge amount of devices shall work opportunistically and without need to be synchronized with a predefined device (i.e. access point (AP) or base station (BS)). To fulfill these requirements random access protocols are a possible choice [2] . CSMA/CA is an opportunistic random access protocol which allows transmitters to access equally the wireless channel, which incurs equal throughput in long term regardless of the channel conditions. These kind of protocols could be suitable for M2M applications [3]. CSMA/CA - RTS/CTS was invoked from long time ago by different researchers [4], [5]. Their main contributions are to improve the saturation throughput and the delay by modifying the backoff model [6], [7]. However, these contributions, adapted for single band CSMA/CA, suffers from high RTS collision probability which lead the system
inefficient. In our previous work [3], we proposed a new model based on multiband CSMA/CA - RTS/CTS which reduces drastically the RTS collisions and improves the overall system performance in terms of saturation throughput and packet drop probability. The main contribution was to assess a better performance by using the frequency channel division strategy only for RTS messages, while keeping the whole channel for the CTS, DATA and ACK transmissions. Moreover, when many RTS messages may be decoded by the AP, the AP can serve only one user which wins the channel access and transmit its packets. The non-served users loose the channel access, and have to retry with another RTS transmission after revoking a new backoff procedure. This procedure force the non-served user to transmit a new RTS message and wait for a new CTS message which causes a high MAC overhead. Each transmission is based on CSMA/CA - RTS/CTS protocol with finite maximum retry limit. After each RTS collision the associated stations’ backoff is generated with a doubled interval. The presence of high contented stations in the system lead to more collisions which occur more packets drop. To solve this issue, we propose in this work a new strategy which consist in serving many users once the CTS is detected by the transmitters. Section II details the proposed strategy and the related performance will be evaluated in Section III. Section IV is reserved for conclusion.
II. SYSTEMMODEL
Without loss of generality, we consider the scenario in which many stations would transmit some packets to an AP. Considering a symmetrical and ideal channel with RTS/CTS mechanism, behind the loss in terms of RTS collision, MAC overhead significantly reduces the system performance. In fact, the RTS and CTS messages introduce a high overhead which makes the system suboptimal. In the case of multiband protocol [8], many RTS messages may be decoded by the AP simultaneously. For that, it will be interesting to implement a polling mechanism which serves many stations one after the other1. The proposed strategy is based on CSMA/CA protocol
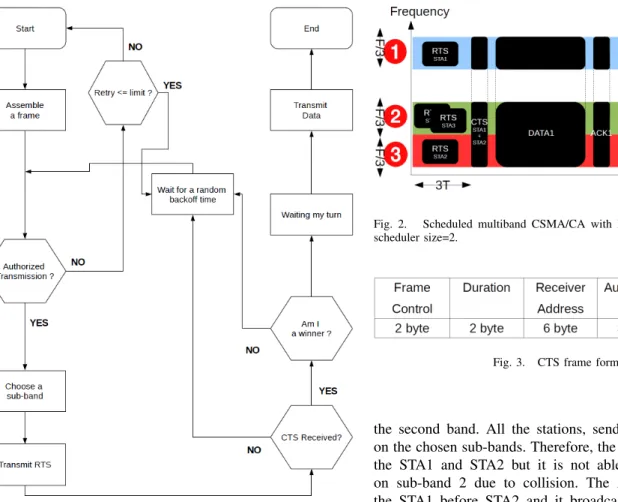
Fig. 1. Flow chart of the proposed strategy.
with RTS/CTS techniques. The corresponding flow chart is depicted in Figure 1. According to this strategy, a source node wishing to transmit data should first apply the multiband protocol proposed in [3]. When the RTS is transmitted by the station, the AP decodes the RTS messages and replies with the CTS message which contains the information about the winners (transmitters who gain the channel access). Depending on the priority, the winner either transmits directly (once the CTS is received) or it waits its turn to transmit data over the complete frequency bandwidth. An ACK is transmitted by the AP if the data are successfully decoded. A retry counter per station is incremented after each collision happened at the last backoff stage (CW = CWmax). After each collision this
counter is compared to a define limit in order to decide if the packet should be rejected or not. A packet is rejected when the counter value passes the limit (allowed retry transmission at the last backoff stage). Note that the RTS message duration is multiplied by the number of RTS sub-bands in order to maintain the same quantity of transmitted information.
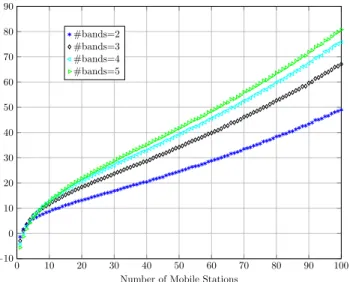
Let’s consider a simple example composed of four STAs ready to transmit (backoff=0), STA0, STA1, STA2, STA3 and an AP. We illustrate in Figure 2 the considered scenario in the case of the proposed strategy. STA1 and STA2 choose the first and third sub-bands respectively. STA0 and STA3 choose
Fig. 2. Scheduled multiband CSMA/CA with RTS/CTS mechanism with scheduler size=2.
Fig. 3. CTS frame format.
the second band. All the stations, send their RTS messages on the chosen sub-bands. Therefore, the AP detects RTS from the STA1 and STA2 but it is not able to decode the RTS on sub-band 2 due to collision. The AP chooses to serve the STA1 before STA2 and it broadcasts the CTS message over all the sub-bands. The stations choice may be random or not (depends on some predefined priority). The number of stations that could be served by the AP depends on the size of the scheduler. In that case, the scheduler size is equals to two (maximum two stations can be served successively). All the stations receive and decode the CTS and only STA1 and STA2 are allowed to transmit. Once the ACK for STA1 is received, the channel becomes clear and STA2 will be authorized to send DATA. The ACK for STA2 is broadcasted indicating successful transmission and the channel becomes free for a new backoff procedure. The proposed CTS frame format is presented in Figure 3 in which an additional field was introduced to indicate the authorized stations able to transmit data. The size of the authorized band field is equals to 3 bytes which may be divided into 6 blocks of 4 bits. Each block corresponds to a band index. If the block value is 0, it means that the block is not assigned to any band. The priority starts from the right to the left. This field can support up to 15 sub-bands and serve at most 5 stations successively. In this case, the authorized band field (00 00 21) indicates that the STA1 is prior to the STA2, hence after the CTS reception the STA1 transmits its packet and waits for acknowledgement.
The proposed strategy permits to serve transmitters succes-sively with reducing the RTS collision and reducing the over-head introduced by the control messages (RTS and CTS) and the backoff. However, it should be mentioned that dividing the band into 3 sub-bands with bandwidth equals to F/3 imposes a duration extension of the RTS messages with factor equals
0 10 20 30 40 50 60 70 80 90 100 −10 0 10 20 30 40 50 60
Number of Mobile Stations
Saturation Throughput Gain (%) #bands=2 #bands=3 #bands=4 #bands=5
Fig. 4. Saturation Throughput Gain (%) vs. number of stations for scheduler size=1.
to 3. Hence, if T is the duration of the original RTS message, 3T will be the duration of the extended RTS message.
III. PERFORMANCEEVALUATION
In this Section, we study the saturation throughput and the packet drop probability for the proposed strategy and the related gain compared to the single band and to the multiband protocols studied in [3]. The scenario of one AP and many stations is considered for simulation. The protocol and channel parameters are reported in Table I and correspond to those of 802.11n standard. The minimal and maximal contention window (CWmin, CWmax) have been chosen constant and
equal to16 and 128 respectively. It is worth mentioning that as the study focuses on the MAC mechanisms, an ideal physical layer (no path loss, no fading, no shadowing, ...) is considered.
Packet payload 8184 bits MAC header 272 bits PHY header 128 bits ACK length 112 bits + PHY header RTS length 160 bits + PHY header CTS length 112 bits + PHY header Channel Bit Rate 72.2 Mbit/s Propagation Delay 1 µs SIFS 10 µs Slot Time 9 µs DIFS 28 µs
TABLE I
PHYLAYER PARAMETERS FOR802.11N
A. Saturation Throughput
In this Section, the throughput of the proposed strategy is evaluated under the saturation conditions (each station has at least one packet ready for transmission). Figure 4, 5 and 6 depict the saturation throughput gain between the single and multiband protocols vs. the number of mobile stations for various number of RTS sub-bands and scheduler sizes. As
0 10 20 30 40 50 60 70 80 90 100 −10 0 10 20 30 40 50 60 70 80
Number of Mobile Stations
Saturation Throughput Gain (%) #bands=2 #bands=3 #bands=4 #bands=5
Fig. 5. Saturation Throughput Gain (%) vs. number of stations for scheduler size=2. 0 10 20 30 40 50 60 70 80 90 100 −10 0 10 20 30 40 50 60 70 80 90
Number of Mobile Stations
Saturation Throughput Gain (%) #bands=2 #bands=3 #bands=4 #bands=5
Fig. 6. Saturation Throughput Gain (%) vs. number of stations for scheduler size=3.
expected, the gain is more important when the number of RTS sub-bands is high and especially in the case of loaded networks. This improvement is due to the reduction of the RTS collision probability thanks to the division of the RTS band. Moreover, the use of scheduler sizes greater than one can improve the saturation throughput gain. This is due to the possibility to serve many stations (which correspond to the successful transmitted RTS) without revoking a new backoff procedure (without introducing more overhead). For example, in the case of 5 RTS sub-bands and 50 active stations, the saturation throughput gain is 20%, 38% and 42% for scheduler size equals to one, two and three. Also, Figures 5 and 6 show that the gain is the same when the number of RTS sub-bands is lower or equal to the scheduler size (for example: 2 RTS sub-bands with scheduler size equals to two or three). Hence,
0 10 20 30 40 50 60 70 80 90 100 0 10 20 30 40 50 60 70 80 90 100
Number of Mobile Stations
Normalized throughput (% ) Asymptotic PHY Asymptotic MAC #Scheduler=1 (5 bands) #Scheduler=2 (5 bands) #Scheduler=3 (5 bands) Single band
Fig. 7. Contention Based MAC Performance.
there is no need to use scheduler sizes larger than the number of RTS sub-bands because a system with n sub-bands can serve at most n stations one after the other (in the case of non RTS collisions).
Moreover, it is clearly seen that the gain is negative in the case of unloaded networks (number of stations is less than 5). It can be explained by the fact that RTS message duration is larger if the bandwidth is reduced (the original RTS duration is multiplied by the number of sub-bands to maintain the same quantity of information) which introduces more overhead not amended with the reduction of collision probability [3]. Also, it should mentioned that a complete study for packets transmission delay (duration needed to transmit a packet) is done in the case of infinite maximum retransmission limit (in order to be sure that all packets will be transmitted without rejection). As result the transmission delay is not affected especially in loaded networks since the RTS size is negligible regarding the packet size [8].
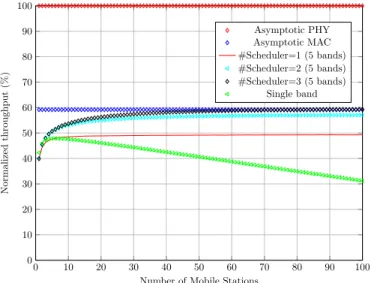
Figure 7 depicts the normalized saturation throughput vs. the number of mobile stations. PHY and MAC asymptotic throughput communication are also illustrated. Also, the sat-uration throughput related to the proposed mechanism with 5 RTS bands and various scheduler sizes are shown on the same figure. A physical (PHY) asymptotic throughput (label Asymp-totic PHY on the figure) is a communication without any overhead (no signaling, no synchronization, no reservation, no crc, ...). It is a transmission on the physical layer without any access mechanism and without any collision (kind of one user present alone in the network and it will always communicate successfully with the destination). Then, this curve will serve as a reference to benchmark the CSMA/CA protocols. Also, a MAC asymptotic communication refers to the achievable upper bound of the contention based protocol. It is a perfect handshake communication without using the backoff mech-anism (only RTS-CTS-DATA-ACK). A difference of 40% between the PHY and MAC asymptotic throughput is noticed
due to the overhead introduced by the nature of the contention based protocol (RTS, CTS, ACK and backoff). Hence, with best and ideal communication strategies (no collisions), the maximum achievable performance based contention MAC could reach 60% of the PHY asymptotic performance. How-ever, such protocols could be adopted for many reasons: they allow to operate in an environment with an unknown number of devices with the entire available bandwidth [9], operate in distributed manner [10] and leads to a cheaper deployment since they don’t require much planning, interoperability and management complexity [11]. Results demonstrate that for loaded network it is possible to achieve the MAC asymptotic throughput bound by considering 5 bands and scheduler size equals to 3. While classical CSMA/CA - RTS/CTS suffers from important loss. The investigated mechanism reaches the maximum achievable performance with 5 RTS bands and scheduler size equals to three for loaded network. Then, the proposed mechanism is the optimal way to achieve the maximum contention based MAC upper bound for loaded scenarios.
B. Packet Drop Probability
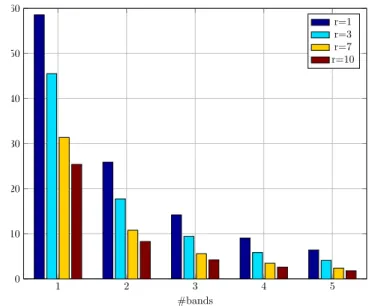
In this Section we analyze the packet drop probability for the single band and multiband scenarios for various number of sub-bands and retry limit (r) in the case of 100 stations present in the network. Figures 8,9 and 10 depict the packet drop probability (PDP) vs. the number of sub-bands for scheduler size equals 1,2 and 3 respectively. These figures highlight that the PDP decreases when the value of the retry limit and the number of sub-bands increases. For instance, the PDP is equals to 58% (14%) with r= 1 and it will be reduced to 26% (5%) when r = 10 for single band (four RTS bands). When the scheduler size is greater than or equal to the number of RTS bands, the PDP will be reduced effectively. For the case of 4 RTS bands and r=1, the PDP is equal to 14 (10 and 9) when the scheduler size is equals to 1 (2 and 3). Also, it should be mentioned that there is no need to use scheduler sizes larger than the number of RTS sub-bands (same PDP when using single band for whatever scheduler sizes) because a system with n sub-bands can serve at most n stations successively (in the case of non RTS collisions). Finally, the proposed strategy helps to reduce drastically the packet drop probability by serving many winners consecutively. Since stations will contend less, their battery life will be extended.
IV. CONCLUSION
In this work, we proposed a novel strategy based on multiband CSMA/CA-RTS/CTS which is characterized by serving many stations one after the other to reduce the MAC overhead. We prove by simulations that the proposed strategy reaches the contention based upper bound and is able to achieve very high gain in terms of saturation throughput and packet drop probability. Since the gain is very important in loaded networks, the proposed strategy may be adapted to M2M communication where very high number of stations communicate simultaneously. For instance, when considering
1 2 3 4 5 0 10 20 30 40 50 60 #bands PDP % for sc heduler siz e=1 r=1 r=3 r=7 r=10
Fig. 8. Packet Drop Probability for scheduler size=1.
1 2 3 4 5 0 10 20 30 40 50 60 #bands PDP % for sc heduler siz e=2 r=1 r=3 r=7 r=10
Fig. 9. Packet Drop Probability for scheduler size=2.
4 RTS sub-bands with 100 stations in saturation conditions, the achieved gain for scheduler size equals to three is 78% in terms of saturation throughput and 35% of gain in terms of packet rejection.
To conclude, in this contribution we proposed a study about the overhead reduction by introducing a scheduler to serve transmitters successively, but it should be mentioned that in practical application there is a limit on the scheduler size. For this reason the scheduler size should be reasonable and adapted for each application. Also, the proposed strategy may be easily implemented by allocating many sub-carriers for different RTS messages. Multicarrier waveforms already introduced into latest 802.11 standards can fulfill the requirements for such implementations. 1 2 3 4 5 0 10 20 30 40 50 60 #bands PER % for sc heduler si ze=3 r=1 r=3 r=7 r=10
Fig. 10. Packet Drop Probability for scheduler size=3.
REFERENCES
[1] M. Chen, J. Wan, and F. Li, “Machine-to-Machine Communica-tions:Architectures, Standards and Applications,” Transactions onInter-net and Information Systems, vol. 6, no. 2, pp. 171–179, Feb 2012. [2] A. Laya, L. Alonso, and J. Alonso-Zarate, “Is the random access
channel of lte and lte-a suitable for m2m communications? a survey of alternatives,” Communications Surveys Tutorials, IEEE, vol. 16, no. 1, pp. 4–16, First 2014.
[3] Baher Mawlawi, Baptiste Dor´e, Nikolai Lebedev and Jean-Marie Gorce., “Performance Evaluation Of Multiband CSMA/CA With RTS/CTS For M2M Communication With Finite Retransmission Strat-egy,” in International Conference on Selected Topics in Mobile and Wireless Networking, 2014.
[4] G. Bianchi, “IEEE 802.11-saturation throughput analysis,” Communica-tions Letters, IEEE, vol. 2, no. 12, pp. 318 –320, dec. 1998.
[5] G. Bianchi, L. Fratta, and M. Oliveri, “Performance evaluation and enhancement of the CSMA/CA MAC protocol for 802.11 wireless LANs,” in Personal, Indoor and Mobile Radio Communications, 1996. PIMRC’96., Seventh IEEE International Symposium on, vol. 2, oct 1996, pp. 392 –396 vol.2.
[6] F. Cali, M. Conti, and E. Gregori, “Dynamic tuning of the IEEE 802.11 protocol to achieve a theoretical throughput limit,” Networking, IEEE/ACM Transactions on, vol. 8, no. 6, pp. 785–799, Dec 2000. [7] S.-W. Kang, J.-R. Cha, and J.-H. Kim, “A Novel Estimation-Based
Backoff Algorithm in the IEEE 802.11 Based Wireless Network,” in Consumer Communications and Networking Conference (CCNC), 2010 7th IEEE, jan. 2010, pp. 1 –5.
[8] Baher Mawlawi, Baptiste Dor´e, Nikolai Lebedev and Jean-Marie Gorce., “Analysis of Frequency Channel Division Strategy for CSMA/CA with RTS/CTS Mechanism,” in 8th International Conference on Sensing Technology, 2014.
[9] C.-S. Hwang and J. Cioffi, “Opportunistic CSMA/CA for achieving multi-user diversity in wireless lan,” Wireless Communications, IEEE Transactions on, vol. 8, no. 6, pp. 2972–2982, 2009.
[10] J. Ni and R. Srikant, “Distributed csma/ca algorithms for achieving maximum throughput in wireless networks,” in Information Theory and Applications Workshop, 2009, 2009, pp. 250–250.
[11] H. Xiaoben, “Self-organized and distributed radio resource management scheme for CSMA/CA based ieee 802.11 WLAN,” in Wireless Com-munications, Networking and Mobile Computing, 2007. WiCom 2007. International Conference on, 2007, pp. 2048–2053.