HAL Id: hal-01347769
https://hal.archives-ouvertes.fr/hal-01347769
Preprint submitted on 21 Jul 2016HAL is a multi-disciplinary open access archive for the deposit and dissemination of sci-entific research documents, whether they are pub-lished or not. The documents may come from teaching and research institutions in France or abroad, or from public or private research centers.
L’archive ouverte pluridisciplinaire HAL, est destinée au dépôt et à la diffusion de documents scientifiques de niveau recherche, publiés ou non, émanant des établissements d’enseignement et de recherche français ou étrangers, des laboratoires publics ou privés.
Phase diagram of crushed powders
Sébastien Bodard, Olivier Jalbaud, Richard Saurel, Yves Burtschell,
Emmanuel Lapebie
To cite this version:
Sébastien Bodard, Olivier Jalbaud, Richard Saurel, Yves Burtschell, Emmanuel Lapebie. Phase dia-gram of crushed powders. 2016. �hal-01347769�
-1-
Phase diagram of crushed powders
Sébastien Bodard (1), Olivier Jalbaud (2), Richard Saurel (1,3), Yves Burtschell (2)
and Emmanuel Lapebie (4)
(1)
RS2N, 371 chemin de Gaumin, 83640 Saint Zacharie, France
(2)
Polytech Marseille, 60 rue Joliot Curie, 13013 Marseille, France
(3)
Aix Marseille Université, CNRS, Centrale Marseille, M2P2 UMR 7340, 38 rue Joliot Curie, 13451 Marseille, France
(4)
CEA Gramat, 46500 Gramat, France
Abstract
Compression of monodisperse powder samples in quasistatic conditions is addressed in a pressure range such that particles fragmentation occurs while the solid remains incompressible (typical pressure range of 1-300 MPa for glass powders). For a granular bed made of particles of given size, the existence of three stages is observed during compression and crush up. First, classical compression occurs and the pressure of the granular bed increases along a characteristic curve as the volume decreases. Then, a critical pressure is reached for which fragmentation begins. During the fragmentation process, the granular pressure stays constant in a given volume range. At the end of this second stage, 20% to 50% of initial grains are reduced to finer particles, depending on the initial size. Then compression undergoes the third stage and the pressure increases along another characteristic curve, in the absence of extra fragmentation.
The present paper analyses the analogies between phase transition in liquid-vapour systems and powder compression with crush-up. Fragmentation diagram of soda lime glass granular beds is determined by experimental means. The analogues of the saturation pressure and latent heat of phase change are determined.
Two thermodynamic models are then examined to represent the crush-up diagram. The first one uses piecewise functions while the second one is of van der Waals type. Both equations of state relate granular pressure, solid volume fraction and initial particle diameter. The piecewise functions approach provides reasonable representations of the phase diagram while the van der Waals one fails.
Key words: powder compression, crush energy, thermodynamics of granular materials
Email adresses : [email protected] ; [email protected] ; [email protected] ;
-2-
I. Introduction
Compression of powders has been widely studied in the kilobar range (Kuo et al., 1980, Elban and Chiarito, 1986) and at higher pressures in the megabar range (Marsch et al., 1980, Fortov et al., 2013) with dynamic shock loading. Dynamic rupture and fragmentation of granular materials has been an intense research area since the pioneer work of Griffith (1921), Mott (1948), Einav (2007a-b), Mott (2006), Davison et al. (2012) and many other researchers. In this paper, we address quasi-static compression of initially monodisperse spherical soda-lime glass particles. The (quasi) monodisperse character of the initial bed enables studying the effects of initial particle size.
Compression of such granular beds exhibits three successive stages. During the first one, the behaviour that is observed corresponds to conventional loading curves reported for example in Kuo et al. (1980), Elban and Chiarito (1986) and summarized by a "configuration pressure" equation of state (EOS) (Passman et al., 1984). In this regime, grains deform in elastic-plastic regime and fragmentation is rare. During this stage, the “granular pressure” (denoted β) increases when the solid volume fraction increases too. This granular pressure represents collective intergranular contact resistance effects to compression. Details are given in Bdzil et al. (1999) where this pressure is linked to a surface energy and in Saurel et al. (2010) where a convenient and accurate EOS formulation is given.
When compression continues, some critical granular pressure level is reached and the second stage begins. Fragmentation occurs and produces characteristic noise in the experiments. The fragmentation process is continuous with volume decrease and occurs at nearly constant granular pressure, as will be discussed. This particular feature appears to be of prime interest for the study of granular bed fragmentation. Then, at a given compression level, fragmentation halts and the third compression stage begins. The powder is now polydisperse, consisting of particles having initial size as well as smaller grains. Its compression curve follows another characteristic curve, quite similar to the one of the first stage. Particle fragmentation is quite rare during this third compression stage.
These three stages are illustrated in Figure 1 and in the author’s knowledge were not reported before. As shown later, compaction of several powder samples made of the same material but with different initial particle sizes enable to build a fragmentation diagram, schematized in Figure 2. It has similarities with isothermal compression of liquid-vapour systems as, for instance, a fragmentation dome (analogue of the saturation dome) and a critical point. When the initial particles diameter is greater than the critical one, fragmentation is possible and the compaction processes follow the three stages described previously. Otherwise no fragmentation takes place and compaction follows the initial characteristic curve (the one of the first stage).
Figure 1: Typical granular pressure evolution as a function of the volume fraction of solid during a compression test. A: Initial granular bed configuration, B: Elastic-plastic deformation and reorganisation processes, C: First
-3-
grain fracture, D: Fragmentation at constant granular pressure, E: Last grain fracture, F: Elastic-plastic deformation and reorganisation of fragmented powder.
Figure 2: Schematic representation of the fragmentation diagram. The fragmentation dome is represented by a dark grey area. Three typical compaction paths are shown with dashed grey lines for different initial diameter
such that d1>d2=dcrit>d3. dcrit is the critical initial diameter under which no fragmentation happens during granular bed compression.
The determination of the fragmentation diagram may be useful for various applications, such as for example the building of protection materials against mechanical aggressions or the behaviour of materials during projectile’s impact.
II. Experiments and results
A conventional laboratory press (CBR T0105.1) is used to compress powder samples of a few grams. A steel piston is moved at a velocity of 1.27 mm/min to achieve compression. The compression cell is a steel tube with 24.9 mm inner diameter. The maximal force reached by the press is about 100 kN. Figure 3 illustrates the experimental setup. For each compression
test, the height of the sample was measured with a displacement gauge. The applied force (Fa)
and the transmitted force (Ft) were recorded at the upper and lower surfaces of the
compression chamber, respectively. We found nearly equal forces, meaning quasi-uniform pressure in the granular sample.
Following Kuo et al. (1980), the granular pressure
β
is computed as Fa Ft2 S
β
α
+=
, with S the upper and lower surface area of the sample. The solid volume fraction is computed ass s
α = m
/
(
ρ V
) withm
s the mass of powder in the sample,ρ
s the density of the particle(2500 kg/m3 for soda lime glass) and V the volume of the sample. Seven granular samples of
soda-lime glass have been considered. Their characteristics are summarised in Table 1. The experimental compaction curves are presented in Figure 4a in the (β-α)-plane. Note that the
form of the curves is the same in the (β-ρ)-plane as
α ρ
s ≅ρ
, the gas density being negligiblecompared to the solid one. Figure 4b shows the liquid-vapour phase change of CO2 in the
(P-ρ)-plane to illustrate the analogy. Obviously many other liquid-vapour substance could be
considered to illustrate the analogy (H2O, N2..). Thermodynamics data of CO2 have been
-4-
Table 1 : Characteristics of each powder sample (soda lime)
Test 1 2 3 4 5 6 7 Grain size (µm) 2000-3000 1600-2000 850-1000 500-600 355-425 212-250 27-32 Initial mass (g) 8.36 8.36 5.06 5.02 5.02 5.06 5.02 Initial volume (cm3) 5.82 5.74 3.38 3.29 3.22 3.26 3.38 Approximate number of grains in the compression cell 410 1 103 4900 23 000 65 000 310 000 1.4×10⁸
Figure 3: Representation of the experimental facility: a) laboratory press, b) experimental setup.
Figure 4: a) Phase diagram of pressed granular beds made of glass particles. β represents the granular pressure and α the volume fraction. Lines represent compression curves for given initial particle diameter. b) Liquid-gas
phase diagram of CO2.
Table 1 provides grains size range for each test. Unfortunately for obvious technical reasons it has not been possible to deal with monodisperse granular beds. But each class of particle size is distinct enough of the others to have the various distinct compression curves shown in Figure 4a. We believe that particle samples made of single spherical particles would show clearer slope change when fragmentation halts, as it is for liquid-vapour systems, where the isotherms in the liquid show abrupt changes with the saturation line.
In the present experiments and analysis it is assumed that the granular bed contains enough particles in all directions to be considered as a continuum. For Test 1, considering particles of average size 2.5 mm, 10 particles are present along the cell diameter and 6 layers of particles
-5-
are present in the vertical direction. This cell appeared of sufficient size regarding repeatability and coherence of the results of Figure 4a. For other tests, particles being smaller, the assumption of continuum media is supported.
III. Analysis of the experiments
In this section, the experimental data are analysed and the extent of the analogy between fragmentation and liquid-vapour phase change is discussed. First, we focus on the differences between the two phenomena. For liquid-vapour systems the phase change is reversible and occurs at constant pressure. Powder fragmentation is obviously irreversible. Another noticeable difference is that, for liquid-vapour systems, outside the saturation dome phases are either pure liquid or pure gas. For powders, total fragmentation is never observed and part of the initial particles remains intact.
For each powder sample, after crush-up, remaining granular bed consisted in three main classes of particles: intact grains, coarse grains of smaller size (a half to a tenth of the initial grain diameter) and fine dusts. These three classes of particle size have been roughly separated and corresponding mass fractions reported in Figure 5. An example of the three classes of particles collected after a compression test is shown in Figure 6. From Figure 5 it appears that the mass fraction of fragments (dust + coarse) is about 20% for powder samples made of 250 µm initial diameter particles and tends to 70% for big particles (3 mm). A schematic picture of observed sample cross-section after final fragmentation is presented in graph E of Figure 7. It seemed that fragmented particles are trapped in initial intergranular voids, rendering stress isotropic around particles and preventing further fragmentation.
Knowing the initial and final configuration of the granular bed (graphs A and E of Figure 7, respectively), the fragmentation process at grain scale is assumed to follow the steps shown in Figure 7: A) the initial granular bed is compacted and grains are reorganised, B) grains are deformed in elastic-plastic regime, C) fragmentation appears and the bed becomes polydisperse , D) all initial voids are filled with particle fragments and the stress field around particles becomes isotropic, preventing further fragmentation, E) grains are reorganized and deform again in elastic-plastic regime.
The amount of fragmented particles as a function of the initial diameter can be qualitatively understood by considering the initial intergranular voids. In the case of big particles, the fragmented particles are polydisperse, as large particles break into medium ones that possibly break again and fill intergranular voids. Beds made of smaller particles show narrower polydispersity.
As a result, voids are less effectively filled with particles of small initial size than for larger ones, as already mentioned by Desmond and Weeks (2014). Thus, for beds made of small initial particles, less fragmented mass is needed to fill voids and render the stress field isotopic. In the limit, small enough particles do not crush at all. This is possibly due to the increase of some kind of ‘surface pressure’ by analogy to capillary fluids that increase stiffly when the diameter goes to zero. It then becomes possible to deform elastically and even compress the solid without breaking particles.
The comparison of the graphs of Figure 4, showing the fragmentation diagram of powders on
one hand and the liquid-vapour diagram of CO2 on the other hand, indicates that the inverse of
the initial particle diameter plays similar role as temperature. The temperature is however a thermodynamic variable while the initial diameter is not, making differences in the definition of the latent heat of phase change and fragmentation energy.
-6-
Figure 5: Mass fractions of the various grain sizes after compression (end of Stage 2).
Figure 6: Photograph of the three main classes of particles collected after compression Test 1, corresponding to particles of 2000-3000 microns initial size. After approximate separation each class is weighted and associated
proportion is reported in Figure 5.
Figure 7: Schematic representation of the fragmentation process. A: Initial granular bed configuration, B: Elastic-plastic deformation and reorganisation processes, C: First grain fracture, D: Fragmentation at constant
pressure, E: Last grain fracture.
As the main differences between liquid-vapour and fragmentation diagrams have been discussed, we now study the similarities. Comparing again the graphs of Figure 4, obvious analogies exist between the fragmentation diagram in the (β-α)-plane (or in the (β-ρ)-plane) and the liquid-vapour diagram in the (p-ρ)-plane. Among these common features, existence of crush granular pressure appears, as well as fragmentation dome and critical point (analogues of the saturation pressure, saturation dome and critical point). In vapour-liquid systems the
most important relations are the saturated pressure (Psat), the saturated densities (or specific
volumes) and the latent heat of vaporisation as functions of temperature. Figure 8 represents the saturated pressure as a function of temperature and the crush granular pressure as a
‘dust’
‘coarse’
‘intact’
-7-
function of the initial diameter. In the latter, the abscissa scale is reversed as the initial diameter plays the inverse role of temperature. These curves have similar behaviour and both have a higher physical limit which is the critical point. Indeed, the analogues of vapour, liquid
and supercritical fluid present at the critical point are respectively initial particles, fragmented mixture and small initial particles that never fragment. The main difference is that the curve
Psat(T) has a physical lower limit which is the triple point. For granular materials no triple
point exists and the crush granular pressure tends to zero when the initial diameter grows. A common form of the saturation pressure is the Antoine (1888) equation:
1 0 s a t 1
B
l o g
(
P
)= A -
T + C
For CO2, A=9.87, B=957.37 and C=14.32 for Psat expressed in Pa and T in K (NIST online
library). This equation is a local approximation of a more complex formula linking saturation pressure and temperature. It results of the combination of liquid and gas equations of state under the constraints of mixture energy and specific volume conservation, equal pressures, equal temperatures and equal Gibbs free energies.
Similar relation for the crush granular pressure as a function of initial particles diameter is considered: 1 1 0 c r u s h 1 6 1
B
l o g
(β
)= A -
d . 1 0
+ C
, with 1 1 1A = 6 . 9 4
B
= - 1 9 6 6
C
= 1 3 4 8
,β
c r u s hin Pa and d in meters.Figure 8 shows the agreement between the Antoine-type relation and experimental data. However, that equation tends to a non-zero constant when the initial diameter increases. In the present context of granular materials, the Antoine relation seems consequently inappropriate. This is not surprising as its origins mentioned above, in particular temperature equilibrium, cannot be transposed to granular materials.
To capture the asymptotic behaviour when the diameter tends to infinity, the following expression is used: 1 c c r u s h 0
β
( )d
= c d
with 1 - c 0 1c
= 5 6 9 8 9 1 P a m
c = - 0 . 6 7 3 8 5
(1)-8-
Figure 8: a) Saturation pressure of CO2 as a function of temperature. Antoine equation corresponds to the grey dashed line. b) Crush granular pressure as a function of the initial diameter. Experimental data are shown with black points while Antoine-type relation is in grey dashed line and the present fit, with Relation (1), corresponds
to the black line. Critical and triple points (when existing) are represented by hollow circles in both a) and b).
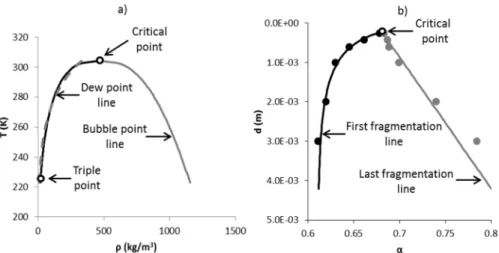
Figure 9 shows fragmentation and saturation domes in the (T-ρ)-plane and (d-
α
)-plane,respectively. The dewpoint line and its analogue, the first fragmentation line, have similar behaviours. The bubble point line and the last fragmentation line behave differently near the critical point. In particular no plateau is observed near this point for powders. As said earlier, another difference is the presence of the triple point for liquid-gas systems. Correlations for the saturation pressure as a function of the temperature exist in the literature (e.g. Span and Wagner, 1996). However, they require many parameters (eight to ten in that reference) to be accurate, in particular near the critical point. In the present work the aim is to evaluate the similarities between the two systems on the basis of simple relations. As a result, a simpler correlation with three parameters only is used to link the crush volume fraction where fragmentation starts as a function of initial particles diameter:
(
- c d4)
c5 c r u s h , 0 3α
( )d
= c
1 - e
with 3 - 1 4 5c
= 0 . 6 1 0 5
c
= 8 3 3 . 3 1 m
c
= - 0 . 0 6 1 3 7
(2)Analogue of this relation for CO2 regarding the saturation density of vapour also gives
satisfying results, except near the critical point (see Figure 9):
(
)
c 2 s a t , 0 2 2 ρ = A 1 - e x p ( - B T) , with 1 1 3 2 - 4 - 1 2 2A
= 1 . 2 3 x 1 0
k g / m
B
= 7 . 7 7 x 1 0
K
c
= 1 2 . 6 7
.The correlation used to fit the fragmentation curve end
α
c r u s h , 1 is:c r u s h , 1 6 7
α
( )d
= c + c d
with 6 - 1 7c
= 0 . 6 7 4
c
= 3 0 . 0 1 4
m
(3)The bubble point line of Figure 9a shows the non-linear evolution of liquid phase saturation density as a function of the temperature while the “last fragmentation line” of Figure 9b, is quite linear versus volume fraction, pointing another difference between liquid-vapour systems and powders.
-9-
Figure 9: a) Saturation dome of CO2 as a function of density. The bubble point line is shown with black lines and the dewpoint line with grey lines. b) Fragmentation dome as a function of the solid volume fraction. The first fragmentation line is shown with black points and the last fragmentation line is shown with grey points. For both
a) and b) critical and triple points (when existing) are represented by hollow circles.
The critical point is now estimated as the intersection of the first and last fragmentation lines.
For soda lime particles the fragmentation critical point corresponds to: - 6
c r i t i c a l
d
= 2 2 3 × 1 0
m
, α c r i t i c a l
= 0 . 6 8 1
and β c r i t i c a l= 1 6 4 M P a
.Determination of the specific fragmentation energy as a function of the initial diameter is now addressed. It corresponds to the latent heat of vaporisation analogue. As heat transfer is neglected during fragmentation, the fragmentation energy is determined as,
∫
c r u s h , 1(d) c r u s h , 0()d v c r u s h v E ( )d = - β d V ,with Ecrush expressed in J/kg, β in Pa and specific volumes vcrush,0 and vcrush,1 in m3/kg.
The specific volumes vcrush,0 and vcrush,1 represent, for a given particle diameter, the specific
volumes where fragmentation begins and ends (analogues of vapour and liquid saturation volumes). To calculate the fragmentation energy, the crush granular pressure is used. For a given initial diameter this pressure is constant during fragmentation and the related fragmentation energy reads,
c r u s h c r u s h c r u s h , 0 c r u s h , 1
E
( )
d
= β
( )(d
v
( )d
- v
( ))d
.Experimental data for c r u s h c r u s h , 0 c r u s h , 1
Δ v
( )
d
= v
( )d
- v
( )d
are shown in Figure 10.Figure 10: Specific volume variations (Δvcrush(d)) of soda lime granular bed during fragmentation as a function of initial diameter.
-10-
It remains to compute the specific fragmentation energy and two specific definitions may be considered in this aim. In the first definition the total mass of powder is considered, yielding Ecrush representing the specific energy, per unit mass of initial powder.
It can be divided by the mass fraction of fragmented powder frag frag
tot
m
m
=
Y
as only part of the powder sample is fragmented. Both definitions are considered in the graph b) of Figure 11 where these energies are shown as functions of particle diameter.
Figure 11: a) Specific latent heat of vaporisation of CO2 as a function of temperature. b) Specific crush energy as a function of particles initial diameter.
Both definitions are useful. The first one, defined on the basis of unit mass of initial powder, is needed for global computations, at the scale of granular beds. The second one provides information for fragmented particles and is more suitable for local computations, as done for example in Antonyuk et al. (2006), Moreno-Atanasio and Ghadiri (2006).
Figure 11-b provides extra information. It is often considered that fragmentation energy is directly linked to the specific surface of the grains. Such dependence doesn’t appear in this figure as the fragmentation energy is nearly constant when the particle diameter varies of a factor 3, the specific interfacial area varying from
2
1 m
/ k g
for the largest particles of Table
1 (2500
µ
m initial diameter) to3
2
m
/ k g
for those of 1 mm initial diameter. This remark supports the observations of McSaveney and Davies (2009).
It is also interesting to compare specific energies reported in Figure 11b to literature data. Bergstrom et al. (1961) reports specific crush energy of about 2 kJ/kg for soda lime particles significantly bigger than those considered in the present study. Jandacka et al. (2009) considers powders of mineral almandine and reports specific crush energies of about 3 kJ/kg.
Lade et al. (1996) reports lower energy (about 0.6 kJ/kg) but considers softer materials (soil).
Energy levels of Figure 11b seem consequently in good agreement with these data, in particular with those of Bergstrom et al. (1961).
Practical use of the graphs
As an engineering example of present collected data let us consider a bumper aimed to stop a car of 1000 kg at velocity 198 km/h (u=55 m/s). The corresponding kinetic energy is 1513 kJ.
The initial powder grain size must be chosen in accordance to the impact pressure Pi m p a c t.
Assuming sound speed
c
in the glass powder of the order of 300 m/s (computed with Relation (5) avec checked against Rogue et al. (1998) data) impact pressure is approximately given by,
5
P
i m p a c t= P
a t m(
+
αρ)
c u = 1 0 + 0 . 6
×
2 5 0 0
×
3 0 0
×
5 5
≈
2 5 M P a
where
(
αρ)
=
×
30 . 6
2 5 0 0 = 1 5 0 0 k g / m
-11-
For such pressure level Figure 8b indicates that particles must have a diameter greater than 3
mm. For these particles, the crush energy is about
E
c r u s h ≅3 k J / k g
. Thus 504 kg of glass powder with 3 mm initial diameter will be appropriate to dissipate the kinetic energy of the 1000 kg car impacting at 198 km/h.IV. Fragmentation diagram modelling
In this section modelling of the fragmentation diagram is addressed. The aim is to reproduce the experimental diagram in the (β,α)-plane (Figure 4a) with the help of an EOS expressing the crush granular pressure β as a function of volume fraction and initial particle diameter. Two EOS are considered. The first one assembles piecewise functions while the second one mimics the van der Waals formulation.
1) Granular equation of state
In this section, we address modelling of compaction curves with piecewise functions. In this frame the granular pressure β is given by:
0 c r u s h , 0 c r u s h c r u s h , 0 c r u s h , 1 1 β ( )α i f α < α ( )d β ( α , d)= β ( )d i f α ( )d < α < α ( )d β ( α , d)o t h e r w i s e
αcrush,0 and αcrush,1 are the solid volume fractions crush bounds representing respectively the
beginning and end of the fragmentation process. For a given powder these bounds depend
only of the particles initial diameter. β0 is the compaction curve before fragmentation and
depends only of the volume fraction. βcrush corresponds to the crush granular pressure
occurring during fragmentation. It also depends only on the initial diameter. Last, β1 is the
compaction curve after fragmentation and depends on volume fraction and initial diameter. Figure 12 illustrates the preceding definitions, these functions being determined from experimental data.
Figure 12: Schematic representation of the ‘fragmentation diagram’.
The analytical expressions of βcrush(d), αcrush,0(d) and αcrush,1(d) were determined previously
and correspond to Equations (1), (2) and (3).
The compaction curve before fragmentation must be now considered. Experimental observations indicate that this curve is independent of the initial particles diameter.
-12-
intergranular efforts and contains consequently configurational energy, representing the energy stored at particles contacts. The granular EOS is determined by quasi-static compression of powders. The system volume is measured, and the granular bed solid volume fraction is deduced, as a function of the applied constraint. This type of experiment is described for example in Kuo et al. (1980), Elban and Chiarito (1986), Bdzil et al. (1999) and in the present work. Such measurements consequently summarize all three dimensional contacts and efforts and record their collective effects.
It is possible to fit corresponding curves (granular pressure – solid volume fraction α) by the
following function (Saurel et al., 2010), representing the configuration energy (the granular pressure will be determined subsequently):
(
)
n 0 0 0 0 0 ( 1 )ln( 1 ) ( 1 ln( 1 ))( ) ( 1 )ln( 1 ) , if , B( ) 0, otherwise; τ α α α α α α α α α α = − − + + − − − − − < (4)where α0corresponds to the solid volume fraction when the granular constraint is zero (
0 0.6
α = in the present work). This volume fraction depends on the powder material, on its
morphology etc. It is clear in (4) that B(α0)=0 (that ensures continuity of B with respect to
α
atα α
= 0). Parametersτ
and n are also characteristics of a given powder and moreprecisely of its response during quasi-static loading.
For the present application, it is necessary to express first and second derivatives of (4). The first derivative provides the granular pressure,
( )
0 = n - 1 n 0 01 - α
(B
)α
d B
- α ρ τ n
l n
i f α > α
β
( )α
= α ρ
d α
1 - α
τ
0
o t h e r w i s e
,where ρ represents density of the material (2500 kg/m3 for soda lime glass).
The second derivative of (4) is provides the square “granular sound speed” (Kapila et al., 2001), 2 2 2 gran 2 d B c d α α = , (5) with,
(
)
n 1 n 2 n n 0 1 B( ) B( ) n ( n 1 ) ln( 1 ) 1 ² , if d² B 1 d ² 0, otherwise. α α α α α α α − − + − − + < = − τ τ τFor soda lime, parameters associated to these functions are:
3 τ = 4 1 5 1 0 J / k g n = 1 . 0 0 1
Compaction curves after fragmentation are now addressed. These curves depend on volume fraction and initial particles diameter. As this part is also a compaction process, we use the
-13- n (n )d - 1 ()d 0 1 0
1 - α
(B
)α
- α ρ τ
( )d
(n
)d
l n
+ F
( )d
i f α > α
( )d
β
(α , d
)=
1 - α
( )d
(τ
)d
0
o t h e r w i s e
(6)Now coefficients α0, τ and n are all functions of the initial diameter. After the fragmentation
process, the new compaction curve starts from the end crush volume fraction αcrush,1(d). Thus
α0(d) becomes α0(d)=αcrush,1(d). In order to enforce continuity of the compaction curve during
and after fragmentation, function F must be equal to the crush pressure F(d)= βcrush(d) given
by Relation (1).
The various loading curves are then used to determine functions τ(d) and n(d) yielding the following fittings, 8 9 (d) c c d τ = + with 3 8 7 9
c
= 1 1 4 × 1 0
J / k g
c
= - 2 . 8 5 7 × 1 0
J /
(k g . m
) (7) 2 3 1 0 1 1 1 2 1 3n
( )d
= c
+ c d + c
d
+ c d
with 1 0 - 1 1 1 - 2 1 2 7 - 3 1 3c
= 1 . 0 1 4 6
c
= 3 9 4 . 7 7
m
c
= - 2 1 4 2 0 3
m
c
= 2 . 5 6 2 3 1 0
m
(8)These relations are compared to experimental data in the Figure 13, showing good agreement.
Figure 13: Equation of state of crushed powder: a) Function τ as a function of the initial diameter. b) Function n as a function of the initial diameter. Experimental data are shown with square symbols.
Figure 14 shows the overall comparison between the experiments and the present EOS, based on Relations (1-8).
-14-
Figure 14: (β,α)-crush diagram of soda lime glass powder. Experiments are shown in black lines and computations in dash grey lines. The computed fragmentation dome is represented by the continuous grey line.
With the present formulation the phase diagram is described by a set of equations (1-8). We now address the same goal with a unique formulation.
2) van der Waals - type EOS
We now address modelling of the fragmentation diagram with an EOS quite similar to the Van der Waals EOS. For reminder, the Van der Waals EOS reads,
2
ρ r T
P =
- a ρ
1 - b ρ
,where P, ρ and T represent respectively the pressure (Pa), density (kg/m3) and temperature (
K).
r = R / W
with R the gas constant (J/mol/K) and W its molar weight (kg/mol). a and b are constant parameters characteristic of a given fluid expressed from critical pressure and temperature c c P T r a 64 27 2 2 = and c cP
rT
b
8
=
. For CO2, Tc =304.18K and 5 c P =73.80×10 Pa(Suehiro et al., 1996). As a result, a=188.8 Pa.m6/kg2 and b=9.735 x 10⁻⁴ m3/kg. Tabulated
data from NIST and van der Waals EOS for CO2 are reported in Figure 15, showing
qualitative agreement. Van der Waals formulation predicts metastable states, not reported in tabulated data but present in reality. It also appears that the phase transition density range differs noticeably. Many authors have proposed enhanced version of Van der Waals equations by modifying either the attractive and repulsive terms (Redlich and Kwong, 1949, Peng and Robison, 1976, Patel and Teja, 1982, Reiss et al., 1959). In the present work, the aim is to reduce the fragmentation phase diagram with as simple an EOS as possible.
-15-
Figure 15: Comparison between the tabulated pressure (grey lines) for CO2 and computed pressure using Van der Waals EOS (dashed grey lines) as a function of density for 250, 300 and 350 K.
In this direction some differences between liquid-vapour phase change and fragmentation process must be pointed out. For a gas, following an isotherm, the pressure increases slowly as a function of density while the pressure of the liquid increases stiffly. For the fragmentation process, opposite behaviour is observed regarding granular pressure as a function of the volume fraction. Furthermore, the density starts to zero for fluids while the solid initial volume fraction is never zero when granular pressure appears. In order to have similar qualitative behaviour between the fragmentation curves and the liquid-vapour phase change curves, a new scaling is considered given the following constraints:
-
[ ]
[
*]
max 0 * , 0 1 , : α α α ֏ , with * max α a constant to define.- Decrease the granular pressure slope for small α*.
- Increase the granular pressure slope for large α*.
With these constraints, the following scaling is adopted:
(
- c1 5( α - α 0))
*1 4
α
= c
1 - e
(9)
In order to qualitatively match fragmentation curves and CO2 isotherms, the following
additional constraints are considered:
- α*max ≈1000(maximum rescaled volume fraction),
- * ≈500
crit
α (rescaled volume fraction of critical point).
From these constraints, constants
c
14and c15are deduced:c
14=
1000
and c15 =10.Typical pressure compression record is shown in Figure 16 as a function of αand α *.
Figure 16: Granular pressure for a granular bed of soda lime with particles of 0.5-0.6 mm diameter as a function of a) volume fraction α and b) rescaled one α*.
-16-
The granular van der Waals EOS in consideration now reads, *
* 2 *
c
( )d
α
β
(α , d
)=
1 - b α
- a α
(10)where c(d) is the analogue of rT and is therefore function of the initial particles diameter.
Fig 15b curve fitting was addressed with parameters c=2.1 105 Pa, b=7.9 10-4 and a=6 10-2
Pa, but it appeared impossible to capture both plateau and post fragmentation compaction
curve, as shown in Figure 17.
To correct this weakness, the quadratic term of the van der Waals EOS is changed to a cubic
one and an exponent is added to the short distances repulsive term: *
* 3 * 0 . 4 1
c
( )d
α
β =
- a α
(1 - b α
) (11)Doing so, attractive effects are increased while short distance repulsive ones are decreased. There is no particular physical relevance in these changes, just an attempt to improve curve fitting of Figure 16b. With these modifications improved agreement is found with the
following parameters
a = 0 . 4 5 P a
, - 3b = 1 . 0 0 × 1 0
and 5c = 2 . 1 2 × 1 0
P a
as shown in Fig. 17.Figure 17: Granular pressure as a function of α*: Comparison of the various theoretical formulations for a granular bed with given initial particle size. Experimental data are shown in black lines, van der Waals approximation (10) is shown with grey dashed lines and formulation (11) is shown with grey lines, showing
improvements.
The agreement being better with Formulation (11) we now address determination of c as a function of initial particle size d. Parameters a and b are kept constant and c(d) is determined for each curve using to a least square method. Figure 18 represents the evolution of function c versus initial diameter.
-17-
For initial diameter smaller than the critical one (
d < d
c r i t), function c(d) is constant as nofragmentation appears and all compression curves are superimposed, independently of the
particle size. In order to fit previous dataset, for
d < d
c r i t, several functions have been testedand the following formulation, with three parameters only, was retained:
(
)
[
]
(
)
[
]
− − > − − = otherwise d c c d d if d c c d c c crit crit c 18 18 17 16 17 16 exp 1 exp 1 ) ( with 1 6 - 1 1 7 1 8c
= 1 3 6 9 1 8
P a
c
= 9 1 0 . 8
m
c
= - 0 . 4 9 9
(12)It enables capturing both the stiff slope of c(d) when d → dcrit+ and the decreasing slope of
c(d) when
d
→
0
.
003
m
.Figure 19 compares experimental data and computations with function c(d) given by (12).
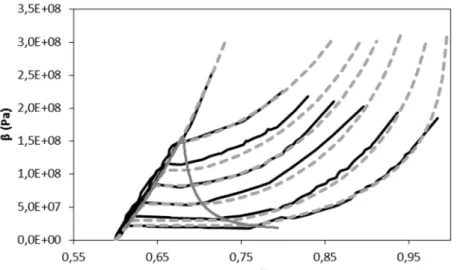
Figure 19: Experimental data (black lines) and EOS (11) (dashed grey lines). a) Plot in the (β,α)-plane. b) Plot in the (β,α*)-plane
The modified Van der Waals EOS (11) is qualitatively in good agreement with the experiments. However, as for the original van der Waals formulation, negative pressures appear in Figure 19. Negative pressures (tensions) may occur in pure liquids, under specific conditions (Brin, 1956). In dry granular media, this is clearly impossible. The van der Waals type formulation can thus be understood as an approximation of the pre and post fragmentation states, not the ‘phase-transition’ zone. It thus appears that the various van der Waals type formulations examined in the present study are inappropriate to model the phase diagram of crushed powders. This is related to non-convexity of van der Waals type EOS (Saurel et al., 2008) in the crush zone. The physics of granular material in breakage conditions differs of liquid-vapour phase change, as already mentioned with respect to Antoine relation. Variants of the van der Waals EOS (Redlich and Kwong, 1949, Peng and Robison, 1976, Patel and Teja, 1982, Reiss et al., 1959) consequently seem inappropriate as well.
V. Conclusions
The analogue of liquid-vapor phase diagram has been determined for granular beds made of quasi-monodisperse spherical particles. Under compression effects, particles fragment and form a mixture in the general sense, made of initial particles and fragments. This “phase transition” process occurs at a precise pressure for a given particle size. The energy needed to fragment the bed varies as a function of particle size. The corresponding crush diagram
-18-
contains relevant information such as for example the analogue of the latent heat of vaporisation and is determined on the basis of simple experiments.
Model equations of state have been examined to reproduce the crush diagram. Accurate representation has been obtained with assembled piecewise functions while van der Waals type formulations seemed inappropriate.
Many perspectives can be considered to continue these investigations with:
- a study of time dependence and relaxation time to equilibrium,
- the influence of initial temperature on crush-up,
- the building of a flow model containing such phase transition process.
Acknowledgements. The authors are very grateful to anonymous referees that helped to
improve significantly quality of the manuscript.
References
Antoine, C. (1888), Tensions des vapeurs; nouvelle relation entre les tensions et les températures. Comptes Rendus des Séances de l'Académie des Sciences (in French) 107: 681–684, 778–780, 836–837
Antonyuk, S., Khanal, M., Tomas, J., Heinrich, S., & Mörl, L. (2006). Impact breakage of spherical granules: experimental study and DEM simulation. Chemical Engineering and Processing: Process Intensification, 45(10), 838-856
Bdzil, J. B., Menikoff, R., Son, S. F., Kapila, A. K., & Stewart, D. S. (1999). Two-phase modeling of deflagration-to-detonation transition in granular materials: A critical examination of modeling issues.Phys. Fluids 11(2), 378-402
Bergstrom, B. H., Sollenberger, C. L., & Mitchell Jr, W. (1961) Energy aspects of single particle crushing. Trans. AIME, 220, 367-372.
Brin, A. Y. (1956).Contribution à l'étude de la couche capillaire et de la pression osmotique. Doctoral dissertation, Paris
Davison, L., Grady, D. E., & Shahinpoor, M. (2012). High-pressure shock compression of solids II: dynamic fracture and fragmentation. Springer Science & Business Media
Desmond, K. W., Weeks, E. R. (2014) Influence of particle size distribution on random close packing of spheres, Physical Review, E90, 022204.
Einav, I (2007.a) Breakage mechanics – Part I: Theory, J. Mech. Phys. Solids 55, 1274–1297.
Einav, II (2007.b) Breakage mechanics – Part II: Modelling granular materials, J. Mech. Phys. Solids 55, 1298–1320.
Elban, W. & Chiarito, M. (1986) Quasi-static compaction study of coarse HMX explosive. Powder Technol. 46 (2–3), 181–193.
Fortov, V. E., Altshuler, L. V., Trunin, R. F., & Funtikov, A. I. (2013). High-Pressure Shock Compression of Solids VII: Shock Waves and Extreme States of Matter. Springer.
Griffith, A. A. (1921) The phenomena of rupture and flow in solids. Philosophical transactions of the Royal Society of London. Series A, 163-198
Jandacka, P., Hlavac, L. M., Madr, V., Sancer, J., & Stanek, F. (2009). Measurement of specific fracture energy and surface tension of brittle materials in powder form. International journal of fracture, 159(1), 103-110.
Kapila, A. K., Menikoff, R., Bdzil, J. B., Son, S. F., & Stewart, D. S. (2001). Two-phase modeling of deflagration-to-detonation transition in granular materials: Reduced equations.Phys. Fluids13(10), 3002-3024.
Kuo, K. K., Yang, V. and Moore, B.B. (1980) Intragranular stress, particle-wall friction and speed of sound in granular propellant beds. Journal of Ballistics 4(1), 697-730
Lade, P. V., Yamamuro, J. A., & Bopp, P. A. (1996). Significance of particle crushing in granular materials.Journal of Geotechnical Engineering,122(4), 309-316
Mott, N. F. (1948). Fracture of metals: theoretical considerations. Engineering,165(4275), 16-18 Mott, N. F. (2006). Fragmentation of Shell Casings and the Theory of Rupture in Metals.
-19-
McSaveney, M. J., & Davies, T. R. (2009). Surface energy is not one of the energy losses in rock comminution. Engineering Geology, 109(1), 109-113.
Moreno-Atanasio, R., & Ghadiri, M. (2006). Mechanistic analysis and computer simulation of impact breakage of agglomerates: effect of surface energy. Chemical engineering science, 61(8), 2476-2481
NIST: National Institute of Standard and Technology, Chemistry WebBook,
http://webbook.nist.gov/chemistry/
Passman, S. L., Nunziato, J. W., & Walsh, E. K. (1984). A theory of multiphase mixtures (pp. 286-325). Springer New York
Patel, N. C. and Teja, A. S. (1982) A New Cubic Equation of State for Fluids and Fluid Mixtures. Chem. Eng. Sci., 37, 463-473
Peng, D. Y. and Robinson, D. B., (1976) A New Two-Constant Equation of State. Ind. Eng. Chem. Fundam., 15, 59-64
Redlich, O. and Kwong, J. N. S. (1949) On the Thermodynamics of Solutions. V: An Equation of State. Fugacities of Gaseous Solutions. Chem. Rev., 44, 233-244
Reiss, N. R., Frisch, H. L. and Lebowitz, J. L. L. (1959) Statistical Mechanics of Rigid Spheres. J. Chem. Phys. 31: 369-380
Rogue, X., Rodriguez, G., Haas, J. F., & Saurel, R. (1998) Experimental and numerical investigation of the shock-induced fluidization of a particles bed. Shock Waves, 8(1), 29-45.
Saurel, R., Petitpas, F., & Abgrall, R. (2008). Modelling phase transition in metastable liquids: application to cavitating and flashing flows. Journal of Fluid Mechanics,607, 313-350
Saurel, R., Favrie, N., Petitpas, F., Lallemand, M. H., & Gavrilyuk, S. L. (2010). Modelling dynamic and irreversible powder compaction.Journal of Fluid Mechanics,664, 348-396
Span, R., Wagner, W. (1996) A New Equation of State for Carbon Dioxide Covering the Fluid Region from the Triple-Point Temperature to 1100 K at Pressures up to 800 MPa. J. Phys. Chem. Ref. Data, 25, 1509–1596
Suehiro, Y., Nakajima, M., Yamada, K., Uematsu, M. (1996) Critical parameters of {xCO2 + (1 - x)CHF3} for x = (1.0000, 0.7496, 0.5013 , and 0.2522), J. Chem. Thermodyn., 28, 1153-1164