HAL Id: in2p3-00956975
http://hal.in2p3.fr/in2p3-00956975
Submitted on 10 Mar 2014
HAL is a multi-disciplinary open access
archive for the deposit and dissemination of
sci-entific research documents, whether they are
pub-lished or not. The documents may come from
teaching and research institutions in France or
abroad, or from public or private research centers.
L’archive ouverte pluridisciplinaire HAL, est
destinée au dépôt et à la diffusion de documents
scientifiques de niveau recherche, publiés ou non,
émanant des établissements d’enseignement et de
recherche français ou étrangers, des laboratoires
publics ou privés.
A new low intensity beam profiler for SPIRAL2
J.L. Vignet, J. Pancin, P. Gangnant, E. Gueroult, N. Renoux
To cite this version:
J.L. Vignet, J. Pancin, P. Gangnant, E. Gueroult, N. Renoux. A new low intensity beam profiler
for SPIRAL2. 2nd International Beam Instrumentation Conference (IBIC2013), Sep 2013, Oxford,
United Kingdom. pp.841-843, 2013. �in2p3-00956975�
A NEW LOW INTENSITY BEAM PROFILER FOR SPIRAL2
JL. Vignet, J. Pancin, P. Gangnant, E. Gueroult, N. Renoux, GANIL, France
Abstract
In the framework of SPIRAL 2 ion beams, several beam profile monitors are presently being developed at GANIL. One of them is a low-intensity beam-profile monitor that works as a secondary electron detector. This Emission-Foil Monitor (EFM) will be used in the radioactive beam lines of SPIRAL2 and in the experimental rooms of this new facility. The ions produce secondary electrons when they are stopped in an aluminium emissive foil. The electrons are then accelerated using an electric field and guided using a magnetic field to a double-stage microchannel plate (MCP). A 2D pixellated pad plane placed below the MCP is used to collect the signals. The magnetic field created by permanent magnets in a closed magnetic circuit configuration permits the beam-profile reconstruction to be achieved with a good resolution. The EFM can visualize beam-profile intensities between only a few pps to as much as 109 pps and with energies
as low as several keV. This profiler has been under development since 2009 and is currently manufactured. Recent results of this monitor are presented in this article.
INTRODUCTION
The new Spiral2 facility is under construction at Ganil and the first extracted beams are scheduled for 2014. In order to detect stable and radioactive beams, a new profiler has been developed and will be installed on the Spiral2 transfer lines and in the associated experimental areas in 2014. The EFM (Emissive Foil Monitor) is dedicated to stable and radioactive beams with an energy range in between 5 keV/u and 25 MeV/u with beam intensities from a few pps to 109 pps. A prototype has
been developed since 2009 [1] [2] and ten EFMs will be constructed in 2013.
EFM DESCRIPTION
Several EFM have already been developed in the past [3, 4]. It is however the first time a closed magnetic circuit configuration using permanent magnet is used to achieve a good spatial resolution. The Emissive Foil Monitor (EFM) is fixed on a pneumatic cylinder mounted on a CF150 flange to be installed and inserted easily in the beam line. This detector, oriented at 45° in the beam line, is composed of an aluminum foil (Emission Foil), a magnetic and electrostatic drift area associated with an amplification system with Micro Channel Plates (MCP) (see figure 1) mounted on a pixellated kapton board (see figure 2). Under the impact of the beam nuclei, secondary electrons are emitted from the foil. They are then accelerated by an electrostatic field applied between the emissive foil (EF) (about -2 kV) and a grounded wire grid positioned at 4 mm. Fours NeFeB permanent magnets of
1,4 Tesla persistent magnetic field, inserted in a magnetic circuit made of ARMCO Iron pieces, are used to create a homogeneous magnetic field in between the EF and the MCPs. Once the electrons have been accelerated, they are guided on 55 mm only by the magnetic field and follow a helical trajectory. They are then slowed down by an electric field applied in between a grounded grid and the first MCP surface. This grounded grid is positioned at 4 mm from the MCPs and this gap permits to optimize the electron energy for the MCPs. The electric field is zero in between both grounded grids, which is an advantage to avoid any deformations of the field lines by the detector mechanics or the beam tubes. The electron amplification system is composed of two MCPs (Hamamatsu F1217-01) assembled in chevron structure to provide a high amplification gain of 10 7. The
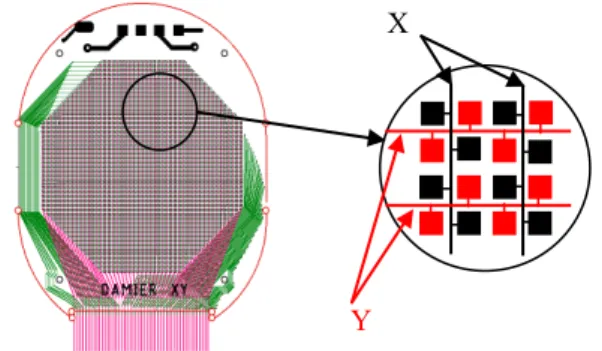
signal of the electrons exited the MCPs is read using one X-Y matrix of 47 strips with 1 mm pitch.
Figure 1: general view of the EFM head. The circular active detection area has a diameter of 42 mm. The matrix board is composed of 500 µm x 500 µm pixels connected alternatively to make X and Y strips (see figure 2). These strips are connected via a Flex Kapton cable to a digital electronic acquisition system developed at GANIL of 2 x 47 channels. Each channel integrates the charge of the associated strip in a capacitor and performs a current-voltage conversion
Figure 2: view of the XY matrix with a zoom on the strip connection. Grounded grids foil M CP Magnet X Y
Proceedings of IBIC2013, Oxford, UK WEPF14
Beam Profile Monitors
ISBN 978-3-95450-127-4 841 Copyright c○ 2013 by J A C oW — cc Cr eati v e Commons Attrib ution 3.0 (CC-BY -3.0)
TRAJECTORY SIMULATION
Electrons trajectories in between the emissive foil and the MCP have been calculated taking into account the electric and magnetic field. Simulations have been performed using Mathematica 7.0 for magnetic field calculation and Simion 8.0 for the electrons transport. Different magnetic geometries were simulated with an adapted electric field ensuring a minimum deviation of the electrons.
Figure 3: Best magnetic configuration calculated with the simulations
The shifts in X and Y directions experienced by the electrons from the EF to the MCP are calculated using the simulations. An example of electrons trajectories projected on the MCP surface is shown on figure 4.
Figure 4: SIMION simulation results for secondary electrons emitted from the foil with a high voltage of -2kV and a magnetic field of 280 G.
These shifts depend on the electron initial position and are smaller in the center than on the edges because of the magnetic field non homogeneities.
In the best configuration (figure 3), the systematical deviations are in-between 0.1 and 0.8 mm for an emission area of 30 mm x 30 mm2 and for a foil and MCP voltage
respectively of – 2 kV and-1kV.
EXPERIMENTAL RESULTS
The EFM was tested at GANIL with Ar ions of 4.8 MeV/u and 4.8 keV/u. The beam intensity was varied from 10 to 1010 pps.
Fours Permanent magnets of NdFeB with a magnetic induction of 1.4 Tesla (N50) have been used. Two magnets of 35 mm x 70 mm x 10 mm are assembled on each side to create a homogenate magnetic field of around 300 Gauss in all the drift volume like the figure 3
configuration. The electronic acquisition used was the standard GANIL electronic profiler and obtained profiles were displayed with the GANIL profiler software.
Result with Stable
40Ar
6+at
4.8 MeV/u
Test with calibration pattern To estimate the profiler
spatial resolution, a mask was installed just before the profiler (see figure 5). The position of each hole was measured with the EFM and reported on figure 5.The beam intensity was 5×10⁶ pps and the high voltages
applied were -2kV on the foil and -1.2 kV on the microchannel plates. The shift of 3 mm in Y is due to misalignment of the profiler on the beam line.
Figure 5: Holes of the mask in blue and measured positions in red.
Obtained results are in good agreement with theoretical positions with shifts below 0.5 mm.
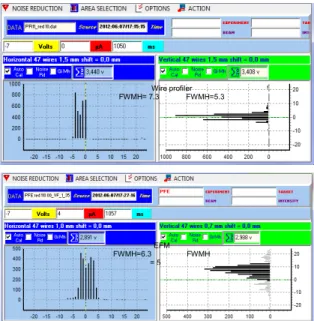
Profiles comparison EFM beam profiles were
compa-red with profiles from a wire gas profiler installed at the same position on an opposite flange. The wire gas profiler is composed of X and Y tungsten wires enclosed in a volume filled with Ar+CO2 (20%) at 1 bar. Beam energy must be at least 3 MeV/u because of the thickness of the entrance window of the Gas profiler,
Figure 6: Obtained profiles on the two profilers with 106
pps of 40Ar6+ beam: gH and gV are the centroid position
of the profile with respect to the central position of the beam and mH or mV are the FWHM of each profile.
-8 -6 -4 -2 0 2 4 6 8 10 -20 -15 -10 -5 0 5 10 15 20 Gas gh=1.5 mh=3.75 gV=-0.3 mV=7 EFM gh=0.8 mh=4 gV=3.8 mV=7.4 magn
WEPF14 Proceedings of IBIC2013, Oxford, UK
ISBN 978-3-95450-127-4 Copyright c○ 2013 by J A C oW — cc Cr eati v e Commons Attrib ution 3.0 (CC-BY -3.0)
Distances between each wire are 1 mm for the gas profiler and distances between each strip are 1 mm for the horizontal EFM profile and 0.7 mm for the vertical profile (due to the 45° section projection in this plane).
Except the difference between vertical profiles positions (the profiler was not aligned on the beam line), EFM profile is quite similar to the one obtained with the gas profiler.
Results with
40Ar
6+at 4.8 KeV/u
The EFM has been mounted on the LIRAT beam line of the GANIL accelerator to test it with very low energy radioactive beam. Foil high voltage was increased to check if the low energy beams can be deflected. The beam intensity was 7x10⁹ pps. We can see figure 7 that
there are no effect on the horizontal profile and a small effect on the vertical (0.5 mm for a foil high voltage variation between -0.7 and -2 kV).
Figure 7: Centroid profile position versus variation of the foil High Voltage.
EFM Beam profiles have been compared whit a grid profiler (SEM) at the same position (see figure 8). Beam intensity has been increase to 1010 pps to be compatible
with the range intensity of the grid profiler. EFM profiles are narrowed than SEM profile (respectively -14 and -6 % for the horizontal and vertical).
Figure 8: Profile comparison between grid profiler and EFM.
CONCLUSION
A new beam profile monitor has been developed at Ganil using magnetic and electrostatic field and micro-channel plate amplification. Simulations have shown that obtained results are good with a resolution below 1 mm on the whole active area. Experimental tests have also confirmed that the Emissive Foil voltage does not disturb the very low energy beams before hitting the foil. The profiles obtained with the EFM and a wire profiler are quite similar enough to confirm the good working of the device.
This new profiler will be installed on the new Spiral2 facilities in 2014. It might also replace the gas wire profilers installed on the Ganil lines in order to visualize beams profiles at low energy (below 3 MeV/u. Ten of these profiler are built and will be assembled at the end of this year.
REFERENCES
[1] JL Vignet et al., GANIL, The new beam profile monitor for SPIRAL2, Proc of DIPAC conf 2009, TUPB07 (2006) 176, http://jacow.org/.
[2] C. Jamet et al., GANIL, Beam diagnostic overview of the Spiral2 RIB section, Proc of DIPAC conf 2011, TUPD06 (2011), http://jacow.org/.
[3] O.H. Odland et al., GANIL, a fast positive sensitive microchannel plate detector for ray tracing of charged particules, NIM A,378, (1996) 149-154.
[4] D. Shapira et al., A fast accurate position-sensitive timing detector based on secondary electron emission, NIM A454, (2000) 409-420.
-2 -1 0 1 2 3 4 5 6 0.7 0.8 0.9 1 1.1 1.2 1.3 1.4 1.5 1.6 1.7 1.8 1.9 2 pr ofi le ce nt ro id (m m ) Ht foil (kV)
position Hor profile variation position Vert profile variation
Wire profiler FWMH= 7.3 FWMH=5.3
EFM FWMH=6.3 FWMH
= 5
Proceedings of IBIC2013, Oxford, UK WEPF14
Beam Profile Monitors
ISBN 978-3-95450-127-4 843 Copyright c○ 2013 by J A C oW — cc Cr eati v e Commons Attrib ution 3.0 (CC-BY -3.0)