ANALYSIS OF THE INTERACTION BETWEEN AIR
TRANSPORTATION AND ECONOMIC ACTIVITY:
A WORLDWIDE PERSPECTIVE
Mariya A. Ishutkina and R. John Hansman
This report is based on the Doctoral Dissertation of Mariya A. Ishutkina
submitted to the Department of Aeronautics and Astronautics
in partial fulfillment of the requirements for the degree of
Doctor of Philosophy at the Massachusetts Institute of Technology.
The work presented in this report was also conducted
in collaboration with the members of the Doctoral Committee:
Prof. R. John Hansman (Chair)
Prof. John D. Sterman
Prof. Ian A. Waitz
Report No. ICAT-2009-2
March 2009
MIT International Center for Air Transportation (ICAT)
Department of Aeronautics & Astronautics
Massachusetts Institute of Technology
Cambridge, MA 02139 USA
Analysis of the Interaction Between Air Transportation and
Economic Activity: A Worldwide Perspective
by
Mariya A. Ishutkina
Submitted to the Department of Aeronautics and Astronautics on March 11, 2009, in partial fulfillment of the
requirements for the degree of Doctor of Philosophy
Abstract
Air transportation usage and economic activity are interdependent. Air transportation provides employment and enables certain economic activities which are dependent on the availability of air transportation services. The economy, in turn, drives the demand for air transportation services resulting in the feedback relationship between the two. The objective of this work is to contribute to the understanding of the relationship between air transportation and economic activity. More specifically, this work seeks to (1) develop a feedback model to describe the relationship between air transportation and economic activity and (2) identify factors which stimulate or suppress air transportation development. To achieve these objectives this work uses an exploratory research method which combines literature review, aggregate data and case study analyses.
First, this work uses data at the individual country level to identify different types of growth patterns between air transportation passengers and GDP for 139 countries. This analysis is then used to identify twenty-two representative countries which span a range of possible interaction behaviors, geographies and income categories. The case study analysis at the individual country level is performed to describe the air transportation impact for each individual economy. These findings help develop a feedback model which describes the relationship between air transportation and economic activity. Specifically, the analysis is used to describe (1) how air transportation flows of passengers and cargo enable the flows of goods, services, knowledge, tourism, investment, remittances and labor among economies and (2) how air transportation flows can affect the country’s factor, demand and business conditions. The feedback model is then extended to perform quantitative analysis of the evolution of the enabling impact of air transportation in a particular economy. Specifically, a quantitative system dynamics model is developed to describe the interaction between the demand for leisure travel and the resulting enabling impact of tourism on Jamaica’s economy.
Case study analysis is also used to identify factors which may stimulate or suppress air transportation system development. The factors are identified both from the air transportation supply and demand sides. The following supply side change factors are identified: changes in the regulatory framework, infrastructure capability, vehicle capability and airline strategy. The air transportation demand is found to be directly affected by exogenous demand shocks, economic downturns, political and economic sanctions, and the de-velopment of other transportation modes. The analysis also identifies the following change factors which affect the demand indirectly by changing the country’s economic attributes: economic liberalization, institu-tional and political reforms, supporting infrastructure investment, exchange rate fluctuations, political and macroeconomic stability, growing consumer demand, and changes in management practices. This analysis of stimulating and suppressing factors helps to describe the role of government intervention in changing air transportation system development and its impact on economic activity. The results of this work can help guide further development efforts, investment and policy decisions pertaining to air transportation usage especially in developing economies.
Thesis Supervisor: R. John Hansman
Acknowledgments
This work was supported by the MIT’s Global Airline Industry Program under the Alfred P. Sloan Foundation grants # 2002-12-7 and # 2006-3-7, by the U.S. Federal Aviation Administration (FAA) under the Joint University Program (JUP) grant # FAA 95-G-017 and by the U.S. Federal Aviation Administration (FAA) grant # DTFA01-C-00030.
Contents
1 Introduction 27 1.1 Motivation . . . 27 1.2 Research Objectives . . . 31 1.3 Problem Definition . . . 31 1.4 Research Approach . . . 33 1.4.1 Literature Review . . . 341.4.2 Country-Level Data Analysis . . . 34
1.4.3 Case Study Analysis . . . 35
1.4.4 Quantitative Model Analysis . . . 35
1.5 Thesis Outline . . . 36
2 Literature Review 37 2.1 Studies Evaluating Impact of Aviation Using Input-Output Analysis . . . 38
2.2 Studies Evaluating the Enabling Impact of Aviation . . . 39
2.2.1 Eurocontrol Study . . . 39
2.2.2 Air Transport Action Group (ATAG) Study . . . 42
2.2.3 Additional Enabling Impact Studies . . . 42
2.2.4 Proprietary Models . . . 44
2.3 Studies Evaluating the Impact of Changes in Air Transportation Supply . . . 45
2.4 Limitations of Statistical Analysis . . . 47
3 Data Description 49 3.1 Economic Data . . . 49
3.2 Air Transportation Data . . . 50
3.2.1 Air Passenger Data Limitations . . . 50
3.2.2 Air Passenger Data Limitations: Examples . . . 51
3.2.3 Cargo Data . . . 55
3.3 Data Usage . . . 56
4 Analysis of Air Transportation and Economic Development Data 57 4.1 Worldwide Trend Analysis . . . 57
4.3 Country-Level Data Analysis . . . 62
4.3.1 Correlation Analysis . . . 62
4.3.2 Analysis of Growth Behaviors between Passengers and GDP . . . 64
4.4 Case Study Selection Criteria . . . 70
4.4.1 Countries with Stimulated Air Passenger Growth Rates . . . 70
4.4.2 Countries with Suppressed Air Passenger Growth Rates . . . 70
4.4.3 Countries with Average Air Passenger Growth Rates . . . 71
4.4.4 The List of Case Studies . . . 71
4.4.5 Data Sources for Case Study Analysis . . . 73
4.5 Case Studies Summary . . . 74
4.5.1 Case Studies Summary: The Enabled Flows . . . 75
4.5.2 Case Studies Summary: The Change Factors . . . 76
4.5.3 Case Studies Summary: The Interaction Behaviors . . . 76
5 Air Transportation System Change Factors 79 5.1 Air Transportation Supply Change Factors . . . 79
5.1.1 Regulatory Framework . . . 79
5.1.2 Infrastructure Capability . . . 89
5.1.3 Vehicle Capability . . . 95
5.1.4 Airline Strategy . . . 96
5.2 Air Transportation Demand Change Factors . . . 102
5.2.1 Factors Directly Affecting the Demand . . . 102
5.2.2 Factors Indirectly Affecting the Demand . . . 104
5.3 The Role of Government . . . 107
6 The Enabling Impact of Air Transportation 111 6.1 Description of the Enabled Flows . . . 112
6.2 Mapping Air Transportation Flows to Enabled Flows . . . 113
6.2.1 Enabled Flows of Goods . . . 114
6.2.2 Enabled Flows of Services . . . 115
6.2.3 Enabled Flows of Knowledge . . . 115
6.2.4 Enabled Flows of Tourism . . . 115
6.2.5 Enabled Flows of Investment . . . 115
6.2.6 Enabled Flows of Remittances . . . 115
6.2.7 Enabled Flows of Labor . . . 115
6.3 Describing an Economy Using Economic Attributes . . . 116
6.4 Enabling Impact of Business Passengers . . . 117
6.4.1 Impact of Inbound Business Passengers on Firm Strategy and Skilled Labor . . . 117
6.4.2 Impact of Inbound Business Passengers on Capital . . . 118
6.4.3 Impact of Outbound Business Passengers on Skilled Labor and Demand Conditions . 119 6.5 Enabling Impact of Personal Business Passengers . . . 120
6.5.2 Impact of Personal Business Passengers on Unskilled and Skilled Labor . . . 120
6.5.3 Impact of Personal Business Passengers on Skilled Labor and Capital . . . 121
6.5.4 Impact of Personal Business Passengers on Skilled Labor . . . 122
6.5.5 Impact of Personal Business Passengers on Demand Conditions . . . 122
6.6 Enabling Impact of Leisure Passengers . . . 123
6.6.1 Impact of Leisure Passengers on Demand Conditions . . . 123
6.7 Enabling Impact of Cargo . . . 124
6.7.1 Impact of Cargo on Capital . . . 124
6.7.2 Impact of Cargo on Demand Conditions and Firm Strategy . . . 124
6.7.3 Impact of Cargo on Firm Strategy . . . 125
6.8 Summary of Air Transportation Impacts . . . 125
7 Model of Tourism Impact in Jamaica 127 7.1 Introduction . . . 127 7.2 Model Scope . . . 129 7.3 Model Structure . . . 130 7.3.1 Tourism Attractiveness . . . 130 7.3.2 Model Constructs . . . 133 7.4 Results . . . 134 7.5 Model Uncertainty . . . 137 7.6 Model Recommendations . . . 137
7.7 Potential Model Improvements . . . 138
8 Summary and Conclusions 139 A Case Studies 145 A.1 Stimulated Growth: China . . . 146
A.1.1 China: Air Transportation System Development . . . 147
A.1.2 China: Economic Impact of Air Transportation . . . 149
A.1.3 China: Conclusions . . . 151
A.2 Stimulated Growth: India . . . 153
A.2.1 India: Air Transportation System Development . . . 153
A.2.2 India: Economic Impact of Air Transportation . . . 154
A.2.3 India: Conclusions . . . 157
A.3 Stimulated Growth: South Africa . . . 158
A.3.1 South Africa: Air Transportation System Development . . . 159
A.3.2 South Africa: Economic Impact of Air Transportation . . . 161
A.3.3 South Africa: Conclusions . . . 162
A.4 Stimulated Growth: Turkey . . . 163
A.4.1 Turkey: Air Transportation System Development . . . 164
A.4.2 Turkey: Economic Impact of Air Transportation . . . 165
A.5 Stimulated Growth: The United Arab Emirates . . . 168
A.5.1 The United Arab Emirates: Air Transportation System Development . . . 170
A.5.2 The United Arab Emirates: Economic Impact of Air Transportation . . . 171
A.5.3 The United Arab Emirates: Conclusions . . . 172
A.6 Stimulated Growth: Qatar . . . 174
A.7 Stimulated Growth: Vietnam . . . 177
A.8 Stimulated Growth: Lao People’s Democratic Republic . . . 178
A.9 Stimulated Growth: Ireland . . . 180
A.10 Stimulated Growth: Slovakia . . . 182
A.11 Stimulated Growth: Chile . . . 183
A.11.1 Chile: Air Transportation System Development . . . 184
A.11.2 Chile: Economic Impact of Air Transportation . . . 185
A.11.3 Chile: Conclusions . . . 186
A.12 Average Growth: The United States of America . . . 187
A.12.1 The United States: Air Transportation System Development . . . 188
A.12.2 The United States: Economic Impact of Air Transportation . . . 191
A.12.3 The United States: Conclusions . . . 193
A.13 Average Growth: Jamaica . . . 195
A.13.1 Jamaica: Air Transportation System Development . . . 196
A.13.2 Jamaica: Economic Impact of Air Transportation . . . 197
A.13.3 Jamaica: Data Sources Comparison . . . 199
A.13.4 Jamaica: Conclusions . . . 200
A.14 Average Growth: Kuwait . . . 200
A.15 Suppressed Growth: Libya . . . 202
A.15.1 Libya: Air Transportation System Development . . . 203
A.15.2 Libya: Economic Impact of Air Transportation . . . 204
A.15.3 Libya: Conclusions . . . 206
A.16 Suppressed Growth: Algeria . . . 207
A.17 Suppressed Growth: Zimbabwe . . . 208
A.18 Suppressed Growth: Belgium and Switzerland . . . 210
A.19 Suppressed Growth: Bulgaria . . . 213
A.20 Suppressed Growth: Maldives . . . 215
A.21 Suppressed Growth: Indonesia . . . 217
B Data Sources and Glossary 221 B.1 Air Transportation Data Sources . . . 221
B.1.1 Airline Data . . . 222
B.1.2 Airport Data . . . 222
B.1.3 Origin and Destination Traffic Data . . . 223
B.2 Economic Data Sources . . . 224
B.2.1 Regional Aggregates . . . 225
B.3 Glossary . . . 228 B.4 Freedoms of the Air . . . 229
C Data Summary: East Asia & Pacific 231
D Data Summary: Europe & Central Asia 241
E Data Summary: Latin America & Caribbean 255
F Data Summary: Middle East & North Africa 267
G Data Summary: North America 277
H Data Summary: South Asia 279
I Data Summary: Sub-Saharan Africa 283
J Data Summary: Other Tables 295
K Jamaica: Supplemental Materials 297 K.1 Data Trends . . . 297 K.2 Model Source Code . . . 301
List of Figures
1-1 The correlation coefficient between air transportation passengers and GDP using world ag-gregate time-series data during the 1970–2005 time period is 0.99. . . 28 1-2 The correlation coefficient between air transportation passengers and GDP using cross-sectional
data for 137 countries for year 2005 is 0.93. The sample excludes United States and Japan, if included, R2= 0.91, correlation coefficient = 0.95. . . . 28 1-3 Feedback-based interaction between Air Transportation System and an Economy. (Adapted
from Hansman [97].) . . . 29 1-4 The air transportation and GDP growth patterns vary with time and across different regional
aggregates. . . 30 1-5 Observable Air Transportation Flows of Passengers and Cargo give rise to Enabled Flows
which directly affect the Economy. . . 31 1-6 This feedback model describes the relationship between air transportation and economic activity. 32
2-1 Economic catalytic impacts of air transport: Figure 3-2 from the Eurocontrol study [46]. . . . 40 2-2 Catalytic effects of air transportation in Europe [46]. Demand-side effects over the decade
leading up to 2003 have been small, while supply-side effects have contributed up to 4% of the European Union GDP. Notes: Air transport usage variable equates 10 air passengers to 1 metric ton of air freight. The data set consisted of 24 European countries over 10 years. . . . 40 2-3 Economic impact of commercial aviation from [117]: inconsistencies in terminology and
method-ology result in large variability in impacts for similar-sized airports. . . 44 2-4 Regression results for the passenger model from [117]. The endogenous variable is the
country-pair origin-destination traffic. Pertinent statistics: multiple R = 0.67, R-Sq = 0.45, Adjusted R-Sq = 0.44, Standard Error = 0.1, Observations = 810. . . 46
3-1 Airline Bankruptcy: The discontinuity in the data reflects the bankruptcy of the national carrier Sabena in 2001. . . 51 3-2 Airline Strategy: Ireland’s air passenger growth since the 1990s reflects the success of Ryanair’s
expansion strategy to become an intra-European carrier after EU liberalization reforms. . . . 52 3-3 Airline passenger data effectively represent the traffic carried by Air Jamaica. Airport data
account for the traffic transported both by Air Jamaica and foreign carriers. . . 53 3-4 Airline passenger data effectively represent the traffic carried by Air Maldives. Airport data
3-5 Accounting Issues: The data are typically not collected during geopolitical conflicts such as the airline data during the military conflict in Afghanistan after 2001. The economic data for Afghanistan are not available. . . 54 3-6 Accounting Issues: The increase in the data for years 1991 and 1992 is due to the addition of
new countries to the aggregate following the dissolution of USSR and Aeroflot airlines. . . 55
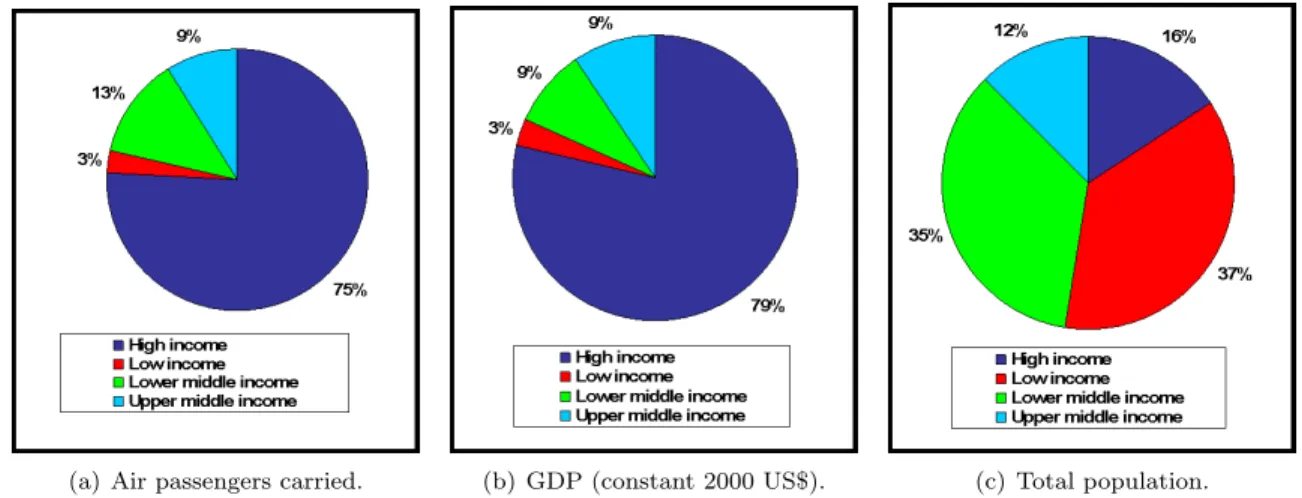
4-1 The number of air passengers has been growing in most regions over the last several decades. 58 4-2 Changing patterns in regional traffic shares. . . 59 4-3 Passenger, income and population shares when countries are aggregated into different income
categories using the 2005 data. . . 60 4-4 Air transportation mobility increases with income: Passenger traffic and GDP PPP
(Purchas-ing Power Parity) per capita for countries with population greater than 1 million. Notes: (1) the size of each individual point denotes the country’s population; (2) y-axis is log-scale; (3) Ireland ($34, 600, 10.3) is excluded from the chart; (4) only select countries with population greater than one million are shown for clarity. . . 61 4-5 The map of 139 countries studied in this work. . . 62 4-6 Each point represents a correlation coefficient between air transport passengers and GDP for
an individual country based on the temporal data during the 1975–2005 time period. . . 63 4-7 Histogram of correlation coefficients for the entire dataset. . . 64 4-8 Air transportation and GDP have four major interaction behaviors. Stimulating factors result
in increased positive passenger growth rates behaviors in quadrants Q1 and Q4. Suppressing factors result in negative passenger growth rates behaviors in quadrants Q2 and Q3. . . 64 4-9 Each point represents a yearly growth rate for air transport passengers and GDP for each
country in the dataset between two consecutive years from 1975 to 2005. The mutual growth and decline behaviors in quadrants Q1 and Q3 account for 70% of all points. . . 65 4-10 Volatility of yearly growth rates. Each point represents a yearly growth rate. Each line
con-nects the data for two consecutive years. Bold lines are used to illustrate long-term behaviors that last at least three years. The years are marked on the chart for two long-term behaviors in quadrants Q2 and Q4. . . 66 4-11 Temporal data for air passengers and GDP do not exhibit large volatility. . . 66 4-12 Growth rates using three-year moving average basis exhibit less volatility and capture
longer-term behaviors. . . 67 4-13 Comparing growth rates to the world’s: each point in the figure represents the difference
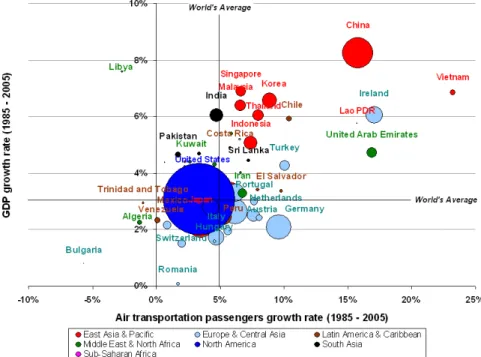
between the country’s and the world’s three-year moving average growth rates for a particular year. . . 67 4-14 Compound annual growth rate of air transportation passengers and real GDP in constant 2000
US$ between years 1985 and 2005. In this time period, the world passenger traffic grew from 800 million to 2 billion passengers. Notes: (1) the size of each individual point denotes the country’s share of passengers compared to the world’s total in 2005; (2) only select countries are shown for clarity: the complete set is available in the appendices; (3) world’s air passenger and GDP growth rates were 4.9% and 3.0%, respectively. . . 68
4-15 Compound annual growth rate of air transportation passengers and real GDP in constant 2000 US$ between years 2000 and 2005. Notes: (1) the size of each individual point denotes the country’s share of passengers compared to the world’s total in 2005; (2) only select countries are shown for clarity: the complete set is available in the appendices; (3) Slovakia is at (66%,
4.6%); (4) world’s air passenger and GDP growth rates were 3.9% and 2.8%, respectively. . . 69
4-16 The geographical distribution of twenty-two case study countries. . . 73
4-17 The interaction behaviors captured by each country-level case study. . . 73
4-18 The key Enabled Flows identified during the case study analysis. . . 75
4-19 These change factors stimulated air transportation development in the twenty-two countries studied during the case study analysis. . . 77
4-20 These change factors suppressed air transportation development in the twenty-two countries studied during the case study analysis. . . 77
5-1 Comparison of restrictions in traditional bilateral, “Open Skies” and Open Aviation Area (OAA) agreements. Source: The United Kingdom Civil Aviation Authority [154]. . . 81
5-2 Simplified system dynamics model of airport evolution. . . 90
5-3 Air transportation supply change factors: the government affects the factors highlighted in gray.108 5-4 Air transportation demand change factors: the government affects the factors highlighted in gray. . . 108
6-1 Feedback Model Representation: Air Transportation flows change the Economy’s Economic Attributes which affect the air travel and freight need between an Economy and the Rest of the World. . . 111
6-2 Air Transportation Flows provide connectivity for an Economy to the Rest of the World. Air Transportation Flows result in Enabled Flows which directly change the Economic Attributes and the resulting Travel and Freight Need between the Economy and the Rest of the World. . 112
6-3 The relationship between Air Transportation Flows and Enabled Flows. . . 113
6-4 The following Enabled Flows played a major role in these economies. . . 114
6-5 The Economy’s air travel and freight need are determined by the four attributes with govern-ment and chance playing an important role. (Adapted from Porter [164].) . . . 116
6-6 The relationship between Air Transportation Flows and Economic Attributes. . . 125
7-1 Jamaica is a lower middle income island economy in the Caribbean of fewer than three million people. In 2005, almost 1.5 million international overnight visitors traveled to the island, the majority of them for leisure purposes [213]. The map has been obtained from [41]. . . 128
7-2 Model Outline. . . 130
7-3 Feedbacks affecting Jamaica Tourism Attractiveness. . . 131
7-4 Implementation of the model’s constructs. . . 133
7-5 Reference mode: the number of air tourists to Jamaica exhibit S-shaped growth typical of many constrained systems. . . 134
7-6 Beach Quality improvements started in 2000. . . 135
7-8 Impact of various policies on the number of air tourists to Jamaica. . . 136 7-9 Tourism trends as a result of two policies: (1) AirDiscount discounts Jamaica’s air fares by 30%
between 1994 and 2000, (2) OtherModes introduces competition from other modes starting in 2010. . . 137
8-1 This feedback model describes the relationship between air transportation and economic activity.140
A-1 China: growth in air passenger traffic and GDP. Between 1985 and 2005, the average growth rates for the number of passengers carried by China’s airlines and GDP were 15.8% and 9.6%. 147 A-2 India: growth in air passenger traffic and GDP. Between 1985 and 2005, the average growth
rates for the number of passengers carried by India’s airlines and GDP were 4.7% and 6.0%. . 153 A-3 South Africa: growth in air passenger traffic and GDP. Between 1985 and 2005, the average
growth rates for the number of passengers carried by South Africa’s airlines and GDP were 5.2% and 2.3%. . . 159 A-4 Turkey: growth in air passenger traffic and GDP. Between 1985 and 2005, the average growth
rates for the number of passengers carried by Turkey’s airlines and GDP were 10.0% and 4.3%.164 A-5 Growth in air passenger traffic and GDP for the United Arab Emirates. . . 169 A-6 Map of major airports around Dubai. The figure was adapted from the Economist [59]. . . . 174 A-7 Major airports around Dubai: airport statistics, expansion and new construction development
as of 2008. The data have been gathered from the respective official airport and airline websites.175 A-8 Qatar: growth in air passenger traffic. Between 1985 and 2005, the average growth rate for the
number of passengers carried by Qatar’s airlines was 11.2%. The GDP data are not available in the World Bank database. . . 176 A-9 Vietnam: growth in air passenger traffic and GDP. Between 1985 and 2005, the average growth
rates for the number of passengers carried by Vietnam’s airlines and GDP were 13.6% and 7.5%. . . 177 A-10 Laos: growth in air passenger traffic and GDP. Between 1985 and 2005, the average growth
rates for the number of passengers carried by Laos’s airlines and GDP were 15.7% 5.8%. . . . 179 A-11 Ireland: growth in air passenger traffic and GDP. Between 1985 and 2005, the average growth
rates for the number of passengers carried by Ireland’s airlines and GDP were 17.1% and 6.1%.180 A-12 Slovakia: growth in air passenger traffic and GDP. Between 2000 and 2005, the average growth
rates for the number of passengers carried by Slovakia’s airlines and GDP were 66.6% and 4.6%.182 A-13 Chile: growth in air passenger traffic and GDP. Between 1985 and 2005, the average growth
rates for the number of passengers carried by Chile’s airlines and GDP were 10.4% and 5.9%. 184 A-14 USA: growth in air passenger traffic and GDP. Between 1985 and 2005, the average growth
rates for the number of passengers carried by U.S. airlines and GDP were 3.4% and 3.1%. . . 188 A-15 Declining real yields of U.S. airlines (in 1978 cents per passenger-mile). Data source: Air
Transport Association (ATA) website http://airlines.org. . . 189 A-16 Geographical distribution of airports in the United States from [24]. . . 190
A-17 Growth in air passenger traffic and GDP for Jamaica. The air transportation data for the country as a whole exhibit large volatility since they represent effectively only Air Jamaica. The Montego Bay airport data reflect the actual number of visitors into Jamaica’s largest
airport. . . 195
A-18 Kuwait: growth in air passenger traffic and GDP. Between 1985 and 2005, the average growth rates for the number of passengers carried by Kuwait’s airlines and GDP were 2.6% and 4.4%. 201 A-19 Libya: growth in air passenger traffic and GDP. Between 1985 and 2005, the average growth rates for the number of passengers carried by Libya’s airlines and GDP were -2.7% and 7.6%. 203 A-20 Algeria: growth in air passenger traffic and GDP. Between 1985 and 2005, the average growth rates for the number of passengers carried by Algeria’s airlines and GDP were -1.3% and 2.3%.207 A-21 Zimbabwe: growth in air passenger traffic and GDP. Between 1985 and 2005, the average growth rates for the number of passengers carried by Zimbabwe’s airlines and GDP were -16.8% and -5.4%. . . 209
A-22 Belgium: growth in air passenger traffic and GDP. Between 1985 and 2005, the average growth rates for the number of passengers carried by Belgium’s airlines and GDP were 2.1% and 2.2%. The correlation coefficient between air passengers and GDP during 1975-2005 time period is 0.62. . . 211
A-23 Switzerland: growth in air passenger traffic and GDP. Between 1985 and 2005, the average growth rates for the number of passengers carried by Switzerland’s airlines and GDP were 2.0%and 1.5%.The correlation coefficient between air passengers and GDP during 1975-2005 time period is 0.81. . . 211
A-24 Bulgaria Growth Trends. . . 213
A-25 Maldives: growth in air passenger traffic and GDP. Between 2000 and 2005, the average growth rates for the number of passengers carried by Maldives’ airlines and GDP were -23.6% and 5.0%. . . 215
A-26 Airline passenger data effectively represent the traffic carried by Air Maldives. Airport data account for the traffic transported both by Air Maldives and foreign carriers. . . 215
A-27 Indonesia: growth in air passenger traffic and GDP. Between 1985 and 2005, the average growth rates for the number of passengers carried by Indonesia’s airlines and GDP were 7.4% and 5.1%. . . 217
A-28 Indonesia: international tourist arrivals by air. Source: data compiled by Euromonitor Inter-national from World Tourism Organization [213]. . . 218
A-29 Each bar represents the number of on-board and ground fatalities due to the aviation accidents of the airlines registered in Indonesia [13]. . . 218
C-1 Australia . . . 231
C-2 China . . . 232
C-3 Fiji . . . 232
C-4 Hong Kong, China . . . 232
C-5 Indonesia . . . 233
C-6 Japan . . . 233
C-8 Malaysia . . . 234
C-9 Marshall Islands . . . 234
C-10 New Zealand . . . 234
C-11 Papua New Guinea . . . 235
C-12 Philippines . . . 235 C-13 Singapore . . . 235 C-14 Solomon Islands . . . 236 C-15 South Korea . . . 236 C-16 Thailand . . . 236 C-17 Vanuatu . . . 237 C-18 Vietnam . . . 237 D-1 Austria . . . 241 D-2 Belgium . . . 242 D-3 Bulgaria . . . 242 D-4 Cyprus . . . 242 D-5 Czech Republic . . . 243 D-6 Denmark . . . 243 D-7 Estonia . . . 243 D-8 Finland . . . 244 D-9 France . . . 244 D-10 Germany . . . 244 D-11 Greece . . . 245 D-12 Hungary . . . 245 D-13 Iceland . . . 245 D-14 Ireland . . . 246 D-15 Italy . . . 246 D-16 Kazakhstan . . . 246 D-17 Luxembourg . . . 247 D-18 Netherlands . . . 247 D-19 Norway . . . 247 D-20 Poland . . . 248 D-21 Portugal . . . 248 D-22 Romania . . . 248 D-23 Russian Federation . . . 249 D-24 Slovakia . . . 249 D-25 Spain . . . 249 D-26 Sweden . . . 250 D-27 Switzerland . . . 250 D-28 Turkey . . . 250 D-29 Ukraine . . . 251 D-30 United Kingdom . . . 251
E-1 Antigua and Barbuda . . . 255
E-2 Argentina . . . 256
E-3 The Bahamas . . . 256
E-4 Bolivia . . . 256
E-5 Brazil . . . 257
E-6 Chile . . . 257
E-7 Colombia . . . 257
E-8 Costa Rica . . . 258
E-9 Cuba . . . 258
E-10 Dominican Republic . . . 258
E-11 Ecuador . . . 259 E-12 El Salvador . . . 259 E-13 Guatemala . . . 259 E-14 Guyana . . . 260 E-15 Honduras . . . 260 E-16 Mexico . . . 260 E-17 Nicaragua . . . 261 E-18 Panama . . . 261 E-19 Paraguay . . . 261 E-20 Peru . . . 262 E-21 Suriname . . . 262
E-22 Trinidad and Tobago . . . 262
E-23 Uruguay . . . 263 E-24 Venezuela . . . 263 F-1 Algeria . . . 267 F-2 Bahrain . . . 268 F-3 Egypt . . . 268 F-4 Iran . . . 268 F-5 Iraq . . . 269 F-6 Israel . . . 269 F-7 Jordan . . . 269 F-8 Kuwait . . . 270 F-9 Lebanon . . . 270 F-10 Malta . . . 270 F-11 Morocco . . . 271 F-12 Oman . . . 271 F-13 Qatar . . . 271 F-14 Saudi Arabia . . . 272
F-15 Syrian Arab Republic . . . 272
F-16 Tunisia . . . 272
F-18 Yemen . . . 273
G-1 Canada . . . 277
G-2 United States of America . . . 278
H-1 Afghanistan . . . 279 H-2 Bangladesh . . . 280 H-3 India . . . 280 H-4 Maldives . . . 280 H-5 Nepal . . . 281 H-6 Pakistan . . . 281 H-7 Sri Lanka . . . 281 I-1 Angola . . . 283 I-2 Benin . . . 284 I-3 Botswana . . . 284
I-4 Burkina Faso . . . 284
I-5 Cameroon . . . 285
I-6 Cape Verde . . . 285
I-7 Ethiopia . . . 285 I-8 Gabon . . . 286 I-9 Kenya . . . 286 I-10 Madagascar . . . 286 I-11 Malawi . . . 287 I-12 Mauritania . . . 287 I-13 Mauritius . . . 287 I-14 Mozambique . . . 288 I-15 Namibia . . . 288 I-16 Nigeria . . . 288 I-17 Senegal . . . 289 I-18 Seychelles . . . 289
I-19 Sierra Leone . . . 289
I-20 South Africa . . . 290
I-21 Sudan . . . 290
I-22 Tanzania . . . 290
I-23 Uganda . . . 291
I-24 Zambia . . . 291
I-25 Zimbabwe . . . 291
K-1 The real yields of U.S. airlines (in 1978 cents per passenger-mile) have been declining over the last several decades. Data source: Air Transport Association website http://airlines.org. . . . 297
K-3 Jamaica air passengers. Airline data effectively represent the total number of passengers carried by Air Jamaica. Airport data represent the total number of embarked and disembarked passengers in Montego Bay and Kingston airports. Data source: ICAO airport and airline
databases. . . 298
K-4 Jamaica air tourist arrivals by region [213]. . . 299
K-5 Jamaica accommodations [213]. . . 299
K-6 Jamaica tourist receipts [213]. . . 300
K-7 Jamaica tourist receipts per person [213]. . . 300
List of Tables
4.1 The list of case studies. . . 72
6.1 Characteristics of different transportation modes [93, p. 88]. . . 114
B.1 The sources and the respective availability of data related to air transportation. . . 221
C.1 East Asia & Pacific: Correlation Coefficients between Air Transport Passengers and GDP (2000 US$); the total Number of Years for which country-level data are available; Mobility and GDP per capita statistics based on 2005 data. . . 238 C.2 East Asia & Pacific: Air Transport Passenger and GDP growth rates based on data between
2000 and 2005. The Market Share represents the 2005 country’s Air Passenger market share compared to the World’s. . . 239 C.3 East Asia & Pacific: Air Transport Passenger and GDP growth rates based on data between
1985 and 2005. The Market Share represents the 2005 country’s Air Passenger market share compared to the World’s. . . 239
D.1 Europe & Central Asia: Correlation Coefficients between Air Transport Passengers and GDP (2000 US$); the total Number of Years for which country-level data are available; Mobility and GDP per capita statistics based on 2005 data. . . 252 D.2 Europe & Central Asia: Air Transport Passenger and GDP growth rates based on data
between 2000 and 2005. The Market Share represents the 2005 country’s Air Passenger market share compared to the World’s. . . 253 D.3 Europe & Central Asia: Air Transport Passenger and GDP growth rates based on data
between 1985 and 2005. The Market Share represents the 2005 country’s Air Passenger market share compared to the World’s. . . 254
E.1 Latin America & Caribbean: Correlation Coefficients between Air Transport Passengers and GDP (2000 US$); the total Number of Years for which country-level data are available; Mo-bility and GDP per capita statistics based on 2005 data. . . 264 E.2 Latin America & Caribbean: Air Transport Passenger and GDP growth rates based on data
between 2000 and 2005. The Market Share represents the 2005 country’s Air Passenger market share compared to the World’s. . . 264
E.3 Latin America & Caribbean: Air Transport Passenger and GDP growth rates based on data between 1985 and 2005. The Market Share represents the 2005 country’s Air Passenger market share compared to the World’s. . . 265
F.1 Middle East & North Africa: Correlation Coefficients between Air Transport Passengers and GDP (2000 US$); the total Number of Years for which country-level data are available; Mo-bility and GDP per capita statistics based on 2005 data. . . 274 F.2 Middle East & North Africa: Air Transport Passenger and GDP growth rates based on data
between 2000 and 2005. The Market Share represents the 2005 country’s Air Passenger market share compared to the World’s. . . 274 F.3 Middle East & North Africa: Air Transport Passenger and GDP growth rates based on data
between 1985 and 2005. The Market Share represents the 2005 country’s Air Passenger market share compared to the World’s. . . 275
G.1 North America: Correlation Coefficients between Air Transport Passengers and GDP (2000 US$); the total Number of Years for which country-level data are available; Mobility and GDP per capita statistics based on 2005 data. . . 278 G.2 North AmericA: Air Transport Passenger and GDP growth rates based on data between
2000 and 2005. The Market Share represents the 2005 country’s Air Passenger market share compared to the World’s. . . 278 G.3 North America: Air Transport Passenger and GDP growth rates based on data between
1985 and 2005. The Market Share represents the 2005 country’s Air Passenger market share compared to the World’s. . . 278
H.1 South Asia: Correlation Coefficients between Air Transport Passengers and GDP (2000 US$); the total Number of Years for which country-level data are available; Mobility and GDP per capita statistics based on 2005 data. . . 282 H.2 South Asia: Air Transport Passenger and GDP growth rates based on data between 2000 and
2005. The Market Share represents the 2005 country’s Air Passenger market share compared to the World’s. . . 282 H.3 South Asia: Air Transport Passenger and GDP growth rates based on data between 1985 and
2005. The Market Share represents the 2005 country’s Air Passenger market share compared to the World’s. . . 282
I.1 Sub-Saharan Africa: Correlation Coefficients between Air Transport Passengers and GDP (2000 US$); the total Number of Years for which country-level data are available; Mobility and GDP per capita statistics based on 2005 data. . . 292 I.2 Sub-Saharan Africa: Air Transport Passenger and GDP growth rates based on data between
2000 and 2005. The Market Share represents the 2005 country’s Air Passenger market share compared to the World’s. . . 293 I.3 Sub-Saharan Africa: Air Transport Passenger and GDP growth rates based on data between
1985 and 2005. The Market Share represents the 2005 country’s Air Passenger market share compared to the World’s. . . 294
J.1 Weekly outbound international and domestic seats supplied in 2000. Source: Several tables in Chapter 1 of William’s book on deregulation [208]. . . 295 J.2 Arrivals by Purpose of Visit by Country: % Breakdown in 2005. Notes: Includes only the
52 markets researched in depth by Euromonitor International. Source: Euromonitor Interna-tional. Date Exported (GMT): 13/03/2008. . . 296
Chapter 1
Introduction
1.1
Motivation
The relationship between air transportation and economic activity is complex. Over the last several decades, both air transportation usage and economic activity have been growing around the world. Between 1970 and 2005 the total number of air passengers carried by the world’s airlines increased 6.5 times from 310 million to 2 billion passengers. During the same time period, the world’s Gross Domestic Product (GDP) tripled from 12 to 36 trillion US$ [212]. As the air transportation usage grew, it came to play an important role in the global economy: in 2004, 40% of international tourists traveled by air while air cargo accounted for 40% of inter-regional goods exports [3]. Air transportation is the only feasible long-distance transportation mode for high-value perishable commodities and time-sensitive people and is often the only means of access for geographically isolated areas. Air transportation enables access to markets, people, capital, knowledge and skills, opportunity, and resources. As a result, the availability of air transportation services effectively increases the geographic scope and cycle time of economic activity.
Depending on the combination of unique economic and air transportation attributes, different mecha-nisms dominate the relationship between air transportation and economic activity. Because of these unique attributes, the nature of air transportation flows differs among the economies. In some countries, interna-tional visitors account for most of the travelers, while domestic traffic flows dominate in other economies. For example, the domestic traffic flows within the United States account for 90% of all U.S. passengers, whereas almost 90% of Ireland’s air passengers travel internationally [208]. The dominant purpose of visit for passengers varies between the economies as well. According to the World Tourism Organization, more than half of all international overnight trips are taken for leisure purposes via all transportation modes [214]. However, the share of visits for a specific purpose varies significantly between individual economies. For example, nine out of ten visitors to Greece travel for leisure purposes while the primary purpose of visit for more than 70% of visitors to Russia is visiting friends and relatives [79].
While the relationship between air transportation and economic activity may be complex and nonho-mogeneous, the data presented in Figures 1-1 and 1-2 support the hypothesis that the two systems may be interdependent. In particular, high correlation coefficients between air passengers and GDP imply that there is a strong linear relationship between the two variables. Air passengers and GDP exhibit high
cor-relation coefficients using both time-series and cross-sectional (i.e., analysis of the cor-relationship at one point in time) analyses. In Figure 1-1 the air passenger and GDP data exhibit a correlation coefficient of 0.99. This correlation coefficient was calculated using time-series world aggregate data during the 1970–2005 time period1. The correlation coefficient was also computed using cross-sectional data for 137 countries for year 2005. In such a case, the air passenger and GDP data exhibit a correlation coefficient of 0.93 as shown in Figure 1-2. Given the scale and ubiquity of air transportation, it is important to understand how air trans-portation impacts economic activity and which factors affect the interaction between the two systems. Such an understanding may help guide further development efforts, investment and policy decisions pertaining to air transportation usage and the resulting enabling impact on an economy.
Figure 1-1: The correlation coefficient between air transportation passengers and GDP using world aggregate time-series data during the 1970–2005 time period is 0.99.
Figure 1-2: The correlation coefficient between air transportation passengers and GDP using cross-sectional data for 137 countries for year 2005 is 0.93. The sample excludes United States and Japan, if included, R2 = 0.91, correlation coefficient = 0.95.
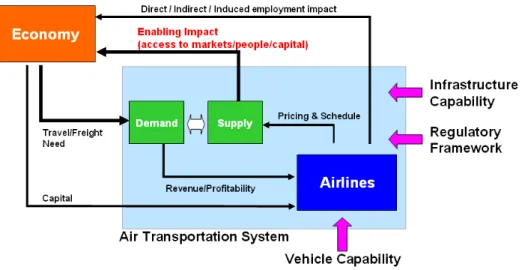
The feedback relationship between air transportation and an economy is described in Figure 1-3. The air transportation system is defined by its infrastructure capability, regulatory framework, vehicle and airline capabilities. Internal to the air transportation system is the supply and demand relationship where airlines provide supply through pricing and scheduling of flights based on the revenues and profitability of a particular
1All of the graphs in this work were produced by the author using the economic data from the World Bank database World
Development Indicators and the air passenger data from the International Civil Aviation Organization (ICAO) database; unless noted otherwise. The data sources are described in detail in Chapter 3.
route. Air transportation impacts an economy by providing employment in the aviation sector and creating wider socioeconomic benefits through its potential to enable certain types of activities in a local economy because of its distinctive characteristics: speed, cost, flexibility, reliability, and safety. The region’s economic activity in turn provides capital and generates the need for passenger travel and freight which drives the demand for air transportation services.
Figure 1-3: Feedback-based interaction between Air Transportation System and an Economy. (Adapted from Hansman [97].)
Presently, the literature lacks a comprehensive way of describing the relationship of air transportation to economic activity because the analysis ignores some interaction effects. There are two major types of studies evaluating the impact of air transportation. These studies and their limitations are reviewed in Chapter 2. First, are studies evaluating the direct, indirect and induced employment impact of air transportation. Direct impact is the employment in the aviation industry, indirect impact is the employment in the industries down the aviation supply chain, and induced impact is the employment supported by the spending of those directly and indirectly employed in the aviation industry. These studies ignore the enabling impact of air transportation and are typically done for the developed economies because they use data-intensive regional input-output matrices which are rarely available for the developing countries.
Second, are studies which attempt to evaluate the enabling, or catalytic, impact of air transportation. The enabling impact of air transportation is defined as the total economic impact on employment and income generated by the economic activities which are dependent on the availability of air transportation services. The enabling impact of air transportation is achieved through passenger and cargo flows which occur between a given economy and the rest of the world where a given economy can be defined as a country, a region, or a city depending on the analysis scope. The enabling impact of air transportation is difficult to quantify because it is difficult to isolate the impact of air transportation from other uncontrolled variables, such as globalization or institutional effects. The presence of these confounding factors makes it difficult to quantitatively evaluate the enabling impact of air transportation. In addition, the analysis of the inherent data limitations in Chapter 3 suggests that statistical tools may fail to capture or mask some of the interaction dynamics between air transportation and economic activity. To avoid some of these issues, studies typically
combine quantitative econometric modeling and qualitative techniques such as surveys of firms in the airport catchment area. The studies evaluating the enabling impact quantitatively typically measure the impact of changes in air transportation usage on tourism, trade, local investment and productivity improvement.
The majority of the enabling studies available in the literature have been done on a case by case basis: at either the level of individual airports or small developed economies. These studies, because of the inherent differences between countries, are not easily generalizable to other economies. In particular, the studies available in the literature do not currently cover the enabling impact of air transportation in developing economies. In addition, the literature lacks systematic studies which use worldwide country-level analysis to describe the relationship between air transportation and its impact on economic activity. The only studies which attempt to use worldwide cross-sectional data have been done using statistical tools and therefore have several inherent limitations. Because of the limited analysis scope and limitations of statistical analysis, it is difficult to generalize their observations about the relationship between air transportation and economic activity to other economies.
(a) Air passengers carried by airlines registered in those regions. The abnormally high values for years 1991 and 1992 for the Europe & Central Asia aggregate are due to the addition of Russia (1991) and other states (1992) to the aggregate and possible double-counting of some operations following the dissolution of USSR’s Aeroflot into 300 regional airlines in December 1991.
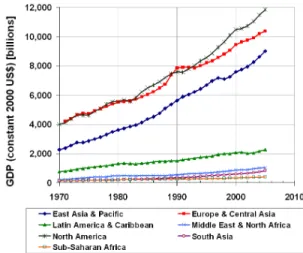
(b) GDP (constant 2000 US$): country aggregates by re-gion. The change in years 1989 and 1990 for European aggregate is due to the addition of Russia (1989) and other former USSR states (1990) to the World Bank’s European & Central Asia aggregate.
Figure 1-4: The air transportation and GDP growth patterns vary with time and across different regional aggregates.
Despite the fact that there is evidence of the general interdependency relationship between air transporta-tion and economy’s GDP, the interactransporta-tion and growth patterns between these variables vary both between economies and over time for a single economy. Figure 1-4 shows air passenger and GDP growth patterns for countries aggregated by geographic region. While both the volume of air passengers and GDP have been growing on average in every region, the individual growth rates and changes in the growth rates vary. For example, between 1970 and 2005, East Asia & Pacific, Middle East and South Asia came to play a more prominent role in the world’s passenger traffic because their shares doubled during that time period. Meanwhile, the Latin American and Sub-Saharan African traffic grew at less than average growth rates.
In Figure 1-4(a) one can also observe that air passenger growth rates have changed over time as well. For example, the growth rate of East Asia & Pacific passenger traffic increased in the late 1980s, experienced a decline in 2003 but has been increasing since then. To fully understand the interaction between air trans-portation and economic activity, in addition to describing the enabling impact of air transtrans-portation, one needs to identify factors which may stimulate or suppress air transportation development. Since the growth patterns between regions and individual economies vary, it is instructive to look at different countries to cover the breadth of possible dynamics.
To summarize, the data and analyses done in the literature support the hypothesis that there is a feedback relationship between air transportation and economic activity. However, the available studies of the enabling impact of air transportation have the following limitations: (1) the analysis is usually performed on a case by case basis and therefore does not provide a comprehensive description of interaction dynamics between air transportation and economic activity, (2) the studies describe the enabling impact of air transportation only in developed economies, (3) the cross-sectional statistical approach may not be appropriate due to the data limitations identified in this work, and (4) the analyses do not describe in sufficient detail the air transportation system and factors which influence its development. This research attempts to alleviate some of these drawbacks by providing broad-scope analysis of the interaction between air transportation and economic activity and analysis of factors which influence their development.
1.2
Research Objectives
The goal of this research is to contribute to the understanding of the relationship between air transportation and economic activity. This work seeks to (1) describe the mechanisms through which air transportation enables economic activity, and (2) identify factors which stimulate or suppress air transportation system development. Such an understanding may help guide further development efforts, investment and policy decisions pertaining to air transportation usage particularly in developing countries.
1.3
Problem Definition
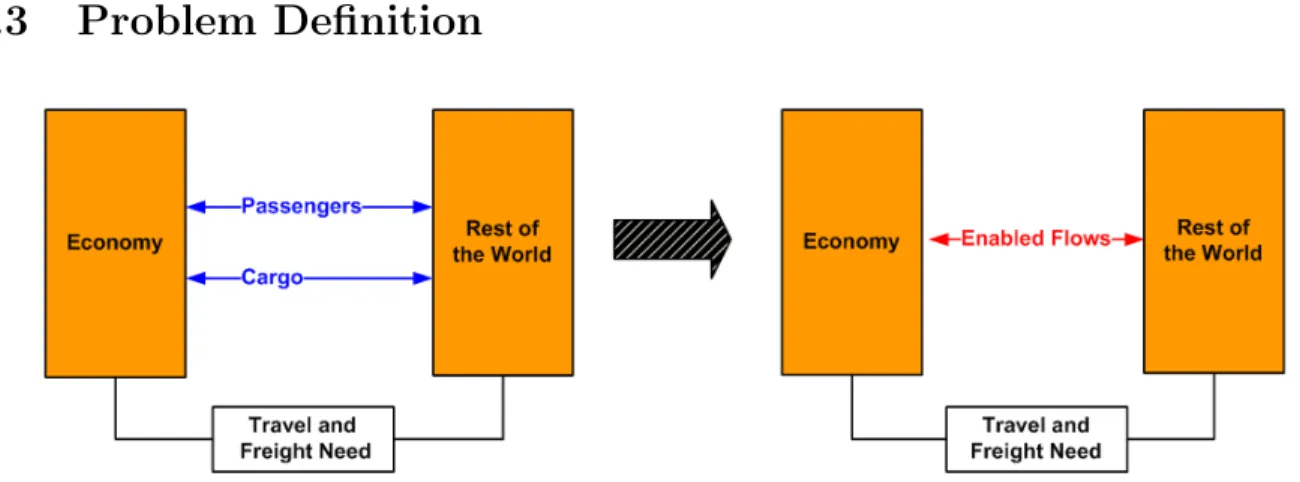
Figure 1-5: Observable Air Transportation Flows of Passengers and Cargo give rise to Enabled Flows which directly affect the Economy.
Economy can represent a country, a region, or a city depending on the analysis scope. In this work, an Economy represents an individual country. The enabling impact of air transportation is defined as the total economic impact on employment and income generated by the economic activities which are dependent on the availability of air transportation services. The enabling impact of air transportation is achieved through air transportation flows of passengers and cargo which occur between an Economy of interest and other economies. The total enabling impact on a particular Economy is defined as that produced by Passenger and Cargo flows between that Economy and the Rest of the World as shown in Figure 1-5.
The Air Transportation Flows result in Enabled Flows which are defined as flows that directly impact an Economy. Specifically, the Enabled Flows impact a set of Attributes which are used to characterize a given Economy. The Economic Attributes consist of (1) factor conditions: land, labor, natural resources, capital, infrastructure and institutions, (2) the business conditions in the nation governing how companies are created, organized and managed, (3) the economy’s demand conditions, and (4) presence of related and supporting industries2. The enabling impact of air transportation varies between different Economies. As a result, different Enabled Flows dominate in different Economies. For example, some economies rely on air transportation to gain access to the enabled tourism flows, while in others enabled goods flows may play the dominant role. During the course of the analysis in this work different types of Enabled Flows have been identified and categorized.
As the Enabled Flows change the Economic Attributes, the Travel and Freight Need, or air transportation demand, between the Economy and the Rest of the World changes as well. The changes in potential demand affect the Air Transportation System Supply which is set by the airlines whose decision to operate a particular route and pricing and scheduling of flights are influenced by their assessment of passenger and freight demand for the origin-destination market, their assessment of the route’s profitability as part of the overall network, the capability of airport and navigation infrastructure, and the available airline resources. The internal supply and demand relationship between airlines and the potential passenger and freight need between the economies results in the physical Air Transportation Flows of passengers and cargo which take place between an Economy of interest and the Rest of the World.
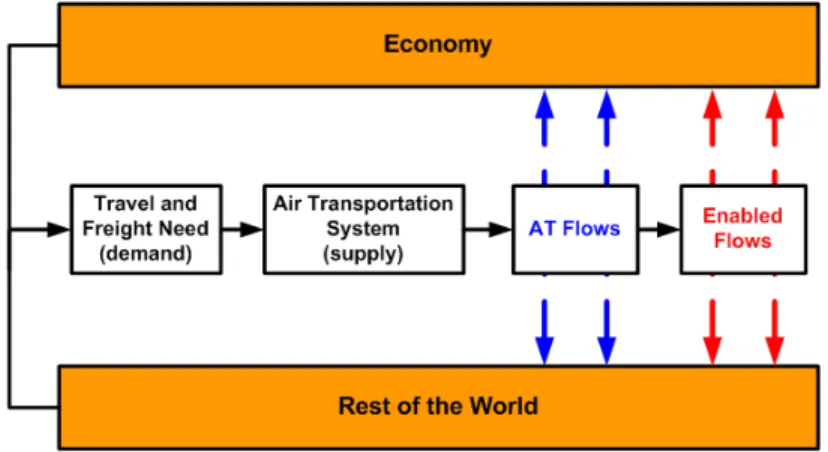
Figure 1-6: This feedback model describes the relationship between air transportation and economic activity.
2This description of an Economy is based on the concepts from the economic development literature and Porter’s theory of
The feedback model in Figure 1-6 has been developed to frame further discussion of the relationship between air transportation and economic activity. In particular, for each economy studied in this work the following has been performed:
• Identified and described the types of Enabled Flows which take place between a given Economy and the Rest of the World.
• Identified how these Enabled Flows affect the Economic Attributes and the resulting air transportation demand.
• Identified which factors stimulated or suppressed local Air Transportation System development and its enabling impact. These change factors can affect the development directly by changing parameters internal to the Air Transportation System or indirectly by changing the Economic Attributes which are used to characterize a given Economy.
The model, the enabled flows, the enabling mechanisms, and the change factors are described in detail in Chapters 5 and 6.
1.4
Research Approach
This research uses an iterative process to understand and systematically describe the interaction between air transportation and economic activity. The iterative process combines both inductive and deductive research methods to develop a descriptive model of the interaction between air transportation and economic activity [38]. The inductive part of the research method consists of three stages: observation, category identification, and development of a general descriptive model. In social sciences, the inductive research method is called grounded theory or exploratory research [38]. The deductive part of the research method seeks to test the hypotheses which have been formed inductively by improving the descriptive model following identification of anomalies which the current model does not yet support.
Ideally, one would like to do exploratory research in laboratory-like settings. For example, it is best to isolate the impact of aviation by comparing economies with identical socioeconomic and geographic condi-tions and differing aviation policies. However, no two economies are alike and therefore confounding factor differences will always exist. It is also sometimes believed that the only way to prove a general model devel-oped using case-study analysis is by undergoing a comprehensive analysis which includes all of the possible cases [47]. However, this approach is often not practical due to the limiting time constraints.
Because of these considerations, in order to develop a comprehensive understanding of the interaction between air transportation and economic activity, this research used a combination of literature review, aggregate data analysis and case study analysis. The following steps were taken in the approach:
• Reviewed literature relevant to economic impact modeling of air transportation and evolution of air transportation systems worldwide.
• Reviewed data sources for variables pertaining to air transportation and economic development to assess their quality and limitations.
• Performed cross-sectional analysis of air transportation passengers and GDP for 139 countries to iden-tify the major interaction behaviors between air transportation and economic development.
• Used the results of cross-sectional analysis to identify a set of complementary case studies which span a range of possible interaction behaviors, geographies and income categories.
• Used case study analysis to identify which factors suppressed or stimulated air transportation system development.
• Used case study analysis to develop a conceptual feedback model which describes the enabling impact of air transportation.
• Developed a quantitative model to describe the temporal evolution of an enabling impact of air trans-portation in one economy.
1.4.1
Literature Review
As part of topic exploration, an analysis of the available literature relevant to economic impact modeling of air transportation was performed. The literature review is presented in Chapter 2. Two types of impact studies were reviewed: the studies evaluating the employment impact of air transportation and studies evaluating the enabling impact of air transportation. Several studies which describe air transportation system evolution and factors which affect air transportation supply were reviewed as well. These studies were used to help understand the relationship between air transportation and economic activity and some of the findings were incorporated into the description of the enabling mechanisms and the model in Chapter 6.
1.4.2
Country-Level Data Analysis
In addition to the literature review, a comprehensive worldwide analysis of air transportation and economic development data was performed. The two major statistics used in this work are air passenger traffic and GDP data. The complete data set consists of 139 countries over a thirty-year time period of 1975 to 2005 (with some omissions). These data were used both at the individual country level and at the aggregate regional level. The data sources and limitations are described in Chapter 3.
The available data were used to explore and better understand the relationship between air transportation and economic activity. Two types of data analyses were performed to identify the major types of behaviors between air passengers and GDP. First, the correlation coefficients between air passengers and GDP were computed for each country to understand the general relationship between the two variables and identify outliers. Second, the temporal data trends were used to identify long-term growth behaviors between the two variables.
During the analysis of growth behaviors, categories were developed for different types of interaction which may occur between air transportation and economic development. In addition, the analysis helped identify countries where air transportation development has been stimulated or suppressed. In this work, air transportation development is considered to be stimulated if the country’s air passenger growth rate is at least twice the world’s average growth rate over that time period. Air transportation development is considered to be suppressed if the country’s air passenger growth rate is negative for a period of at least three consecutive years. Analysis of temporal data also helped identify countries that had discontinuities in the air passenger data.
1.4.3
Case Study Analysis
The relationship between air transportation and economic activity was explored further through case study analysis. In particular, case study analysis was used (1) to identify the stimulating and suppressing factors which affect air transportation development and its impact on economic activity, (2) to elaborate on a conceptual feedback model which describes the enabling impact of air transportation, and (3) to identify limitations in the air transportation data.
A total of twenty-two countries were reviewed. For each case study, the feedback model in Figure 1-6 was used to frame the discussion. These case studies were then used (1) to provide a comprehensive description of factors which stimulate and suppress air transportation system development in Chapter 5 and (2) to provide a description of the enabling mechanisms in Chapter 6.
1.4.4
Quantitative Model Analysis
The exploratory research in this work was primarily based on case-study analysis and was used to under-stand the relationship between air transportation and economic activity. In particular, the relationship between the two systems was explored by investigating the individual economy’s economic attributes, the impact of air transportation through the enabled flows, and factors which affect air transportation system development. This analysis was performed on a quasi-static basis. However, the relationship between the systems is dynamic and changes over time as the systems’ characteristics evolve. Therefore, this work also used quantitative modeling tools in order to explore the dynamic nature of the relationship between air transportation and economic development.
Air transportation is particularly important for geographically isolated economies because it is often the only means of linking the economy to the rest of the world. For geographically isolated regions, such as island economies, it is reasonable to assume that none of the visitors would have come in the absence of air transportation services. In such a case, one can more easily isolate the impact of air transportation from other transportation modes. For example, the tourism statistics for these economies account directly for the visitors coming there by aircraft.
Some of the island economies, such as Fiji, Antigua and Barbuda, Jamaica, Malta, Seychelles, and Mauritius, are dependent on the availability of air services for economic growth. In these economies, tourism receipts from international leisure passengers account for more than 10% of the country’s GDP [213]. In this work, a quantitative system dynamics model which describes the interaction between the demand for leisure travel to Jamaica and the resulting enabling impact of tourism on Jamaica’s economy is presented in Chapter 7.
The purpose of this quantitative dynamic model is two-fold: to model quantitatively the evolution of the enabling impact of air transportation in an economy and to illustrate the feasibility of the modeling approach. The scope of the quantitative model developed in this work has been primarily limited by data availability. However, the method can be extended to include additional mechanisms and other economies given time and resources.
1.5
Thesis Outline
The dissertation is organized as follows. The literature review and analysis of data limitations are presented in Chapters 2 and 3. These are followed by the worldwide analysis of both aggregate and country-level data in Chapter 4. Chapter 4 also presents a summary of the case studies which are described in detail in Appendix A. The information gathered during the case study analysis is then synthesized in Chapter 5 to describe the change factors which stimulate or suppress air transportation system development and in Chapter 6 to describe the enabling impact of air transportation. Chapter 7 describes the dynamic feedback model of the enabling impact of leisure passengers in Jamaica. The conclusions are presented in Chapter 8.
Chapter 2
Literature Review
Even though it is generally believed that transport infrastructure plays an important role in defining a region’s competitiveness, there is no consensus in the literature as to how to model the relationship between transport investment and economic development [216, p. 24]. According to the literature review done for the UK Department for Transport [216], the research on transportation impact modeling focuses on several categories: (1) the macroeconomic approach using production and cost functions, (2) the macroeconomic approach using computable general equilibrium and land use models, (3) the regional level approach using the cost benefit and employment effects analysis, (4) the microeconomic approach using property and land values, (5) and the microeconomic approach using regression and other statistical methods. One of the difficulties that arises while modeling the transportation impact is explaining the causality of the relationship between the rate of transport infrastructure investment and economic growth. Since the statistical methods cannot explain the nature of causality, most of the modeling methodologies include both quantitative and qualitative methods in an attempt to better interpret the statistical results.
Most of the studies, according to the analysis published by the World Bank, conclude that transport infrastructure contributes to economic development [166]. Over the years, air travel has come to play a more prominent role in economic development as air transportation usage increased worldwide. In fact, historical analysis of transportation trends by Schafer and Victor shows that the role of air travel as a transportation mode will keep increasing in the future since people tend to shift to faster and more expensive transportation modes, such as air transportation, as their income increases [170]. As a result of the increase in air transportation usage, the number of studies describing the relationship between air transportation and economic activity has been increasing in recent years as well.
Presently, the literature is lacking a comprehensive way of describing the relationship between air trans-portation and economic activity because the analysis is usually performed on a case by case basis and ignores some interaction effects. There are two major types of studies evaluating the impact of air transportation. First, are studies evaluating the impact of employment and income generated by the airports, airlines and airspace manufacturers using Input-Output analysis. Second, are studies which attempt to evaluate the enabling, or catalytic, impact of air transportation using a combination of quantitative and qualitative tech-niques enumerated above. Below, a selection of these studies is presented along with the description of the advantages and limitations of the corresponding research methods.
2.1
Studies Evaluating Impact of Aviation Using Input-Output
Analysis
The majority of the air transportation impact studies use multipliers derived from Input-Output analysis. The foundation of Input-Output analysis is a set of accounts that describe transactions and dependency relationships between aviation and other economic sectors [163]. In particaulr, these accounts can be used to evaluate how changes in the demand for aviation services affect other sectors through inter-industry linkages. Three sorts of impacts are typically measured:
• Direct – employment or economic output affected by the business activities or a proposed development of the industry. For aviation, direct impacts are employment and output in the aviation sector. • Indirect – employment or economic output caused by inter-industry purchases of goods and services as
they respond to changes in industry activity. For aviation, indirect impacts include employment and activity generated in the industry’s supply chain.
• Induced – employment or economic output created through household spending of those employed directly and indirectly through the industry’s business activities.
For example, if demand for aviation services increases, one can assume that the output of aviation services increases as well as airlines react to meet the increased demand: this is the direct impact. As the airlines increase the number of flights, this results in an increase of the demand on their suppliers and so on down the supply chain: this is the indirect impact. As a result of the direct and indirect impacts, the household income throughout the economy will increase through increased employment. A proportion of this increased income will be re-spent on final goods and services: this is the induced impact. Using Input-Output analysis, one can quantify these multiplier effects to evaluate the economic impact of aviation sector changes on the rest of the economy. The analysis may also include multiplier effects obtained from construction employment following changes in regional airport infrastructure investment.
Input-Output impact modeling is best applied to specific regions or airports since it relies on regional accounting matrices. Therefore, most of the multilplier studies, such as a Minnesota Airport Economic Impact calculator [90] and Washington’s Boeing Field Airport Impact Study [22], are typically commissioned by regional departments of transportation. In addition to academic studies, several consulting firms offer tools for evaluating the economic impact of airport infrastructure by combining Input-Output and land use techniques. Examples of such tools include the Airport Benefit Cost System: ABC from The Economic Development Research Group and models developed by Jacobs Consultancy. Representative country-wide and regional aggregate studies include the United Kingdom study based on the 1998 data [54], the European study from 2003 [1] and ICAO (International Civil Aviation Organization) worldwide civil aviation impact study using the data from 1998 [113, 115]. The majority of these studies have been done only for the developed economies since their analysis relies on data-intensive regional Input-Output matrices which are rarely available for the developing countries.
Even though most of the studies evaluate only the direct, indirect and induced employment impacts of air transportation, it has been long acknowledged, at least as far back as 1948 [19], that in addition to indirect and induced impacts, air transportation services create wider socioeconomic benefits thorough their potential to enable certain types of activities, such as tourism and trade, in a local economy. The
enabling impact of air transportation is defined as the total economic impact on employment and income generated by the economic activities which are dependent on the availability of air transportation services. The multiplier studies based on Input-Output analysis do not typically capture the enabling impacts and hence underestimate the total impact of air transportation services.
2.2
Studies Evaluating the Enabling Impact of Aviation
The enabling impact of air transportation is more difficult to quantify because it is difficult to isolate the impact of air transportation from other uncontrolled variables, such as globalization or institutional effects. Therefore, even though the wider socioeconomic benefits of air transportation are usually acknowledged in many air transportation studies, only a limited number of studies attempted to evaluate this impact. These enabling impact studies typically combine quantitative econometric modeling and qualitative techniques such as surveys of firms in the airport catchment area. Two of the most comprehensive studies of the enabling impact are described below. They are the Eurocontrol [46] study from 2005 of the enabling impact of air transportation in the European Union, and the worldwide enabling impact study published in 2005 by the Air Transport Action Group (ATAG) [3]. Both of these studies were undertaken by Oxford Economic Forecasting on behalf of the two organizations. At the foundation of these studies lies econometric analysis which links air transport usage to activities that are believed to be enabled by air transportation: tourism, trade, local investment and productivity improvement. An overview of other econometric studies available in the literature follows.
2.2.1
Eurocontrol Study
The goal of this study was to develop a robust methodology for measuring the economic catalytic impacts of air transportation in twenty-five European Union (EU-25) countries. The study used the following definition of the catalytic, or enabling, impact of air transportation: The net economic effects (e.g., on employment, incomes, government finances, etc.) resulting from the contribution of air transport to tourism and trade (demand-side effects) and the long-run contribution to productivity and GDP of growth in air transport usage (the supply-side performance of the economy).
The study divided the enabling impact of air transportation into two categories: the demand-side and supply-side catalytic impacts. The demand-side catalytic impacts were defined as those which operate through the use of air services to transport tourists and goods. The supply-side catalytic impacts were defined as those which change the economy’s supply side and hence have long-run implications on productivity and GDP. The supply-side impacts considered in the study are summarized in Figure 2-1. These impacts consists of impacts on investment, labor supply, productivity, market structure, and congestion. However, only the enabling impact of tourism, trade, investment and total factor productivity were evaluated quantitatively. The table in Figure 2-2 summarizes the study’s findings.
Impact on Tourism and Trade
The impact of tourism was computed by calculating the net spending of all inbound foreign visitors by air minus that of outbound visitors by air. Using this basis, the net tourism spending of air visitors was found
![Figure 2-1: Economic catalytic impacts of air transport: Figure 3-2 from the Eurocontrol study [46].](https://thumb-eu.123doks.com/thumbv2/123doknet/14176531.475449/40.918.155.755.166.512/figure-economic-catalytic-impacts-transport-figure-eurocontrol-study.webp)