Publisher’s version / Version de l'éditeur:
Indian Journal of Fibre & Textile Research, 36, 4, pp. 336-343, 2011-12
READ THESE TERMS AND CONDITIONS CAREFULLY BEFORE USING THIS WEBSITE. https://nrc-publications.canada.ca/eng/copyright
Vous avez des questions? Nous pouvons vous aider. Pour communiquer directement avec un auteur, consultez la
première page de la revue dans laquelle son article a été publié afin de trouver ses coordonnées. Si vous n’arrivez pas à les repérer, communiquez avec nous à PublicationsArchive-ArchivesPublications@nrc-cnrc.gc.ca.
Questions? Contact the NRC Publications Archive team at
PublicationsArchive-ArchivesPublications@nrc-cnrc.gc.ca. If you wish to email the authors directly, please see the first page of the publication for their contact information.
NRC Publications Archive
Archives des publications du CNRC
This publication could be one of several versions: author’s original, accepted manuscript or the publisher’s version. / La version de cette publication peut être l’une des suivantes : la version prépublication de l’auteur, la version acceptée du manuscrit ou la version de l’éditeur.
Access and use of this website and the material on it are subject to the Terms and Conditions set forth at
From anthropometric measurements to three-dimensional shape
Paquet, Eric; Peña, Isis; Viktor, Herna L.
https://publications-cnrc.canada.ca/fra/droits
L’accès à ce site Web et l’utilisation de son contenu sont assujettis aux conditions présentées dans le site LISEZ CES CONDITIONS ATTENTIVEMENT AVANT D’UTILISER CE SITE WEB.
NRC Publications Record / Notice d'Archives des publications de CNRC:
https://nrc-publications.canada.ca/eng/view/object/?id=cdbf9c37-3e09-423e-878d-12bdf0f6195a https://publications-cnrc.canada.ca/fra/voir/objet/?id=cdbf9c37-3e09-423e-878d-12bdf0f6195a
From anthropometric measurements to three-dimensional shape
Eric Paqueta,b, Isis Peñab & Herna L Viktorb
a
National Research Council Canada,1200 Montreal Road, Ottawa, Ontario, Canada
bSchool of Information Technology and Engineering, Faculty of Engineering,
University of Ottawa, 800 King Edward Ave., Ottawa, Ontario, Canada
Functional clothing encompasses a wide range of apparels such as protective equipments, functional garments and fire-retardant clothing. Depending on the application, they must adapt to the shape of the human body, should not interfere with the body motion and should isolate the body from a potentially hazardous environment. In order to achieve these objectives, it is imperative to characterize a body or a body part with the most representative measurements and to understand their interrelationships. More recently, it has been possible to acquire the three-dimensional shape of the human body with full body scanners. Such a three-dimensional shape is of course highly desirable for functional clothing, because it contains detailed information about the whole shape; for instance, a protective mask is most likely to be efficient if the shape around the mouth is known precisely. Consequently, it is essential to be able to analyze and compare these shapes and to understand their relations with traditional anthropometric measurements which are still widely used by the apparel industry. This paper describes our results when analyzing an anthropometric database, using both anthropometric measures and 3D data. Our results indicate that these two sets of data offer complimentary perspectives of the human body and it's measurements, in terms of the resultant sets of clusters and associated archetypes. Through combining these complimentary perspectives, the goal of designing well-fitting functional apparel may be realized.
Keywords: Anthropometry, Archetype, Clustering, Three dimensional shape, Functional clothing
1 Introduction
The design of functional clothing that fits the subject well is of crucial importance in many domains, ranging from protective clothing for hazardous waste disposal, pilot helmet design to astronaut suit design. In such domains, the apparel should be comfortable, and should not hinder the task at hand. These clothing should be based on real anthropometric data, and also incorporate information regarding the shape of the human body, in order to ensure a close fit.
The CAESARTM database is an anthropometric database that contains detailed data regarding human subjects that reside in the USA, Italy and the Netherlands. The database contains numerous anthropometric measures and demographic profiles. In addition, it contains the 3D body scans of all subjects. This database thus presents us with the opportunity to profile the typical groupings of human bodies, based on the anthropometric data as well as 3D data. This paper presents the results of our analysis, when aiming to find the archetypes of typical groupings or clusters, for functional clothing design.
The present study includes (i) a short overview of cluster analysis and introduction of main clustering techniques, (ii) methodology followed to perform the cluster analysis on the Dutch CAESARTMpopulations, and (iii) presentation of the results when clustering the anthropometric data, followed by cluster analysis results when considering the 3D data. This is followed by a discussion of the results and the implications thereof from a functional apparel perspective.
2 Cluster Analysis Overview
Cluster analysis or clustering is an unsupervised learning data mining technique used to group data records into unlabeled classes. More formally, clustering is the process of partitioning a set of physical or abstract objects into subsets or clusters based on data similarity1. A cluster is a collection of objects that are similar to one another and are significantly different from the objects in other clusters. The similarity or dissimilarity between two data objects is determined based on the attribute values describing the object, and some distance measure. Euclidean, Manhattan and Minkovski distances are well-known methods for distance measurement2,3.
_____________
a
To whom all the correspondence should be addressed. E-mail: eric.paquet@nrc-cnrc.gc.ca
INDIAN J. FIBRE TEXT. RES.
2
Clustering techniques are grouped into partitioning, hierarchical, density-based and model-based methods1-3. Partitioning methods construct the clusters by dividing the dataset into k partitions or clusters, where k is the desired number of clusters provided by the user. Partitioning algorithms create an initial partitioning and, by an iterative reallocation process, attempt to improve the partitioning according to some criterion function. The criterion function to evaluate the quality of a partitioning could be ‘square-error function’. Hierarchical methods create a hierarchical decomposition of the dataset, i.e. a tree of clusters also known as dendogram. Hierarchical methods are categorized into agglomerative (bottom-up) and divisive (top-down). The agglomerative approach starts with one-object clusters and recursively merges clusters that are close to one another. On the other hand, the divisive approach starts with all the objects in the same cluster and recursively splits into smaller non-overlapping clusters. The process continues until a termination criterion (e.g. the requested number k of clusters) is achieved. Density-based methods consider the clusters as dense regions of objects in the data space that are separated by regions of low density. The general idea in these methods is to continue growing a cluster as long as the density (number of objects or data points) in the neighbourhood exceeds some threshold. Density-based methods discover clusters of arbitrary shape. Model-based methods attempt to optimize the fit between the dataset and some mathematical model. These methods are based on the assumption that the data is a mixture of independent samples from a series of heterogeneous group populations. In these methods, it is assumed that the data are generated by a model, the clustering algorithm then tries to recover the original model from the data. Since these methods attempt to find heterogeneous groups in the data, this leads to an automatic way of determining the number of clusters. Other clustering methods include grid-based, constraint-based and fuzzy clustering 1-3.
In our domain, clustering is considered as a data reduction technique, in the sense that, through clustering, one can characterize the objects in each cluster in terms of a cluster archetype. An archetype is defined as the centrally located subject in each cluster under the assumption that the cluster has a spherical or quasi spherical symmetry. If this is not the case, more than one archetype may be necessary to fully characterize the cluster. Archetypes are then
representatives of all other subjects that belong to the same cluster or cluster region2. In this research, the archetypes have been used for designing well-fitting functional apparel, as discussed next.
3 Clustering of Anthropometric Data
As introduced earlier, we aim to characterize the CAESARTM population and study its suitability for functional apparel design. In order to identify the natural body size groupings within the CAESARTM populations, first the anthropometric data are considered. In this study, only Dutch population is studied, since the sampling of this set of data is the most representative of the population. The data is first separated based on the gender of the subjects. The resulting sets consist of 567 Dutch males and 700 Dutch females. All our experiments are implemented in WEKA, a collection of machine learning algorithms for data mining tasks written in Java, developed at the University of Waikato4. Additionally, in order to verify the quality of our results, the Cleopatra system, a 3D information retrieval system developed at the NRC5, was used.
Determining Number of Clusters
In order to determine the number of clusters that best describe the populations studied, we first considered a number of different cluster analysis algorithms. We also considered EM, an algorithm that performs expectation-maximization analysis based on statistical modelling6, and Classit, a popular and simple method of incremental conceptual clustering that creates a classification tree7. Both EM and Classit are model-based algorithms that, as discussed in section 2, may be used to automatically determine the number of clusters.
The number of clusters obtained with EM and Classit is found to be significantly large for our purposes. The number of clusters generated by Classit varies from 243 to 647 in all populations. EM produces 11 - 14 clusters for the Dutch population, both males and females. As can be seen, EM produces a smaller number of clusters than Classit, but still large from a tailoring point of view. We also considered partitioning, hierarchical, density-based, model-based and grid-based approaches.
In this process, the approach proposed by Witten and Frank4 is followed to determine the optimal number of clusters. They proposed an iterative process where the dataset is first divided into two clusters. Next, by inspection of the cluster
distribution, they decided the need of further splitting the clusters. A cluster that is highly spread indicates that further splitting is needed. This process is repeated until no more cluster splitting is needed. This process allows finding the minimum number of clusters that characterize the data properly, since we start from the minimum number of clusters and increase their number (split) only when a cluster is not well defined. Therefore, by inspection of the cluster distribution and through the analysis of the results using Cleopatra, the number of clusters for the female population was set to six. These clusters correspond to the number of clothing sizes for the females. The results indicate that, for the males, the best number of clusters is five.
The results indicate that for both males and females, the best clustering is obtained using the density-based algorithm with k-means components. In order to validate the quality of the clusters produced by the density-based algorithm with k-means components, the cluster membership was verified through querying the 3D body scans using the Cleopatra system. The centroid characteristics of both male and female are presented in Table 1 . Figures 1 and 2 show the 3D body scans of the human subjects that correspond to these anthropometric measurements, highlighting the difference in the representative body types of the clusters. By inspecting Table 1, the cluster distribution, and through the analysis of the results using the Cleopatra system, we observe that the clusters discriminate between the different body sizes.
4.Clustering of 3D Data
The analysis performed so far is based on anthropometric measurements contained in the CAESARTM database. However, this database also contains detailed 3D shape information of each individual. This allows the analysis of the features of the individuals based on 3D shape information. Following the same approach as with the anthropometric data, cluster analysis on the 3D data was also performed.
In this analysis, only the Dutch dataset is considered since the best sampling was achieved for this. 3D scans are represented by a set of three histograms that contain a 3D shape index for the human body8. Since the 3D data is normalized and we require the height of the subjects to be considered in the clustering, the data is first de-normalized. Again,
the data is separated into two sets based on the gender of the subject. The resulting sets consist of 542 males and 663 females.
We determined the minimum number of clusters that best describes the population following the process, as described in section 3. For the 3D data, the results indicate that the male population is best described using five clusters. For the female population, the best results are obtained with six clusters. Thus, the number of clusters is set to be five for the males and six for the females. The same algorithm that was found to produce the best results has also been used for the anthropometric data and hence the results are consistent and may be used for the comparison. Thus, the density-based algorithm with k-means components is used for both males and females. The visualization of the resulting clusters for the male and female population is shown in Fig. 3. The number of subjects per cluster is given in Table 2.
Again, we verified the cluster membership through querying the 3D scans using the Cleopatra system. The 3D body scans of the centroids of the male and female populations are shown in Figs 4 and 5 respectively. From the figures, it may be observed that the centroids highlight the difference in body types of the different clusters. Thus, the results indicate that the 3D clusters distinguish between the different body sizes.
5.Comparison of Anthropometric and 3D Clustering Results
In previous sections, the results of clustering the anthropometric data and 3D data are presented. This section presents a comparative analysis of the clustering results obtained from the anthropometric measurements and the results obtained from the 3D data.
By inspecting the number of subjects per cluster (Tables 1 and 2), it is observed that the number of subjects is not the same when the clustering is performed using the anthropometric measurements and the 3D data. Actually, we compared, for each subject, the subject size from the anthropometric data against the subject’s size from the 3D data. It is found that 342 subjects (63.1% of the male population) and 523 subjects (78.9% of the female population) change in size. Some subjects increase or decrease one, two, three or even four sizes in the case of the female population. Here, we proceed to analyze the anthropometric measurements and 3D scans
INDIAN J. FIBRE TEXT. RES.
4
information of a set of representative individuals to find out the reason for this situation.
In this analysis, we considered the anthropometric clustering results as reference to determine if a subject increased or decreased in size. A subject increases two sizes, if for instance according to the clustering of anthropometric data, the subject’s size is Small, but according to the clustering results of the 3D data, the subject size is large. The focus is mainly on the subjects that have a significant change in size, i.e. the subjects that increase or decrease three and four sizes. Some examples of this situation are presented hereunder.
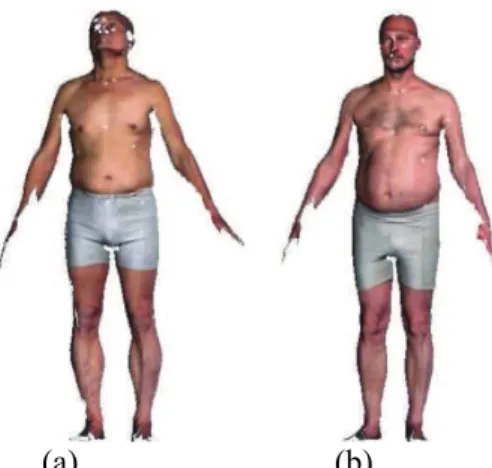
Figure 6 shows the 3D body scan of a subject whose size from the anthropometric measurements is Small. However, according to the 3D data, his size is X-Large. That is, the subject increases three sizes. Together with the subject 3D body scan we have the centroid of the X-Large size as obtained from the 3D data. The subject anthropometric measurements are given in Table 3.
It is observed that the body shape similarity between the subject and the X-Large centroid is high. This explains why according to the 3D data, the subject is considered as X-Large. However, by inspecting the body measurements and comparing them with the anthropometric centroids in Table 1, we noticed the body measurements correspond to the Small size. This makes sense from the clustering point of view. The clustering of 3D data is based on body shape similarity while the anthropometric clustering is based on the similarity of the body measurements.
The next example shows the opposite situation, where a subject decreases three sizes. According to the anthropometric clustering, the subject size is X-Large. Nevertheless, according to the results of the 3D clustering the subject is Small size. Figure 7 shows the subject 3D body scan and the Small centroid from 3D data clustering. The subject anthropometric measurements are provided in Table 4. From Fig. 7, it can be seen that the subject body shape is very similar to the body shape of the Small centroid, and therefore the subject is grouped into the Small cluster. When we inspect the subject anthropometric measurements, it is found that these correspond to the X-Large anthropometric size. Again, this is explained by the fact that the clustering of the 3D data groups together similar body shapes.
The next two examples show female subjects that increase or decrease four sizes. In the following
example, a subject decreases four sizes. That is, when considering the anthropometric measurements the subject size is XX-Large, while from the 3D data the subject size is Small. Again, we compared the subject body shape with the Small centroid (Fig. 8). The subject anthropometric body measurements are shown in Table 5.
In the next example, a case where a subject increased four sizes is presented (Fig. 9). From anthropometric measurements the subject size is X-Small, while according to the 3D data the size of the subject is X-Large. The subject’s anthropometric measurements are shown in Table 6.
It can be observed from the table that the subject anthropometric measurements satisfy the anthropometric X-Small size, but for the 3D data clustering, the shape is very similar to the X-Large centroid.
By analyzing the above examples, the following observations are worth mentioning. The clustering of 3D body scans groups together subjects with similar body shape. On the other hand, when the clustering is performed on the anthropometric data, the algorithm groups in the same cluster the subjects with similar height, weight, bust circumference and so on. The change in size is due to the fact that even though two subjects may have similar body measurements, their body shape may be different. For example, two female subjects may have the same bust circumference. However, one of the subjects has wide back and shoulder, while the other has narrow back and large bust, making their body shapes different. Then, the clustering of the 3D data and the clustering of anthropometric data provide a different perspective on the subject characterization. As a result, it can be concluded that the clustering results are complementary to one another.
When considering functional apparel, a good understanding of the 3D shape of the body is crucial to determine a close fit. That is, the 3D clusters give us a very good indication of the various shapes within the population, across the different body sizes. Therefore, these clusters are actually based on different shapes (e.g. pear and apple shapes), rather than sizings "per se". For functional apparel design, the above two different cluster analysis results should be used as follows. First, for an individual, the anthropometric cluster (s)he belongs to, should be found first. This will give the apparel designer an indication of the sizing constraints for this individual.
Next, the 3D shape-based cluster should be used to modify the initial design, and to ensure a good fit. For example, for the person shown in Fig. 8 (a), the sizing constraints would ensure that the hips are wide enough, while the small round shoulders are also taken into account, as observed from the 3D shape-based cluster membership. That is, within a specific anthropometric cluster, the various shapes, as obtained from the 3D shape-based results, may be used to create a set of variations taking the common body shapes (e.g. a large person with narrow back and/or sloped shoulder shapes) into account.
6 Conclusion
The design of well-fitting functional clothing is crucial to ensure the safety of personnel who works in dangerous and potentially hazardous environments. The study indicates that the anthropometric and 3D data yields complimentary results, which should be used together in order to find the best fit. In particular, the 3D shape-based clusters should be used to refine and complement the anthropometric archetypes, in order to model typical body shapes. Future work will include the testing of our results in a real world setting. We are also interested to extend this work to study the anthropometry of the disabled. For instance, the design of artificial limbs and clothing to facilitate wheelchair navigation comes to mind.
References
1 Tan P-N, Steinbach M & Kumar V, Introduction to Data
Mining (Addison Wesley, Chichester, England), 2005, 1.
2 Abdali O, Viktor H L, Paquet E & Rioux M, Exploring Anthropometric Data through Cluster Analysis, SAE
Transact, J Aerospace, 113 (2004) 241.
3 Han J & Kamber M, Data Mining: Concepts and Techniques (Morgan Kaufmann, Burlington, MA), 2006, 1.
4 Witten I H & Frank E, Data Mining: Practical Machine
Learning Tools and Techniques (Morgan Kaufmann,
Burlington, MA), 2005, 1.
5 Paquet E, Robinette K M & Rioux M, Management of Three-Dimensional and Anthropometric Databases: Alexandria and Cleopatra, J Electronic Imaging, 9 (2000) 421.
6 Dempster A P, Laird N M & Rubin D B, Maximum likelihood from incomplete data via the em algorithm, J
Royal Statistical Soc, Ser B, 39 (1977) 1.
7 Gennari J H, Langley P & Fisher D H, Models of incremental concept formation, Artificial Intelligence, 40 (1989) 11.
8 Brunsman M A, Daanen H M & Robinette K M, Optimal
postures and positioning for human body scanning, paper
presented at the International Conference on Recent Advances in 3-D digital Imaging and Modeling , Los Alamitos, CA, 1997.
Table 2—Number of subjects per cluster for Dutch males and females
Size Number of subjects
Male Female X-Small - 132 (20%) Small 135 (25%) 63 (10%) Medium 79 (15%) 103 (16%) Large 166 (31%) 149 (22%) X-Large 106 (20%) 147 (22%) XX-Large 56 (10%) 69 (10%)
Table 3—Anthropometric measurements of the subject in Fig. 6 (a)
Measurement Value
Chest circumference 96.6 cm
Waist circumference 88.5 cm
Hip circumference 97.5 cm
Neck base circumference 49.0 cm
Shoulder to wrist 61.3 cm
Stature 169.2 cm
Shoulder breadth 43.6 cm
Weight 73.21 kg
Table 4— Anthropometric measurements of the subject in Fig. 7 (a)
Measurement Value
Chest circumference 103.0 cm
Waist circumference 94.1 cm
Hip circumference 101.7 cm
Neck base circumference 49.5 cm
Arm shoulder to wrist 66.9 cm
Stature 195.6 cm
Shoulder breadth 47.7 cm
Weight 89.99 kg
Table 5— Anthropometric measurements of the subject in Fig. 8 ( a)
Measurement Value
Bust circumference 104.6 cm
Under bust circumference 87.8 cm
Waist circumference 98.4 cm Hip circumference 122.8 cm Shoulder to wrist 65.4 cm Stature 194.8 cm Shoulder breadth 45.1 cm Weight 103.42 kg
INDIAN J. FIBRE TEXT. RES.
6
Table 1—Body measurements of Dutch male and female centroids
Parameter X-Small Small Medium Large X-Large XX-Large
Male
Chest circumference - 93.1 (6.0) 96.5 (4.8) 107.8 (6.7) 104.9 (6.2) 121.2 (7.0) Waist circumference - 82.5 (6.9) 86.5 (5.7) 96.3 (7.4) 97.4 (5.7) 112.5 (9.1) Hip circumference - 95.3 (4.6) 98.5 (3.6) 103.1 (4.5) 108.1 (4.0) 116.3 (6.2) Neck base circumference - 45.4 (2.4) 47.4 (2.5) 50.3 (2.7) 51.0 (2.3) 55.2 (3.4) Shoulder to wrist length - 60.3 (3.3) 65.4 (2.6) 62.4 (3.0) 67.2 (3.2) 65.6 (3.6)
Stature - 173.0 (6.6) 184.8 (4.6) 176.1 (5.6) 193.2 (6.2) 188.1 (8.3) Shoulder breadth - 44.0 (1.6) 46.6 (1.8) 47.8 (2.0) 48.8 (2.0) 52.0 (3.4) Weight, kg - 67.99 (6.7) 77.79 (5.53) 90.2 (7.93) 97.25(7.67) 119.79 (13.24) Number of subjects - 126 (22 %) 173 (31 %) 139 (25 %) 82 (14 %) 47 (8 %) Female Bust circumference 90.7 (5.9) 92.1 (5.0) 98.4 (6.2) 106.1 (6.7) 117.5 (8.3) 120.6 (9.2) Waist circumference 74.1 (6.4) 76.4 (5.9) 83.5 (7.1) 90.7 (8.0) 103.3 (9.4) 107.9 (11.0) Hip circumference 97.2 (5.1) 101.2 (5.4) 106.4 (5.1) 110.1 (5.8) 117.5 (7.7) 121.6 (10.4) Shoulder to wrist 55.1 (2.4) 58.5 (1.8) 62.0 (2.2) 56.8 (1.9) 58.6 (2.2) 63 (2.0) Stature 160.0 (4.7) 169.7 (3.7) 176.9 (4.8) 162.4 (5.1) 167.1 (4.3) 176.9 (5.6) Shoulder breadth 40.3 (1.7) 41.7 (1.7) 44.0 (2.1) 43.6 (2.4) 47.0 (2.9) 47.6 (2.9) Weight, kg 57.38(5.94) 64 (5.62) 74.97(6.58) 77.61(6.03) 95.25 (9.89) 106.27 (13.11) Number of subjects 130 (19 %) 198 (28 %) 125 (18 %) 125 (18 %) 83 (12 %) 39 (6 %) Mean values are given in cm along with the standard deviation in parentheses.
(a) (b) (c) (d) (e)
Fig. 1—Cluster centroids for Dutch male population [ (a) Small, (b) Medium, (c) Large, (d) X-Large and (e) XX-Large]
(a) (b) (c) (d) (e) (f)
Fig. 2— Cluster centroids for Dutch female population [ (a) Small, (b) Small, (c) Medium, (d) Large, (e) X-Large and (f) XX-X-Large]
3D shape attributes
Fig. 3—Cluster visualization of 3D data for the Dutch population (a) clustering of the male population and (b) clustering of the female population
(a) (b) (c) (d) (e)
Fig. 4—Cluster centroids from 3D data for Dutch males [ (a) Small, (b) Medium, (c) Large, (d) X-Large and (e) XX-Large]
(a) (b) (c) (d) (e) (f)
Fig. 5—Cluster centroids from 3D data for Dutch females [ (a) X-Small, (b) Small,(c ) Medium, (d) Large, (e) X-Large and (f) XX-Large]
INDIAN J. FIBRE TEXT. RES.
8
(a) (b)
Fig. 6—Shape comparison with the X-Large centroid. The subject that increases three sizes ( a), and the X-Large centroid from 3D data ( b)
(a) (b)
Fig. 7 —Shape comparison with the Small centroid. The subject that decreases three sizes ( a), and the Small centroid from 3D data ( b)
(a) (b)
Fig. 8— Shape comparison with the Small centroid. The subject that decreases four sizes ( a), and the Small centroid from 3D data ( b)
Fig. 9— Shape comparison with the X-Large centroid. The subject that increases four sizes ( a), and the X-Large centroid from 3D data (b)
Table 6—Anthropometric measurements of the subject in Fig. 9 (a)
Measurement Value
Bust circumference 94.2 cm
Under bust circumference 72.5 cm Waist circumference 75.4 cm Hip circumference 102.7 cm Shoulder to wrist 52.7 cm Stature 152.0 cm Shoulder breadth 42.9 cm Weight 62.18 kg