Publisher’s version / Version de l'éditeur:
Journal of Power Sources, 196, 24, pp. 10625-10631, 2011-09-03
READ THESE TERMS AND CONDITIONS CAREFULLY BEFORE USING THIS WEBSITE.
https://nrc-publications.canada.ca/eng/copyright
Vous avez des questions? Nous pouvons vous aider. Pour communiquer directement avec un auteur, consultez la première page de la revue dans laquelle son article a été publié afin de trouver ses coordonnées. Si vous n’arrivez pas à les repérer, communiquez avec nous à PublicationsArchive-ArchivesPublications@nrc-cnrc.gc.ca.
Questions? Contact the NRC Publications Archive team at
PublicationsArchive-ArchivesPublications@nrc-cnrc.gc.ca. If you wish to email the authors directly, please see the first page of the publication for their contact information.
NRC Publications Archive
Archives des publications du CNRC
This publication could be one of several versions: author’s original, accepted manuscript or the publisher’s version. / La version de cette publication peut être l’une des suivantes : la version prépublication de l’auteur, la version acceptée du manuscrit ou la version de l’éditeur.
For the publisher’s version, please access the DOI link below./ Pour consulter la version de l’éditeur, utilisez le lien DOI ci-dessous.
https://doi.org/10.1016/j.jpowsour.2011.08.080
Access and use of this website and the material on it are subject to the Terms and Conditions set forth at
Effect of operating parameters and anode diffusion layer on the direct
ethanol fuel cell performance
Alzate, V.; Fatih, K.; Wang, H.
https://publications-cnrc.canada.ca/fra/droits
L’accès à ce site Web et l’utilisation de son contenu sont assujettis aux conditions présentées dans le site LISEZ CES CONDITIONS ATTENTIVEMENT AVANT D’UTILISER CE SITE WEB.
NRC Publications Record / Notice d'Archives des publications de CNRC:
https://nrc-publications.canada.ca/eng/view/object/?id=dd887654-93a4-4035-9bb7-14569acec6ac
https://publications-cnrc.canada.ca/fra/voir/objet/?id=dd887654-93a4-4035-9bb7-14569acec6ac
ContentslistsavailableatSciVerseScienceDirect
Journal
of
Power
Sources
j ou rn a l h o m e pa g e :w w w . e l s e v i e r . c o m / l o c a t e / j p o w s o u r
Effect
of
operating
parameters
and
anode
diffusion
layer
on
the
direct
ethanol
fuel
cell
performance
V.
Alzate,
K.
Fatih
∗,
H.
Wang
NationalResearchCouncilCanada-InstituteforFuelCellInnovation,4250WesbrookMall,Vancouver,BritishColumbia,V6T1W5,Canada
a
r
t
i
c
l
e
i
n
f
o
Articlehistory: Received24May2011
Receivedinrevisedform19August2011 Accepted20August2011
Available online 3 September 2011 Keywords:
Directethanolfuelcells Directalcoholfuelcells Ethanoloxidation
Fuelcelloperatingparameters Cellperformance
a
b
s
t
r
a
c
t
Aparametricstudywasconductedontheperformanceofdirectethanolfuelcells.Themembrane elec-trodeassembliesemployedwerecomposedofaNafion®117membrane,aPt/CcathodeandaPtRu/C
anode.Theeffectofcathodebackpressure,celltemperature,ethanolsolutionflowrate,ethanol concen-tration,andoxygenflowratewereevaluatedbymeasuringthecellvoltageasafunctionofcurrentdensity foreachsetofconditions.Theeffectoftheanodediffusionmediawasalsostudied.Itwasfoundthatthe cellperformancewasenhancedbyincreasingthecelltemperatureandthecathodebackpressure.Onthe contrary,thecellperformancewasvirtuallyindependentofoxygenandfuelsolutionflowrates. Perfor-mancevariationswereencounteredonlyatverylowflowrates.Theeffectoftheethanolconcentrationon theperformancewasasexpected,masstransportlosesobservedatlowconcentrationsandkineticloses athighethanolconcentrationduetofuelcrossover.Theopencircuitvoltageappearedtobeindependent ofmostoperatingparametersandwasonlysignificantlyaffectedbytheethanolconcentration.Itwas alsoestablishedthattheanodediffusionmediahadanimportanteffectonthecellperformance.
Crown Copyright © 2011 Published by Elsevier B.V. All rights reserved.
1. Introduction
Directliquidfuelcellsareanattractivetechnologybecauseof thefuel’shighvolumetricenergydensity,whichtranslatesin sys-temcompactnessandsimplicity.Intheliquidfueloptions,ethanol hastwomainadvantages;itslowtoxicityanditsestablished pro-ductioninfrastructure.Themainissueofdirectethanolfuelcells (DEFC)istheirlowefficiency,mainlyduetothedifficultytobreak theethanol’scarbon–carbonbondatthefuelcell’soperating tem-perature.Inaddition,thepresenceofethanolinthecathode,due tothecrossoverthroughtheNafion®membrane,reducestheopen
circuitvoltageandpoisonsthecatalyst.Becauseoftheimportance oftheelectrochemicalreactionkineticsinthissystemmostofthe researchworkhasbeenfocusedontheanodecatalyst.Platinum–tin basedcatalystshaveshownthebestinitialperformanceforthe ethanolelectro-oxidationreaction(EOR)[1,2],while Pt–Sn con-tainingIrshowedbetterlongtermperformance[3].Almostallof thecatalystsappliedtoEORshowedverylowCO2yieldswithacetic
acidandacetaldehydebeingthemainoxidationproducts.Effortsto increasetheplatinum–tinelectrocatalyticactivityandCO2
selectiv-ityincludedesignofitsmicrostructure[4],addingathird[5–9],and fourthcatalystcomponent[3]andmodifyingthecatalystsupport [10–12].
∗Correspondingauthor.Tel.:+16042213071;fax:+16042213001. E-mailaddress:Khalid.Fatih@nrc.gc.ca(K.Fatih).
Singlefuelcelltestingisoneimportanttoolforfuelcellcatalyst designasitrevealstheperformanceofthecatalystinactual oper-atingconditions.Publishedworkhasshownthatthedirectethanol fuel cell performance is significantly affected by theemployed testingconditions,thefabricationprocessesandmaterialsofthe membraneelectrodeassembly(MEA).Theeffectoftemperature andethanol concentrationontheethanolcrossoverrateandits impactoncellperformancehasbeenstudiedbySongetal.[13]. Theauthorsfoundthatethanolcrossoverincreasedwithincreasing temperatureandethanolconcentration.Similarly,usinga refer-enceelectrodeLiandPickupfoundthattemperatureandethanol concentration have a positive effect on the ethanol oxidation reaction,buttheoppositeeffectwasfoundfortheoxygen reduc-tionreaction,demonstratingthesignificantimpactthatethanol crossoverhasontheoxygenreductionreaction[14].Praminiketal. [15],studiedtheeffectofthetemperatureoftheanodeandthe cathode,separately,aswellastheeffectoftheethanol concentra-tion.Theauthorsfoundaperformancemaximumat90◦Cforthe
anodeand60◦Cforthecathodewiththetestingtemperaturerange
of42–120◦Cand42–88◦Cforanodeandcathode,respectively.The
authorsestablishedanoptimumethanolconcentrationof2M.In additiontothetestingparameters,theMEAfabricationprocesses alsoaffecttheDEFCperformance.Thishasbeendemonstratedby Songetal.,whocomparedtheperformanceandstabilityofagas diffusionelectrode(GDE)basedMEAwithacatalystcoated mem-brane(CCM)basedMEA[16].AlthoughtheCCMMEAhadhigher ethanolcrossoverrate,itsperformance andstabilitywere supe-riorcomparedtotheGDEMEA,havingapeakpowerdegradation
0378-7753/$–seefrontmatter.Crown Copyright © 2011 Published by Elsevier B.V. All rights reserved. doi:10.1016/j.jpowsour.2011.08.080
10626 V.Alzateetal./JournalofPowerSources196 (2011) 10625–10631
Table1
Propertiesoftheanodediffusionlayer.
Anodediffusionlayer Thickness[m] Porosity[%] PTFEloading[wt.%] Description
CFPToray-120 370 78 0 WithoutMPL
CFP-25BCSGL 235 80 5 WithMPL(23%PTFE)
CFCE-tekB-1/B(cloth) 445 – 0 WithoutMPL
of15%against34%fortheGDEMEAina10hlifetest,whichwas attributedtolessdelaminationproblemsinthecaseoftheCCM MEA.Thestructureofthecatalystlayerhasalsobeeninvestigated forDEFC[17].Inthiswork,theauthorsobtainedhighercell per-formanceusingporeformersintheanodecatalystlayer,andby increasingPTFEcontentinthecatalystlayerfrom10to20wt%. Thesetwoparametersweresaidtoimprovetheflowsystem net-workfortheremovalofethanolelectro-oxidationproductspecies andthereforehavingmorecatalystsitesavailableforthereaction. Theobjectiveofthisworkistocreateaclearerandbroader pic-tureoftheeffectofthemainparametersusedduringdirectethanol fuelcelltesting. Specifically,theeffectofcathodebackpressure, celltemperature,ethanolsolutionflow rate,ethanol concentra-tion,andoxygenflowratewillbepresented.Furthermore,three differentanodediffusionmediaweretested.Theeffectofusing car-bonfibrecloth(CFC)andcarbonfibrepaper(CFP)isexamined,as wellasthepresenceofamicroporouslayer(MPL).Thecell perfor-mancewasevaluatedmeasuringthefuelcellvoltageasafunction ofcurrentdensityandcalculatingthepowerdensityfromthese measurements.Theresultsarepresentedaspolarizationandpower curves.
2. Experimental 2.1. Materials
Nafion®N117membranes(DuPont)werepre-treatedat80◦C
with3wt%H2O2and0.5MH2SO4solutionsfor1hand,rinsedand
storedinde-ionisedwater.HiSPEC(JohnsonMatthey)4000(Pt/C) and5000(Pt1Ru1/C)wereusedasthecathodeandtheanode
cata-lyst,respectively.ThecathodediffusionmediawasSigracet®GDL
25DC(SGLGroup),whichhas20%PTFEcontent.Fortheanode,three typesofdiffusionlayerswereused:(i)Sigracet® GDL25BC(SGL
Group),whichisaCFPwitha5%PTFEcontentandamicro-porous layer(MPL)(23%PTFE),(ii)TGP-H-120CFP(Toray)and (iii)CFC (E-TEK).Table1summarizesthepropertiesofthethreedifferent diffusionmediaused.
2.2. ElectrodeandMEApreparation
Electrodeswerepreparedbysprayingthecatalystonthe dif-fusion media. The catalyst ink was composed of the catalyst, Nafion® ionomersolution(5wt% inalcohols/water, Alfa Aesar),
andalcohol/watersolution.Thismixturewastreatedwithan ultra-sonicprocessor(Cole-Palmer)inpulsemodefor1h.Theinkwas sprayedusingan auto-spray(nozzle-XYtable) system.The cat-alystmetalloadingwas2mgcm−2 forbothanodeandcathode,
whiletheNafion®ionomercontentinthecatalystlayerwas20wt%.
TheMEAs werefabricatedby hot-pressingthe Pt/Cand PtRu/C electrodes(5cm2)onto each side of theNafion® membrane at
90kgcm−2and140◦Cfor4min.
2.3. Fuelcellmeasurements
DEFCperformancetestswereconductedina5cm2singlefuel
cellhardware(Fig.1).Serpentineflowfieldgraphiteplateswere used for both cathode and anode. Tests were performed with a commercial test station (Fideris). Prior to polarization curve
measurements,thebreak-inoftheMEAwasperformedbysetting thecellataconstantvoltageof0.2Vfor2–4huntilthecurrent wasstableusing1Mmethanolsolutionasfuel.Fortheactual mea-surementsethanolsolutionsandun-humidifiedoxygenwereused asreactants.Thevariablesandtestingconditionsaresummarized inTable2.Polarizationcurveswereperformedgalvanostatically, eachpointwasmeasuredfor2min,whichwasenoughtimetoget astablepotentialresponse.Aftereachpolarizationcurvedeionised water wasflown throughtheanodecompartment toavoidcell degradation.Beforemeasuringeachpolarizationcurve,thecellwas keptatopencircuitvoltage(OCV)underthetestingconditionsfor 30minforstabilization.
3. Resultsanddiscussion
3.1. Effectofanodediffusionlayer
Theeffectoftheanodediffusionlayerwasstudiedusingthree typesofsubstrates,CFPwithMPL,CFP,andCFC.InhydrogenPEM fuelcellstheMPLisknowntoimprovethecellperformance affect-ingthewatertransportproperties,thecatalystlayerstructureand electricalcontact;inthecaseofmethanolfuelcells,theMPLcan alsoaffectthefuelcrossoverandCO2transport[18].Fig.2shows
theSEMimagesoftheuncoatedandcoatedsurfacesofthe diffu-sionlayers.TheCFPwithMPLhasaveryhomogeneoussurfacewith poresizeslessin1minsize(Fig.2a),whileCFP(Fig.2b)andCFC (Fig.2c)havegreaterandbroaderporesizedistribution.Afterthe catalystlayerissprayedonthesesubstratesacleardifferenceinthe structureisobservedbetweentheCFC(Fig.2f)andtheCFPbased samples(Figs.2dande).ThecatalystlayerdepositedontheCFC hasamoreopenstructurethatfollowsthedirectionofthewoven fibrescomparedtoamoreflatsurfaceintheCFPsamples.Onthe otherhand,thereisnovisibledifferenceinthecatalystlayersurface betweenthesampleswithandwithoutMPL(Figs.2bandd).
Fig.3showsthepolarizationandpowercurvesforthethree typesofanodediffusionlayers.Thetypeofdiffusionlayerdoesnot affecttheOCV,aswellastheperformanceinthekineticcontrolled region;thethreecurvesshowthesamebehaviouruptoacurrent densityof0.020Acm−2.Athighercurrentdensity,theanodewith
theCFPandMPLshowedalowerperformance,reachinga maxi-mumpowerdensityof0.017Wcm−2 comparedto0.028Wcm−2
obtainedwithbothCFPandCFCbasedanodes.Furthermore,the
Table2
Experimentalconditionsusedforeachsetoftest.
Exp.series Variables
Anodediffusionlayer O2flowrate(mLmin−1) Ethanolflowrate(mLmin−1) [Ethanol](M) Temp.(◦C) Cathodeback-pressure(psig)
1 CFP CFP–MPL CFC 300 2 1 90 30 2 CFP 300 2 1 90 0–10–20–30 3 CFP 300 2 1 60–70–80–90 0–30 4 CFP 300 0.6–1–2–5 1 90 30 5 CFP 300 2 0.1–0.5–1–2–5 90 30 6 CFP 50–100–300–500 2 1 90 0–30
cellwiththeCFCbasedanodeachievedthehighestcurrent den-sity.TherearetwodifferencesbetweentheCFPwithMPLandthe othertwosamples.ThefirstoneisthePTFEcontentinCFP(5wt.%). ThehydrophobicityoftheCFPcanreducethetransportofwater butinalesserdegreethetransportofanethanol/watersolution, whichhasalowersurfaceenergy.Inaddition,thePTFEcanreduce theelectricalconductivityoftheCFP.Theseconddifferenceisthe presenceoftheMPL,whichmightactsimilartoabarrierpreventing theflowofliquidtoandfromthecatalystlayerduetothehighPTFE content(23wt.%)aswellastheverysmallporesandlower poros-ity.ConsideringthelowcontentofPTFEintheCFP,theporesizeof
theMPLanditshydrophobicityseemtobecomplementaryfactors inthereductionofthecellperformance.Thispostulategoesinthe samedirectionasthemodellingworkdonebyAndreadisetal.[19] inwhichwasreportedthattheporosityofthediffusionlayerhasan importanteffectontheperformance.Forexamplea22%increasein performancewascalculatedwhenthediffusionlayer’sporosityis changedfrom0.4to0.8.Infacttheirsimulatedpolarizationcurves haveaverysimilarbehaviourastoFig.3,i.e.,thekineticregion isnotaffectedbychangingthediffusionlayerporositywhileat highercurrentstheslopeofthecurveincreaseswithdecreasing porosity.Furthermore,Biswasetal.[17]foundbetterperformance
10628 V.Alzateetal./JournalofPowerSources196 (2011) 10625–10631
Fig.3.Polarizationandpowercurveswithdifferentanodediffusionmediafor1M EtOHfeed(2mLmin−1and0psig)andnon-humidifiedoxygen(300mLmin−1and
30psig)at90◦C.
byincreasingboththeporosityandthePTFEcontent(20%)inthe catalystlayer.However,intheircasethecatalystlayerwas fabri-catedusingporeformers,thereforethePTFEcontentcouldhavea verydifferenteffectcomparedtothepresentwork.
Forthisexperimentalsystemthemajorityoftheproductsare inliquid phase,for theidealDEFCsystemthereactionproduct isCO2,thereforetheflowdynamicswouldbeverysimilartothe
directmethanolfuelcell.Gasmanagementhasbeenacritical fac-torfor directmethanolfuelcells designgiventhat CO2 bubbles
canremaininthediffusionlayer.Thesebubblesgenerallyblock theporesusedfor themethanoldiffusiontothecatalystlayer, leadingtofuelstarvationandtherefore decreasingthecell per-formance.A comprehensivereview waspublishedonthemass transportphenomenainaDMFCsystem[20].Forexample,inan experimentperformedbyLuandWang[21],theeffectoftheanode diffusionmediaofaDMFCwasevaluated.Untreated(hydrophilic) CFC wascompared witha 20% PTFE treated CFP, which had a homemadeMPL.Theauthorsconcludedthattheadditionofthis layerdecreased therateof methanolcrossoverdue tothe low-permeabilitythattheMPLprovides.Ontheotherhandtheremoval ofCO2bubblesfromthebackinglayerwaseasierintheCFCfrom
visualexperiments,although it wasnotclear whetherthis dif-ferencewasduetotheporedistributiondifferencesorthePTFE contentinthematerials.Thereforetheoptimumdiffusionmediafor DEFCanodeswoulddependonthereactantflowregime,including theamountofgasproducedintheanode.
3.2. Effectofcathodebackpressureandcelltemperature
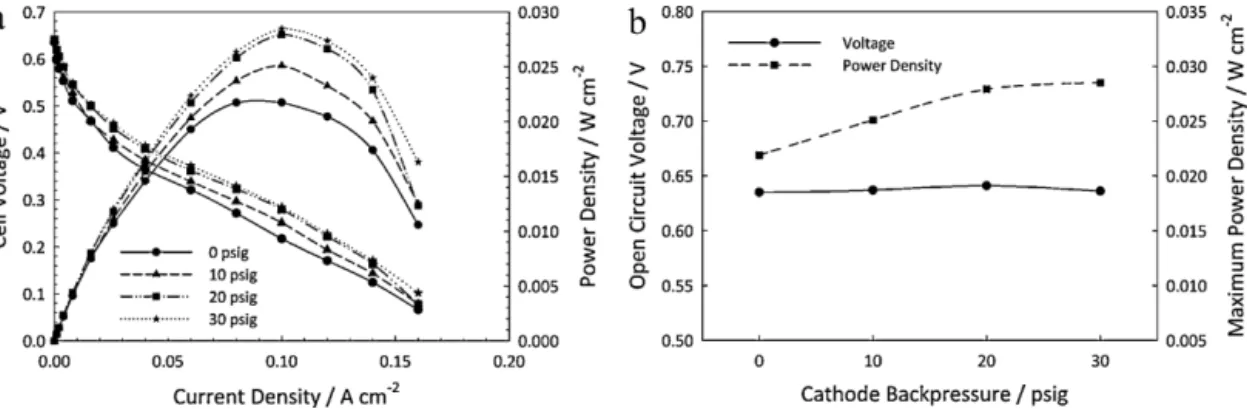
Fig.4showstheeffectofcathodebackpressureonthecell per-formance.Ingeneraltheperformanceimproveswithincreasing thebackpressure,mainlybecauseofthereductionoftheactivation overpotential.Intheohmicregion,thefourcurveshavesimilar behaviour.However,inthemass transport region,the effectof increasingthebackpressureseemstodiminishasthecurrent den-sityincreases.Ethanoltransport in theNafionmembrane takes placethroughthreedifferentphenomena:electro-osmosis; diffu-sionandhydraulicpermeation.Whenthepressureatthecathodeis higherthanattheanode,thereisbackconvectionofethanolfrom thecathodetotheanodeduetothehydraulicpermeation.This resultsinanoverallreductionofethanolcrossover.Thereduction ofethanolconcentrationinthecathodewillreducetheparasitic currentsandpoisoningcreatedbythereactionofethanolonthe cathodeactivesites.Thisenhancestheoxygenreductionreaction kineticsandreducestheactivationoverpotentialasseeninFig.4. Thecathodebackpressurealsoincreasestheoxygensolubilityin
theNafionionomerpresent inthecatalyst layer.Thiswill pro-duceahigheroxygenconcentrationinthetriplephaseboundary, enhancingtheoxygenreductionreactionrate.
Asmentionedpreviously,themaximumcurrentdensityvalues areverysimilaratthefourtestedbackpressures.Athigher cur-rentdensitiestheconcentrationofethanolintheanodecatalyst layerislower,whichaffectsthefuelcellperformanceintwoways. First,theconcentrationoverpotentialattheanodeincreasesand second,thecrossoveroftheethanolduetodiffusiondecreasesas thedifferenceinconcentrationbetweentheanodeandthecathode isreduced.Therefore,thefactthatthemaximumcurrentdensity isnearlyindependentofthecathodebackpressuresuggeststhatin thisregionofthepolarizationethanolmasstransferisgoverning thecellperformance.Thereductionofthecrossoverrateand there-foretheparasiticcurrentwithincreasingcellcurrenthasbeenalso reportedbyAndreadisetal.throughamodellingstudy[22].Inthe samemodellingwork,itwasreportedthattheethanolcrossover ismaximalatOCV.Inthepresent study,Fig.4bshowsthatthe OCVisalmostunaffectedbybackpressurewithastablevalueat 0.64V(variationsareintheorderofmV).Itisimportanttonote thatastabilizationperiodof30minwasusedbeforemeasuring eachpolarizationcurve.TheOCVwasfoundtobeverysensitiveto thechangeofconditionsbutonlyatthemomentwhenthe pertur-bationwasmade.Forexample,anOCVof0.8Vwasrecordedwith increasingbackpressurebutonlyforafewseconds,anditwould slowlydecreaseuntilreachingastablelowerpoint.Itwouldhave beenexpectedthatahigherbackpressurewouldresultinahigher OCVduetothereductionoftheethanolcrossover.Thefactthat thesteadystateOCVisalmostunchangedwithincreasing back-pressurecanbeduetoasteadypoisoningofthecathodecatalyst layer.Thismaybeduetoanaccumulationofethanolatthe cath-odesideofthemembrane,whichlowerstheinitiallyrecordedhigh OCVafterapressure increase.Asforthemaximumpower den-sity,itincreasesalmostlinearlywithincreasingbackpressureupto 20psig(Fig.4b).Byincreasingthepressurefrom20to30psigthe performancedoesnotimprove,thereforeasaturationpointmight havebeenreachedat20psig.Itisimportanttonotethatthereis alsothecrossoverofspeciesfromthecathodetotheanodesuchas oxygen,ethanoland/orreactionproductsofethanoloxidationthat mayaccumulateatthecathodesideofthemembrane,whichwould increasebyincreasingthecathodebackpressure.JamesandPickup havediscussedtheissueofethanoloxidationproducts(aceticacid andacetaldehyde)crossingtotheanodeside[23].WhileJablonski etal.reportedtheeffectofoxygencrossingfromthecathodetothe anodeandreactingchemically[24]withethanoltoproduceacetic acidandacetaldehyde.Ineithercasethepresenceof electrochem-icalreactionproductsintheanodewouldlowerthecell’sOCVand performanceandcounteractthepositiveeffectofbackpressureon thecathodekinetics.
Fig.5showstheeffectoftemperatureontheDEFCperformance withcathodebackpressure(30psig)and withoutcathode back-pressure(0psig).ThepolarizationcurvesinFigs.5a andbshow asimilarbehaviourwithincreasingthetemperature.Thekinetic regionisenhancedandtheslopeoftheohmicregiondecreases. Electrodekinetics,membraneconductivityandmasstransfer prop-erties are thermally activated, therefore it is expected that an incrementin fuelcelltemperaturewillresult ina performance enhancement. Onthe otherhand,fuelcrossoveris alsoa ther-mallyactivatedprocess.WithincreasingtemperaturetheNafion polymerbackbonerelaxesandexpandsallowinghighertransport rates,inadditiontheethanoldiffusivityisalsoenhanced[13,25]. Therefore the cathodekineticshastwo competing effects with increasingtemperature.LiandPickupreportedthattheeffectof ethanolcrossoverissosignificantthatthecathodeperformance decreaseswithincreasingtemperaturealthoughtheoxygen reduc-tionreactionrateincreaseswithtemperature.Theyconcludedthat
Fig.4.Effectofcathodebackpressureonfuelcellperformancefor1MEtOHfeed(2mLmin−1and0psig)andnon-humidifiedoxygen(300mLmin−1)at90◦C,(a)polarization
andpowercurvesand(b)opencircuitvoltageandmaximumpowerdensity.
theoverallcathodebehaviourmaybetheresultofanopposing dependencewithtemperatureduetotheparasiticcurrentand poi-soningofthecatalyst[14].Butoverall,thedependenceofothercell processeswithtemperatureseemstobegreaterthanthecrossover sincetheperformanceisenhanceddespitetheincreaseinethanol crossover.
The maximum power density increases with temperature almostlinearly forboth conditions as seenin Fig. 5c,withthe exemptionofthe60◦Cpointfortheunpressurizedcondition.The
differenceinpowerdensityforthesystemsatthesame temper-aturebutwithandwithoutbackpressureisinthe6–7mWcm−2
rangeforallthepointsexceptforthe60◦Cpointwherethe
differ-enceis3mWcm−2.Thesmallerdifferenceatalowesttemperature
suggeststhatat60◦Cthecrossovereffectislessimportant.
There-foretheeffectofthebackpressureisreduced.TheOCVshoweda verysmallpositivedependencewithtemperatureinboth circum-stances(Fig.5c)andwasslightlyhigherwithcathodebackpressure. WhileSongetal.[13]showedthattheOCVwasgreatlyaffectedby temperature,althoughtheirworkwasdoneatarangelowerthan 75◦C.Forexample,whenthetemperaturewasreducedfrom75◦C
to55◦CtheOCVdecreasedfrom0.62to0.53V.Thiscouldindicate
that,atlowertemperatures,theanodekineticsaremoreimportant thantheeffectofethanolcrossover.Thereforeanincreaseinthe temperaturewouldimprovetheOCV.Inthiswork,athigher tem-peraturesasinFig.5aandc,competingeffectbetweenenhanced anodekineticsandhighercrossoverwithincreasingtemperature, resultedinanalmostinvariableOCVwithtemperature.
3.3. Effectofethanolflowrateandethanolconcentration
Fig.6showstheeffectofflowrateofethanolsolutiononthefuel cellperformanceintherangeof0.6–5mLmin−1.Theperformance
isalmostinvariableinthe1–5mLmin−1rangebutfor0.6mLmin−1
themaximumpowerdensityisarounda10mWcm−2lowerthan
at thehigher flow rates (Fig. 6b).The differencein the perfor-mancebetween0.6mLmin−1andotherflowratesstartstoappear
athighercurrentdensitiesofthekineticregionofthepolarization curve(Fig.6a).Withincreasingcurrent,thedifferencebetweenthe 0.6mLmin−1curveandtheothercurvesremainsconstant,i.e.,the
curvesarealmostparallel.Thereforetheohmicandmasstransfer
Fig.5.Effectofcelltemperatureonfuelcellperformancefor1MEtOHfeed(2mLmin−1and0psig)andnon-humidifiedoxygen(300mLmin−1)at90◦C,(a)polarizationand
10630 V.Alzateetal./JournalofPowerSources196 (2011) 10625–10631
Fig.6. Effectofethanolsolutionflowrateonfuelcellperformancefor1MEtOHfeed(0psig)andnon-humidifiedoxygen(300mLmin−1,30psig)at90◦C,(a)polarization
andpowercurvesand(b)opencircuitvoltageandmaximumpowerdensity.
Fig.7.EffectofethanolconcentrationfuelcellperformanceforaqueousEtOHfeed(2mLmin−1and0psig)andnon-humidifiedoxygen(300mLmin−1,30psig)at90◦C,(a)
polarizationandpowercurvesand(b)opencircuitvoltageandmaximumpowerdensity.
overpotentialsarenotaffectedbytheethanolflowrate.This sug-gestsasurfacephenomenoneffectatlowethanolflowrates,such aslowerremovalofreactionproductsthatblockactivesitesorthe decreaseofin-planetransportofreactantandthereforealower utilizationoftheavailablecatalystsites.
Theeffect of ethanol concentrationon thecell performance is illustrated in Fig. 7. It is seen that the different regions in thepolarizationcurvehavedifferentdependenceontheethanol concentration(Fig.7a).Both,theOCV(Fig.7b)andthefuelcell per-formanceinthekineticregionincreasewithdecreasingethanol concentration.Whileinthemasstransferregiontheperformance increaseswithincreasingethanolconcentrationupto2M.Atvery lowethanolconcentrationtheperformancesuddenlydropsdue tomasstransferlimitations. With0.1Mtheperformancedrops atacurrentdensityofapproximately0.015Acm−2,whereasthis
happensat0.06Acm−2 foraconcentrationof0.5M.Inthecase
of1Methanol solution,thereis a slightinflection inthecurve at0.14Acm−2.Atthesethreepointstheethanolstoichiometries
are8.04,10.72and9.18,respectively(assumingthepartial oxida-tionreactionofethanoltoaceticacid,i.e.,4electronspermolecule ofethanol).Therefore,onecanconcludethatunderthese condi-tionsaminimumstoichiometryofapproximately10isnecessary toavoidmasstransferlimitations.Byincreasingtheconcentration from1Mto2Mtheperformanceisalmostinvariable,differences areonlyseenatthemaximumcurrentdensity.Whileincreasing ethanolconcentrationfrom2Mto5Mproducesadropinthe per-formanceinallregionsofthepolarizationcurve.Intermsofthe maximumpowerdensitythereisamaximumbetween1Mand 2M(Fig.7b).Asseenfromtheseresults,byvaryingtheethanol concentrationthereisaclearcontributionoftwoeffectstothecell performance.Bettermasstransferathighethanolconcentrations andlowerethanolcrossoveratlowethanolconcentrations.Atlow currentsthereisalowconsumptionofethanol;thereforea vari-ationofethanolconcentrationdoesnotaffecttheanodekinetics inthestudiedconcentrationrange.Onthecontrary,thecathode kineticseemstobeenhancedbythelowerethanolconcentration
Fig.8.Effectofoxygenflowrateonfuelcellperformancefor1MEtOHfeed(1mLmin−1,0psig)andnon-humidifiedoxygen(300mLmin−1,0psig)at90◦C,(a)polarization
duetothelowerethanolcrossover.Withincreasingcurrentdensity, theethanolconcentrationstartstoplayaroleintheanoderesponse andtheextremecaseisseenwhenverylowethanolconcentrations weretestedwiththepresenceofalimitingcurrent.
3.4. Effectofoxygenflowrate
Fig.8showstheeffectofoxygenflowrateonthefuelcell per-formance.Thesetestswereperformedatatmosphericpressure.No effectontheperformancewasobservedinthe50–500mLmin−1
rangewith30psigbackpressure(resultsarenotshown).InFig.8a itisseenthattheperformanceincreaseswithincreasingoxygen flowrateupto300mLmin−1,increasingtheflowratefurtherdoes
notproduceanychangeontheperformance.Fig.8bshowsthatthe OCVandthemaximumpowerdensityincreasewithincreasingthe flowrate,whichisduetoahigherconcentrationofoxygenatthe cathodewithrespecttothecrossoverproductsandtoanincrease intherateofremovalofcrossoversubstancesthatcanpoisonthe cathodecatalyst.
4. Conclusions
Theeffectof operatingparameters ontheDEFCpolarization curve,OCVandmaximumpowerdensitywastestedandanalyzed. TheOCVwashighlydependantontheconcentrationofethanolin thefuelstreamandincreasesbydecreasingtheethanolcontent. Incontrast,theeffectoftheotherstudiedparametersontheOCV wasverysmall.Takingintoaccountthesesmallvariationsitcan besummarizedthattheOCVincreasedwiththeoxygenflowrate, cathodebackpressureandtemperature,andwasindependentof fuelflowrateandanodebackinglayer.
Ingeneral,thekineticallycontrolledregionofthepolarization curveswasenhancedbyincreasingthetemperature,the backpres-sureandtheoxygenflowrate,whileitdecreasedbyincreasingthe ethanolconcentration.Theseparametersaffectedeitherorboththe electrodeintrinsickineticsandtheethanolcrossover.Furthermore, thekineticresponseofthefuelcellwasfoundtobeindependent ofethanolsolutionflowrateandanodediffusionlayer.Thecell’s masstransferpropertieswereparticularlyaffectedbytheethanol concentrationandinlesserextentbytheanodebackinglayerand reactantflowrates.
Increasingthetemperatureimprovedthemaximumpower den-sityalmostlinearly.Withbackpressuretheperformanceincreased up to 20psig, further increments in the backpressure did not producehigherperformance.Similarbehaviourwasseenforthe oxygenflowrateatvalueshigherthan300mLmin−1.Higherpower
densitieswerefoundforethanolconcentrationof1Mandethanol flowratehigherthan1mLmin−1.
ThegasdiffusionlayersthatdidnothaveanMPLshowed supe-riorperformance.Intermsofthediffusionlayer,theDEFCsystem isuniquesincereactantsandproductsareallliquids.Thisisnot thecaseforthemoreextensivelystudiedsystemsusingmethanol (liquidfuel–gasproduct)andhydrogen(gasfuel–liquidproduct) asfuels.Thereforemoreworkisneededintheoptimizationofthe DEFCelectrodeproperties,includingdiffusionlayers.
Acknowledgments
TheNational ResearchCouncil Canada-Institute forFuel Cell Innovation(NRC-IFCI) andAgricultureAgri-FoodCanada(AAFC) through the Agricultural Bioproducts Innovation Network Pro-gram(ABIP)supportedthiswork.TheauthorsthankMariusDinu, AndrewMattie,KevinBereraandTomVanderhoekfortheir contri-butioninthefabricationoftheinkauto-spraysystemandfuelcell hardware.
References
[1]C.Lamy,S.Rousseau,E.M.Belgsir,C.Coutanceau,J.M.Léger,Electrochim.Acta 49(2004)3901.
[2]S.Song,P.Tsiakaras,Appl.Catal.B:Environ.63(2006)187.
[3] K.Fatih,V.Neburchilov,V.Alzate,R.Neagu,H.Wang,J.PowerSources195 (2010)7168.
[4]E.Antolini,E.R.Gonzalez,Catal.Today160(2011)28.
[5]E.V.Spinacé,M.Linardi,A.O.Neto,Electrochem.Commun.7(2005)365. [6] E.Antolini,F.Colmati,E.R.Gonzalez,Electrochem.Commun.9(2007)398. [7]A.Kowal,M.Li,M.Shao,K.Sasaki,M.B.Vukmirovic,J.Zhang,N.S.Marinkovic,
P.Liu,A.I.Frenkel,R.R.Adzic,Nat.Mater.8(2009)325.
[8]E.Lee,A.Murthy,A.Manthiram,Electrochim.Acta56(2011)1611.
[9] J.Ribeiro,D.M.dosAnjos,K.B.Kokoh,C.Coutanceau,J.M.Léger,P.Olivi,A.R.de Andrade,G.Tremiliosi-Filho,Electrochim.Acta52(2007)6997.
[10]R.F.B.DeSouza,M.M.Tusi,M.Brandalise,R.R.Dias,M.Linardi,E.V.Spinacé,M.C. dosSantos,A.O.Neto,Int.J.Electrochem.Sci.5(2010)895.
[11] J.E.Thomas,A.R.Bonesi,M.S.Moreno,A.Visintin,A.M.CastroLuna,W.E.Triaca, Int.J.HydrogenEnergy35(2010)11681.
[12]X.Zhao,W.Li,L.Jiang,W.Zhou,Q.Xin,B.Yi,G.Sun,Carbon42(2004)3263. [13]S.Song,W.Zhou,J.Tian,R.Cai,G.Sun,Q.Xin,S.Kontou,P.Tsiakaras,J.Power
Sources145(2005)266.
[14] G.Li,P.G.Pickup,J.PowerSources161(2006)256.
[15]H.Pramanik,A.A.Wragg,S.Basu,J.Appl.Electrochem.38(2008)1321. [16]S.Song,G.Wang,W.Zhou,X.Zhao,G.Sun,Q.Xin,S.Kontou,P.Tsiakaras,J.
PowerSources140(2005)103.
[17] S.K.Biswas,P.Sambu,S.Basu,Asia-Pac.J.Chem.Eng.4(2009)3.
[18]M.Blanco,D.P.Wilkinson,in:D.P.Wilkinson,J.Zhang,R.Hui,J.Fergus,X.Li (Eds.),ProtonExchangeMembraneFuelCell—MaterialsPropertiesand Perfor-mance,CRCPress,BocaRaton,2010,pp.191–303.
[19]G.M.Andreadis,A.K.M.Podias,P.E.Tsiakaras,J.PowerSources194(2009)397. [20]T.S.Zhao,C.Xu,R.Chen,W.W.Yang,Prog.EnergyCombust.Sci.35(2009)275. [21]G.Q.Lu,C.Y.Wang,J.PowerSources134(2004)33.
[22]G.M.Andreadis,A.K.M.Podias,P.E.Tsiakaras,J.PowerSources181(2008)214. [23]D.D.James,P.G.Pickup,Electrochim.Acta55(2010)3824.
[24]A.Jablonski,P.J.Kulesza,A.Lewera,J.PowerSources196(2011)4714. [25]S.Kontou, V. Stergiopoulos, S.Song, P. Tsiakaras,J. Power Sources 171