Differential effect of long-term leucine supplementation
on skeletal muscle and adipose tissue in old rats: an insulin
signaling pathway approach
Gilbert Zeanandin&Michèle Balage& Stéphane M. Schneider&Joëlle Dupont& Xavier Hébuterne&Isabelle Mothe-Satney& Dominique Dardevet
Received: 8 October 2010 / Accepted: 24 February 2011 / Published online: 7 April 2011 # American Aging Association 2011
Abstract Leucine acts as a signal nutrient in promoting protein synthesis in skeletal muscle and adipose tissue via mTOR pathway activation, and may be of interest in age-related sarcopenia. However, hyper-activation of mTOR/S6K1 has been suggested to inhibit the first steps of insulin signaling and finally promote insulin resistance. The impact of long-term dietary leucine supplementation on insulin signaling and sensitivity was investigated in old rats (18 months old) fed a 15% protein diet supplemented (LEU group) or not (C group) with 4.5% leucine for 6 months. The resulting effects on muscle and fat were examined. mTOR/S6K1 signaling pathway was not significantly altered in muscle from old rats subjected to long-term dietary leucine excess, whereas it was increased in adipose tissue. Overall
glucose tolerance was not changed but insulin-stimulated glucose transport was improved in muscles from leucine-supplemented rats related to improvement in Akt expression and phosphorylation in response to food intake. No change in skeletal muscle mass was observed, whereas perirenal adipose tissue mass accu-mulated (+45%) in leucine-supplemented rats. A pro-longed leucine supplementation in old rats differently modulates mTOR/S6K pathways in muscle and adipose tissue. It does not increase muscle mass but seems to promote hypertrophy and hyperplasia of adipose tissue that did not result in insulin resistance.
Keywords Leucine supplementation . Sarcopenia . Muscle . Adipose tissue . Insulin signaling
DOI 10.1007/s11357-011-9246-0
G. Zeanandin
:
S. M. Schneider:
X. Hébuterne:
I. Mothe-SatneyCentre Hospitalier Universitaire de Nice, Pôle Digestif, Nice F-06202, France
G. Zeanandin
:
S. M. Schneider:
X. Hébuterne:
I. Mothe-SatneyFaculté de Médecine, Université de Nice Sophia–Antipolis, Nice F-06107, France
G. Zeanandin
:
S. M. Schneider:
I. Mothe-Satney (*) INSERM, U907, IFR50,Nice F-06107, France e-mail: satney@unice.fr
M. Balage (*)
:
D. DardevetINRA, Centre Clermont-Ferrand—Theix, UMR 1019, Unité Nutrition Humaine,
63122 Saint Genès Champanelle, France e-mail: balage@clermont.inra.fr M. Balage
:
D. DardevetUniv Clermont 1, UFR Médecine, UMR 1019 Unité Nutrition Humaine,
63001 Clermont-Ferrand, France J. Dupont
INRA, UMR 85 Physiologie de la Reproduction et des Comportements,
Introduction
Aging is frequently associated with major quantita-tive changes in body composition characterized by a decrease in lean body mass (i.e., muscle mass) and an increase in body fat mass. The clinical and functional consequences of muscle mass loss (known as sarcopenia) are decreased physical perfor-mance and autonomy of elderly people. The consequen-ces of fat mass accumulation are less obvious but may play a major role in the metabolic changes observed with aging, especially the development of insulin resistance.
The origin of age-related sarcopenia is multifacto-rial (Boirie2009; Kim et al.2010), but it has become obvious that muscle protein loss during aging may be partly explained by a decreased ability of muscle to respond appropriately to anabolic stimuli such as food intake (Mosoni et al. 1995; Dardevet et al. 2002) through a decreased response and/or sensitivity of protein synthesis and degradation to physiologic con-centrations of amino acids, especially leucine (Dardevet et al. 2000; Combaret et al. 2005; Cuthbertson et al.
2005; Katsanos et al. 2005; Prod’homme et al. 2005;
Katsanos et al.2006). These age-related alterations may be overcome by dietary leucine supplementation. Indeed, postprandial stimulation of muscle protein synthesis and inhibition of protein degradation in old rats can be restored by leucine-supplemented meals (Dardevet et al.2002; Rieu et al.2003; Combaret et al. 2005). Similarly, increasing leucine intake has been shown to improve muscle protein synthesis in the elderly human (Rieu et al.2006), which can be restored to that obtained in younger subjects (Katsanos et al. 2006). Overall, these data have suggested that increas-ing leucine availability may represent a nutritional strategy to limit muscle protein loss during aging. However, a beneficial effect of leucine supplemen-tation on muscle mass in the elderly has not been clearly demonstrated (Balage and Dardevet 2010). Only Verhoeven et al. (2009) assessed the effect of a mid-term (3 months) leucine supplementation on skeletal muscle mass and strength in healthy elderly men, and reported no beneficial effect of this nutritional intervention.
The anabolic effect of leucine results in its capacity to stimulate protein synthesis through activation of cell signaling pathways involving the mammalian target of rapamycin complex1 (mTORC1), which
activates two key regulatory proteins involved in the regulation of translation initiation: p70 S6 kinase (S6K1) and 4EBP1 (Vary and Lynch 2007). Leucine is also a potent activator of protein synthesis in white adipose tissue via the same pathway (Lynch et al. 2002b) suggesting that leucine supplementation may therefore affect both muscle mass and fat mass.
Hyperactivation of the mTORC1→S6K1 pathway by amino acids has been shown to increase insulin receptor substrate 1 (IRS1) phosphorylation on serine residues which in turn may lead to impaired activity of PI3K/Akt, critical kinases implicated in the mechanism of insulin action on glucose transport and metabolism (Boura-Halfon and Zick2009). Thus, it has been hypothesized that amino acids used to promote muscle protein metabolism might in turn inhibit the first steps of insulin signaling and finally promote insulin resistance (Um et al.2006; Tremblay et al. 2007a). Alternatively, it has also been reported that dietary supplements of leucine or branched chain amino acids (BCAA) may improve glucose metabo-lism and overall glucose tolerance especially in insulin resistant states through multiple mechanisms including increasing energy expenditure, food intake regulation, and increasing glucose–alanine cycle (Layman 2003; Layman and Walker 2006; She et al.
2007; Zhang et al. 2007; Jitomir and Willoughby
2008). Recently, we reported that short-term leucine supplementation (5 weeks) in young adult rats impaired whole body glucose tolerance but improved insulin-stimulated glucose transport in skeletal muscles (Balage et al. 2011). Leucine is also a precursor of fatty acids and sterols from its carbox-yskeleton (Odessey and Goldberg 1972; Rosenthal et
al. 1974; Frick et al. 1981). Because long-term free
leucine supplementation in elderly has not been extensively investigated, it is not possible to draw conclusions on the efficacy of leucine to counteract or prevent muscle protein loss during aging. Moreover, contradictory data do not allow conclud-ing whether chronic leucine supplementation may be beneficial or not on overall glucose tolerance and insulin sensitivity.
This study was thus conducted to examine the impact of a sustained dietary leucine excess (6 months ad libitum) on overall glucose tolerance, insulin response on muscle glucose transport in vitro, and body composition in old rats. A special focus was put
on studying insulin signaling pathways in skeletal muscle and adipose tissue.
Materials and methods
Animals and diets
This experiment was performed in accordance with the National Research Council’s Guidelines for the Care and Use of Laboratory Animals (DSV-63-08). Old Wistar rats (18 months old, n = 120 at the start of experiment) were maintained in collective cages (three rats per cage) under controlled environmental conditions (temperature 21°C, hygrometry 55%, 12-h dark period starting at 0900 h) with water and food ad libitum. They were separated into two groups fed either a control diet (C group) or a leucine-supplemented diet (LEU group) containing 15% protein from herring flour, 6% lipids, and 60% starch/sucrose (Table 1) for 6 months. The leucine-supplemented diet was leucine-supplemented with leucine (4.45%) and with appropriate amounts of valine and isoleucine in order to prevent the fall of plasma BCAA concentrations induced by leucine supple-mentation as previously described (Rieu et al.2003). The control diet was supplemented with glycine to render the diets isocaloric and to balance the amino acid supplement of the LEU diet. Mean food intake and individual body weight were recorded every 2 weeks.
Oral glucose tolerance test (OGTT)
Conscious rats were subjected to oral glucose admin-istration (1 g/kg body weight) after 18 h fasting, followed by glucose and insulin measurement from blood samples taken in the tail vein as previously described (Balage et al. 2011) at baseline (before starting the experimental period) and at the end of the nutritional experiment.
Experimental design at the end of nutritional period
After the 6-month period of supplementation, food was removed on the evening before sacrifice. On the next morning, each group of rats (C and LEU) was separated into two groups: one group that received a bolus of water and constituted the post-absorptive
state (PA groups), whereas the other group received a nutrient bolus containing 1 g of glucose, 1.2 g of sucrose, and 1 g of an amino acid mixture (Table 1 legend) and constituted the postprandial state (PP groups). The objective of the nutrient bolus was to stimulate acute insulin secretion without increasing acute plasma leucine level (i.e., the leucine content was similar in the nutrient bolus given in C and LEU group) in order to detect the effect of long-term leucine supplementation on postprandial stimulation of insulin signaling pathway, independently of an acute effect of leucine. Rats were then anaesthetized 30 or 60 min after gavage with sodium pentobarbital (6 mg/100 g body weight) and epithrochlearis muscles from PA groups were rapidly dissected intact for in vitro skeletal muscle glucose transport assays. Rats were then killed by exsanguination through the Table 1 Composition of the diets
Ingredients Control LEU
g/kg dry matter Herring flour 206 206 Tryptophana 2 2 Cystinea 3.3 3.3 Glycine 60 0 Leucine 0 44.5 Isoleucine 0 9.8 Valine 0 5.7 Peanut oil 20 20 Sunflower oil 20 20 Sucrose 100 100 Cellulose 50 50 Mineral mixtureb 35 35 Vitamin mixtureb 10 10
Choline bitartrate (41.1% choline) 2.5 2.5
Wheat starch 491.4 491.4
The amino acid mixture of the nutrient bolus is composed in grams/ 100 g mixture: histidine 2.34, leucine 7.39, isoleucine 4.58, valine 5.34, lysine 9.59, methionine 2.92, phenylalanine 4.08, tryptophan 0.98, threonine 4.28, arginine 6.58, glutamine 3.69, proline 3.90, cysteine 1.07, tyrosine 3.11, glycine 5.92, alanine 6.31, glutamic acid 12.64, aspartic acid 9.12, asparagine 2.20, and serine 3.99
a
The diets were supplemented with tryptophan and cystine in order to reach the recommended dietary allowances of these two amino acids in old rats according to AIN93M (Reeves et al.1993)
b
Composition based on AIN-93M-MX and AIN-93-VX com-position (Reeves et al.1993)
abdominal aorta. Blood was collected, centrifuged, and frozen in liquid nitrogen. Liver, gastrocnemius muscles, and perirenal adipose tissue were rapidly removed, weighed, freeze-clamped, and frozen in liquid nitrogen. Other hindlimb skeletal muscles [tibialis anterior, extensor digitorum longus (EDL), and soleus], heart, spleen, and kidneys were quickly excised and weighed. All tissues were stored at−80°C until analysis.
Effect of insulin on skeletal muscle glucose transport in vitro
Epitrochlearis muscles were dissected intact for the in vitro measurement of skeletal muscle glucose trans-port as previously described (Dardevet et al. 1994) with 5.0 mmol/l of 2-deoxy-D-[3H] glucose (DOG; 0.5 μCi/ml) in the absence or presence of various concentrations of insulin.
Analytical procedures
Plasma glucose, insulin, leptin, triglycerides, choles-terol, and HDL; and plasma amino acid concentra-tions were determined as previously described (Balage et al.2011).
Western blots
Muscle analysis An aliquot of frozen gastrocnemius powder (0.3 g) was homogenized in 10 vol of buffer as previously described (Balage et al. 2011). The homogenate was centrifuged at 10,000×g at 4°C for 10 min. Aliquots of supernatants were diluted in sample buffer, boiled for 5 min, and stored at−20°C until protein immunoblot analyses. Equal amounts of proteins were separated by SDS–PAGE and trans-ferred to PVDF membranes. Immunoblotting was performed using appropriate antibodies: Akt, p-Akt (T308), p-Akt (S473), mTOR, p-mTOR (S2448), S6K1, p-S6K1 (T389), p-S6K1 (T421/S424), S6, p-S6 (S240/244), p-S6 (S235/236), eEF2 and p-eEF2 (T56) (Cell Signaling, Beverly, MA, USA), and 4EBP1 (Bethyl Laboratories, Montgomery, TX, USA). IRβ, IRS1, and PI3K were determined after immunoprecipitation as previously described (Balage et al.2011). Briefly, aliquots of frozen gastrocnemius powder were homogenized and homogenates were centrifuged at 12,000×g for 20 min at 4°C. After
normalization for protein concentration, 1 mg of total protein was used to immunoprecipitate various pro-teins using 5 μg of appropriate antibodies [IRβ (Biosciences, Le Pont de Claix, France) or IRS1 (Upstate Biotechnology Inc., Lake Placid] at 4°C overnight. The immunocomplexes were precipitated with 40μl of protein A-agarose for 1 h at 4°C. After two sequential washes, the resulting pellets were boiled for 4 min in reducing Laemmli buffer containing 80 mM dithiothreitol. Proteins were resolved by SDS– PAGE and transferred to nitrocellulose membranes. Membranes were then incubated overnight with appro-priate antibodies: anti-phosphotyrosine antibodies (PY20; Biosciences) or anti-phosphoserine antibody [p-IRS1 (S636/639)] and then with total IRβ or IRS1 antibodies. PI3K activity was measured in p85 immu-noprecipitates from muscle homogenates (2 mg protein) using an anti-rat p85 subunit antibody (Upstate Bio-technology Inc., Euromedex, France) and protein G agarose beads (GE Healthcare Europe GmbH).
The blots were revealed using an enhanced chemiluminescence (ECL) western blotting kit (GE Healthcare). Films were then scanned and identified bands were quantified by densitometry using Image J 1.41o (NIH, USA). Total signaling proteins were expressed in arbitrary units and phosphorylated proteins were corrected for total proteins.
Adipose tissue analysis White adipose tissue sub-merged in liquid nitrogen was crushed using pestle and mortar. Four hundred milligrams of tissue was collected in tubes containing ceramic beads (1.4 mm diameter) with 1 ml of lysis buffer [10 mM potassium phosphate, 50 mM β-glycerophosphate, 50 mM sodium fluorure, 1 mM EDTA, 1 mM EGTA, pH 7.4 supplemented with 1 mM DTT, 1 M sodium orthovonadate, leupeptin (5 μg/ml), aprotinin (150 μg/ml), and 4-(2-aminomethyl)-benzene-sulfonyl-fluoride (AEBSF, 250 μg/ml)] and homoge-nized in a tissue/cell grinder (Precellys; Bertin Technologies, Montigny-le-Bretonneux, France) at 6,500 rpm for 5 s. After a 1-min 2,500-rpm centrifugation at 4°C, the upper lipid phase was removed and the tissue extract transferred into a new tube. One percent (v/v) NP-40 was added and lysis was performed for 30 min at 4°C, then lysates were centrifuged for 20 min at 4°C at 13,000 rpm. The supernatant was then removed and total protein concen-trations determined by using Bradford assay and
spectrophotometer (BioRad, 500-0006). Seventy micro-grams of proteins per sample was loaded in reducing conditions (Laemmli buffer) on SDS–PAGE (5% to 12% polyacrylamide gel depending on the size of the proteins analyzed). Following electrophoresis, proteins were transferred to a PVDF membrane and immunoblotting was performed using different antibodies according to the aim of experiments. When phosphoproteins were analyzed, the membranes were stripped [for 30 min at 50°C in buffer containing 2-mercaptoethanol 100 mM, SDS 2% (v/v), and Tris–HCl 62.5 mM, pH 6.7], and reprobed with antibodies recognizing the native protein. Antibody binding was revealed by enhanced chemilu-minescence and analyzed with the Kodak Image Station 2000R (Rochester, NY, USA).
Analysis of adipokines
White adipose tissue was crushed using pestle and mortar submerging in liquid nitrogen. Four hundred milligrams of pulverized tissues was then homoge-nized in phosphate buffered saline (PBS; 137 mM NaCl, 2.7 mM KCl, 10 mM NaH2PO4, 1.7 mM KH2PO4, pH 7.4) using tubes containing ceramic beads (1.4 mm diameter) and a tissue/cell grinder (Precellys) at 6,500 rpm for 5 s. Samples were centrifuged for 1 min at 4°C and 2,500 rpm. The intermediary phase was then removed and submitted twice to thermal shock (freezing in liquid nitrogen followed by thawing at 37°C). Samples were then centrifuged for 5 min at 4°C and 5,000×g, and total protein concentrations were determined by using Bradford assay. TNF-α and IL-6 were quantified with an Elisa kit (Diaclone, Besançon, France) according to a protocol furnished by the manufacturer. Leptin in adipose tissue (n=18–19 per group) was quantified by using an Elisa kits from Linco Research, Inc. (St Charles, MO, USA).
Real-time RT–PCR
Adipose tissue samples were homogenized in Trizol (InVitrogen Life Technologies Inc., Gaithersburg, MD, USA), total RNAs were extracted, and 1 μg from each sample was reverse-transcribed into cDNAs using Quantitect RT kit (Qiagen, Hilden, Germany). RNA concentration was determined with a spectrophotometer (MC2, SAFAS, Monte Carlo) and
quality of RNA by the OD260:280 ratio and on agarose gels. Real-time PCR was performed by using the ABI prism 7000 sequence detector system (Applied Biosystems). The following forward (F) and reverse (R) primers, respectively, were used for amplifications: 36B4 (used for normalization of the results), 5′-CCACTAAAATCTCCAGAGGTAC-3′, 5′-ATGATCAGCCCGAAGGAGAAGG-3′; PKBβ, 5′-CTCAGCATCAACTG-GCAGGAT-3′, GAAGGGTGGCAGGAGCTTCT-3′; RICTOR, 5′-G C A T 5′-G T 5′-G C - C T C C A C C A 5′-G A T - 3′ , 5 ′ -G -G C C T C C T C C -G T C AT -G -G - 3′; ACCα, 5′-T 5′-T C G C C A G C A - G A A5′-T 5′-T 5′-T G 5′-T 5′-T A - 3′ , 5 ′ -AGATCGCATGCATTTCACTG-3′; FASn, 5′-G A A C T 5′-G A A C 5′-G - 5′-G C AT TA C T C 5′-G 5′-G - 3′ , 5 ′ -AAATCCAACATGGGACAC; SREBP1c, 5′-A 5′-A G G 5′-A T G C T C - G T G C C 5′-A G T G - 3′ , 5 ′ -ACTCAGTGCCAGGTTAGAAGC-3′; peroxisome
proliferator-activated receptor γ (PPARγ), 5′-T C 5′-T C A C A A5′-T G - C C A5′-T C A G G 5′-T 5′-T 5′-T G - 3′, 5′-GCTGGTCGATATCACTG-GAGATC-3′; and adipo-n e c t i adipo-n , 5′ - C C C C T G G C A G G A A A G G A- 3′ , 5′-TCCAGCCCTAC-GCTGAATG-3′.
Statistical analysis
Data are presented as means±SEM. Data were analyzed by one-way ANOVA to analyze the supple-mentation effect (C vs. LEU) or two-way ANOVA to analyze the supplementation and the nutritional state (PA vs. PP states) effects. When a significant overall effect was detected, significant differences among individual means were assessed with Fisher test. When measurements could be repeated over time (body weight, food intake), two-way repeated mea-sure variance analysis were performed. All tests were performed using XLStat (Addinsoft NY, USA, ver-sion 7.5.2). Differences were considered as significant for P <0.05.
Results
Animal characteristics
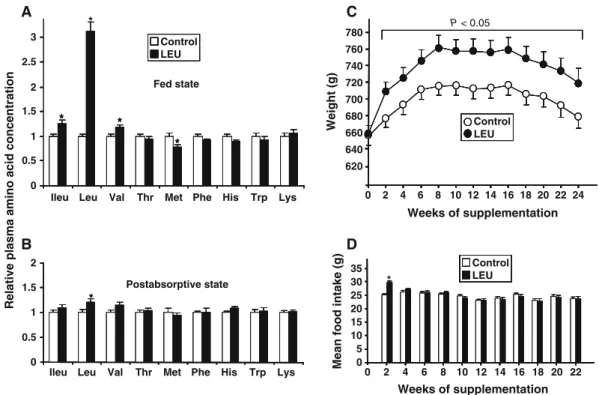
Leucine supplementation dramatically increased plasma leucine concentration in the fed state (Fig. 1a) (+300%, P<0.0001) and moderately in the post-absorptive (PA) state (Fig. 1b) (+20%, P<0.05).
It is important to note that other plasma BCAA levels (i.e., isoleucine and valine) were not changed by leucine supplementation in the PA state and were slightly increased in the fed state (+25% for isoleucine, +17% for valine, P < 0.05). Except for plasma methionine in the fed state, other essential amino acid concentrations were similar in C and LEU groups.
During the 6-month nutritional period, 31 rats died due to aging or were sacrificed because of health problems: no difference was observed between control and leucine-supplemented groups. Body weights of old rats were similar between groups at the beginning of the experiment. Rats supplemented with leucine gained significantly more weight than those on control diet did (Fig.1c), but this weight gain only occurred during the first 2 weeks of the diet (+47±3 vs. +20±3 g in LEU and C groups, respectively; P< 0.0001) and was concomitant to an increase in food intake in this group (29.7±0.6 g/day vs. 25.1±0.5 for LEU and C groups, respectively; P<0.0001) (Fig. 1d). The weight differ-ence was maintained until the end of the nutritional
period even though food intake in LEU group returned to values in C group.
As shown in Table2, muscle mass was not changed by leucine supplementation, whereas perirenal adipose
Table 2 Skeletal muscle and organ weight in control and leucine-supplemented rats Control LEU Muscles (g) Gastrocnemius 5.31±0.1 5.15±0.11 Tibialis anterior 1.83±0.04 1.80±0.04 EDL 0.470±0.009 0.452±0.008 Soleus 0.392±0.009 0.390±0.009 Perirenal adipose tissue (g) 17.63±1.07 25.53±1.51* Heart (g) 1.71±0.04 1.69±0.03 Liver (g) 16.19±0.44 16.90±0.34 Kidneys (g) 6.06±0.40 5.78±0.35 Spleen (g) 1.453±0.051 1.383±0.047 Values are means±SEM, n=35 and 36
*P<0.0001 0 1 2 3 0.5 1.5 2.5 * * *
Ileu Leu Val Thr Met Phe His Trp Lys
Ileu Leu Val Thr Met Phe His Trp Lys *
Fed state
Relative plasma amino acid concentration
0 0.5 1 1.5 2 * Postabsorptive state A B Control LEU * * * * 640 660 680 700 720 740 760 780 0 2 4 6 8 10 12 14 16 18 20 22 24 Weight (g) P < 0.05 620 C Weeks of supplementation
Mean food intake (g)
Weeks of supplementation * D 0 5 10 15 20 25 30 35 2 4 6 8 10 12 14 16 18 20 22 0 Control LEU Control LEU * * * * * * * *
Fig. 1 Effects of a 6-month leucine supplementation in old rats on plasma concentration of essential amino acids in the fed state (a), in the post-absorptive state (measured after an overnight food deprivation) (b) (values are expressed as relative level to control
values and are means±SEM, n=15–16 in each group), on body weight (c), and food intake (d) (values are expressed as means±SEM, n=35 and 36). *P<0.05 vs. control group
tissue weight was dramatically increased (+45%, P< 0.0001). Leucine supplementation did not affect heart, liver, kidneys, or spleen weights.
Overall insulin sensitivity (OGTT)
Because no difference was observed between control and leucine-supplemented rats before starting the nutritional experiment, OGTT data were combined and presented as baseline results. Basal (post-absorptive state) plasma glucose concentrations were similar in C and LEU groups at the end of the nutritional period (5.56±0.13 and 5.48±0.20 mmol/l in C and LEU groups, respectively) but were significantly higher than baseline values (4.95±0.09 mmol/l, P<0.05 vs. C and
LEU values). Basal insulin concentrations were not significantly different in C and LEU groups at the end of supplementation (1.19±0.12 vs. 1.51±0.14 ng/ml in C and LEU groups, respectively; P=0.09), but baseline values were higher than basal C group values (1.52± 0.08 vs. 1.19±0.12 ng/ml, P<0.05). Glucose and insulin plasma concentrations and areas under the curve (AUCs) in response to the oral glucose bolus were similar in both groups at the end of the nutritional period (Fig. 2a, b). We note that glucose AUCs increased, whereas insulin AUCs decreased at the end of supplemental period compared to baseline suggest-ing a time effect of insulin response to glucose challenge. However, the insulin–glucose indexes (over-all insulin sensitivity index) estimated by the product
Plasma insulin (ng/ml) 0 1 2 3 4 5 6 7 0 20 40 60 80 100 InsulinAUC (ng/ml/h) * * C Leu Basal
Time (min) Time (min)
Plasma glucose (mmol/L)
A 4 5 6 7 8 9 10 0 20 40 60 80 100 120 140 0 20 40 60 80 100 120 140 0 40 80 120 160 200 Glucose AUC (mM/h) C Leu Basal *
*
B 1.2 1.4 1.6 1.8 2.0 2.2 0 1 10 100 Insulin (nmol/L)Muscle glucose uptake
(nmolDOG/15 min/ mg muscle)
*
*
C Control LEU Control LEU Baseline*
*
*
*
** *
*
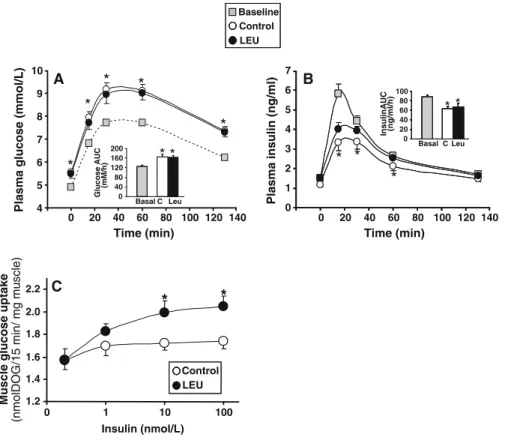
Fig. 2 Effects of a 6-month leucine supplementation in old rats on insulin sensitivity. Oral glucose tolerance test (OGTT) at baseline (before experimental period) and in control and leucine-supplemented rats (a, b). Blood samples were taken from the tail vein for the determination of fasting glucose and insulin levels. Then, an oral glucose challenge (1 g/kg body weight) was given by gavage and plasma samples were taken at 15, 30, 60, and 135 min after glucose administration. Time-course changes and area under the curve (AUC) in plasma glucose (a) and plasma insulin levels (b). Values are means±SEM (n=34 and 35). *P< 0.05 vs. baseline values. Dose–response curves of
insulin-stimulated glucose transport in isolated epitrochlearis muscles from control and leucine-supplemented rats after an overnight food deprivation (c). Epitrochlearis muscles were incubated in the absence or presence of various concentrations of insulin (1, 10, and 100 nmol/l) and with 5.0 mmol/l of 2-deoxy-D-[3H]
glucose (DOG). Muscle glucose transport was calculated by dividing the radioactivity within the epitrochlearis muscles by the specific activity of the DOG into the incubation medium; it was expressed as nmoles DOG per milligram of muscle per 15 min. Values are means±SEM (n=13–16 determinations per insulin concentration). *P<0.05 vs. control group
of the AUCs for glucose and insulin (Cortez et al. 1991) were not changed during time and were similar in C and LEU groups (10,873±690, 10,236±1,013, and 11,034±1,593 relative units at baseline and in C and LEU groups, respectively), demonstrating that overall glucose tolerance was not affected by long-term leucine supplementation in old rats.
Glucose transport in response to insulin in isolated epitrochlearis muscles
In order to determine the effect of leucine supple-mentation on muscle insulin sensitivity, we assessed the in vitro insulin response of glucose transport in skeletal muscles isolated from fasted control and leucine-supplemented rats. Basal glucose transport was similar in muscles from C and LEU groups (Fig. 2c). Increasing insulin concentration in the incubation medium significantly stimulated glucose transport in epitrochlearis muscles from LEU group (P<0.005), whereas it did not in muscles from C group (P=0.4). The maximum insulin response was thus significantly increased in leucine-supplemented rats compared to controls (Fig.2c).
Skeletal muscle signaling pathways
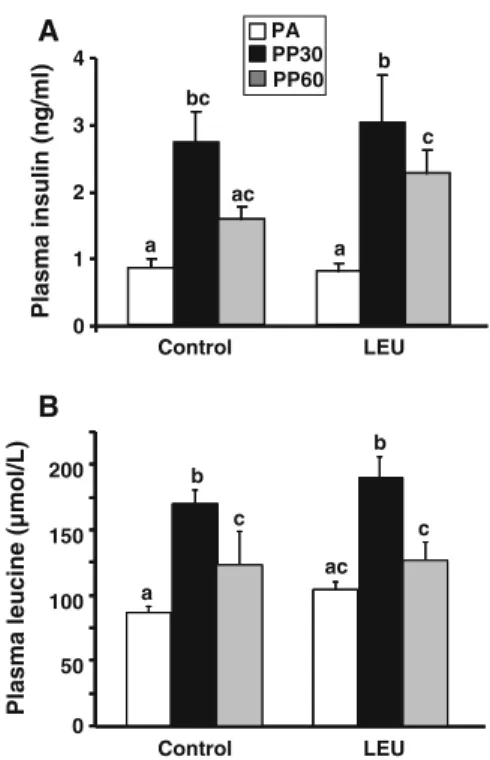
Amino acid and insulin signaling pathway analysis were performed on gastrocnemius muscles taken at the end of the experimental period in the post-absorptive state (PA), 30 min (PP30) and 60 min (PP60) after oral administration of the nutrient bolus. The nutrient bolus induced a similar increase in plasma insulin in C and LEU groups (Fig.3a) with a 3.5-fold increase 30 min after the nutrient bolus in both groups. As wanted, plasma leucine concentration was similar in C and LEU groups whatever the time after the bolus ingestion (Fig. 3b). Thus, any significant differences observed between C and LEU groups in signaling pathway activation will be due to chronic leucine exposure.
Muscle mTOR signaling pathway As shown in Fig.4, chronic leucine supplementation had minor effect on the mTOR/S6K1 pathway in skeletal muscle. The protein levels of mTOR, S6K, S6rp, and eEF2 were similar in C and LEU groups (Fig.4a); similarly, total amount of 4EBP1 represented by the sum of the various phosphorylated forms were similar in both groups (not shown).
Before the nutrient bolus (i.e., in the PA state), long-term leucine supplementation only induced a significant increase in the phosphorylation state of mTOR and S6rp (Fig.4b, e, and f) without alteration of other signaling proteins. The stimulation of mTOR, S6K1, S6rp, and 4EBP1 phosphorylation induced by nutrient intake was not different in leucine-supplemented rats than in controls (Fig. 6b–g). Phosphorylation state of eEF2 was similarly decreased by the nutrient bolus in control and LEU groups (Fig.6h).
Early steps of insulin signaling Total protein content of IRβ and IRS1 were similar in control and
leucine-0 1 2 3 4 Plasma insulin (ng/ml) a bc ac c b Control LEU Control LEU 0 50 100 150 200 a b c b c ac
Plasma leucine (µmol/L)
A B PA PP30 PP60 a
Fig. 3 Plasma insulin (a) and leucine (b) concentrations in control and leucine-supplemented old rats after an overnight food deprivation (PA), 30 min (PP30), or 60 min (PP60) after gavage with a nutrient bolus. Values are means±SEM (n=10–12). Values with different letters are significantly different at least at P<0.05
Fig. 4 Muscle mTOR pathway analysis. Total proteins (a) and phosphorylation status of b mTOR (S2448), c S6K1 (T389), and d (T421/S424); e S6 (S235/236) and f (S240/244); g 4EBP1 and h eEF2 (T56) in gastrocnemius muscles from control and leucine-supplemented old rats after an overnight food deprivation (PA), 30 min (PP30), or 60 min (PP60) after gavage with a nutrient bolus. Values are means±SEM (n=9–12 in each nutritional condition). Values with different letters are significantly different at least at P<0.05
B
0 a c c c b b 1.0 2.0 3.0 P-mTOR(S2448) / mTOR (arbitrary units)Anova: Diet: ns; Bolus: P < 0.0001; diet x bolus: P < 0.05
0 1.0 2.0 3.0 4.0 5.0 6.0 7.0 Control LEU a a ab ab b b P-S6K(T421-S424) / S6K (arbitrary units x 10)
Anova: Diet: ns; Bolus: P < 0.05; diet x bolus: ns
0 0.5 1.0 1.5 2.0 2.5 a b bc b c bc P-S6 (S235/S236) / S6 (arbitrary units)
Anova: Diet: ns; Bolus: P < 0.0001; diet x bolus: ns
Control LEU Control LEU a bc b b bc ac 0 0.5 1.0 1.5 2.0 2.5 3.0 P-S6 (S240/S244)/ S6 (arbitrary units)
Anova: Diet: ns; Bolus: P < 0.01; diet x bolus= 0.09
Control LEU Control LEU 0 1.0 2.0 3.0 4.0 5.0 6.0 ac b a bc b bc
P-eEF2 (T56)/ eEF2 (arbitrary units x10)
Control LEU Control LEU
Anova: Diet: ns; Bolus: P < 0.001; diet x bolus: ns
mTOR
S6K
S6rp
eEF2
C LEU C LEU C LEU C LEU Total proteins
A
Anova: Diet: ns; Bolus: P < 0.0001; diet x bolus: ns
0 1.0 2.0 3.0 4.0 a a a ab bc c P-S6K(T389) / S6K (arbitrary units x 10)
C
D
E
F
G
H
PA PP30 PP60 0 5 10 15 20 25 30 a b a b a aANOVA: Diet: ns; Bolus: P < 0.0001, diet x bolus: ns
4 E-BP1 phosphorylation (% of γ form)
D
H
4 Esupplemented rats (not shown). In the basal state, long-term leucine supplementation did not induce alteration of tyrosine phosphorylation of IRβ (1.31± 0.10 vs. 1.37±0.22 arbitrary units in C and LEU groups, respectively) and IRS1 (1.31± 0.21 vs. 1.13 ± 0.24 arbitrary units in C and LEU groups, respectively). Similarly, it did not alter serine phosphorylation of IRS1 at S636/639 (0.96±0.06 vs. 0.98±0.07 arbitrary units in C and LEU groups, respectively).
We next examined the activation of key signaling proteins involved in insulin-stimulated glucose trans-port such as PI3K activity and Akt phosphorylation on T308 and S473 (Fig. 5). PI3 kinase activity was faintly but significantly increased after the nutrient bolus (P<0.05) in C and LEU groups (Fig.5a). Long-term leucine supplementation induced a moderate but significant increase in total Akt expression in gastroc-nemius muscle (6.40±0.21 vs. 5.53±0.27 arbitrary units in LEU and C groups, respectively; P<0.05) (Fig.5b). Moreover, Akt phosphorylation at T308 and S473 was increased in leucine-supplemented rats 30 min after the nutrient bolus, whereas it was not significantly changed by nutrient intake in the control group.
Adipose tissue analysis
Leucine supplementation did not change basal plasma lipids measured at the end of the supplementation period (triglycerides—1.38±0.16 vs. 1.22±0.12 mmol/l; cholesterol—2.31± 0.16 vs. 2.39± 0.18 mmol/l; HDL—0.68±0.05 vs. 0.61±0.04 mmol/l in C and LEU groups, respectively).
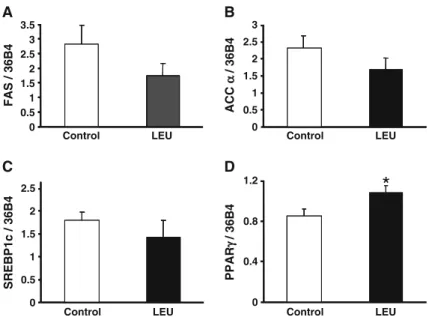
Lipogenesis is dependent upon two key enzymes: fatty acid synthase (FAS) and acetylcoA carboxylase (ACC). FAS expression is regulated by a transcription factor belonging to the Sterol Regulatory Element Binding family, SREBP1c. The process of differentia-tion of preadipocytes into mature fat-loaded adipocytes involves major transcriptional regulators, such as peroxisome proliferator-activated receptors (PPARs). mRNA levels of FAS, ACCα, and SREBP1c were not significantly different between groups (Fig. 6a–c). In contrast, the leucine group showed a significant increase in PPARγ mRNA levels (Fig. 6d). Adipose tissue is an endocrine organ that synthesizes and excretes different adipokines such as leptin, adiponec-tin, and cytokines (Wang et al.2008). When produced
in excess, cytokines such as TNFα or Il-6 induce muscle damages by activating proteolysis, which could counteract the anabolic effect of leucine and promote muscle insulin resistance. On the opposite, adiponectin and leptin improve insulin sensitivity in muscle (Yaspelkis et al. 2004). In the white adipose tissue, protein levels of TNF-α and IL-6 (not shown) were not different between groups. There was a significantly higher protein level of leptin in the white adipose tissue of the leucine-supplemented rats compared to control ones (0.58±0.06 vs. 0.45±0.05 ng/μg protein, respectively; P<0.05), which correlated with a signif-icant increase in basal plasma leptin in leucine-supplemented rats (39.1± 3.9 vs. 22.6±3.3 ng/ml,
P-Akt(S473) / Akt (arbitrary units) 0 2 4 6 8 10 PI3-K activity (CPM x 10 -3) a a b b Control LEU 0 0.5 1.0 1.5 2.0 0 0.5 1.0 1.5 2.0 P-Akt(T308) / Akt (arbitrary units)
Control LEU Control LEU PA PP30 PA PP30 PA PP30 PA PP30 a a a b ab a b b
C LEUCLEUC LEUCLEU
Total Akt PA PP30 A PA PP30 B C PA PP30
Fig. 5 PI3 kinase activity (a) and phosphorylation state of Akt (T308) (b) and (S473) (c) in gastrocnemius muscles from control and leucine-supplemented old rats after an overnight food deprivation (PA) or 30 min (PP30) after gavage with a nutrient bolus. Values are means±SEM (n= 7–10 in each nutritional condition). Values with different letters are signifi-cantly different at least at P<0.05
respectively; P<0.005). Finally, mRNA levels of adiponectin were not modified by the prolonged leucine supplementation compared to the control group (not shown).
Since leucine has been shown to be able to stimulate protein synthesis in adipose tissue through mTOR signaling (Lynch et al. 2002b), we assessed the activation of some signaling proteins involved in mTORC signaling pathway in adipose tissue in the basal state and 30 min after the nutrient bolus. Leucine supplementation did not affect mTOR protein expression. Postprandial mTOR phosphorylation on S2448 was markedly increased in the leucine group indicating a stimulatory effect of the nutritive bolus that was absent in the control group (Fig. 7a). A similar result was obtained for the phosphorylation of S6K1, i.e., the stimulatory effect in the PP state was only observed in the leucine group (Fig.7b).
Unlike in muscle, IRS-1 phosphorylation on Ser636/Ser639 (Fig. 8a) was increased in adipose tissue from leucine-supplemented rats. RICTOR protein was markedly decreased (by about 60%) in leucine-supplemented rats (Fig. 8b), with a 30% decrease in its mRNA level (not shown). Total Akt protein was slightly (P= 0.117) decreased in the leucine group (Fig. 8c) and mRNA level of the β isoform was significantly decreased (about 20%, data not shown). Interestingly, Akt phosphorylation at S473 was not significantly stimulated in the C group after the nutrient bolus, whereas it tended to be
decreased (P=0.09) in adipose tissue from leucine-supplemented rats compared to skeletal muscle.
Discussion
In the present study, 6-month dietary leucine supple-mentation did not potentiate mTORC/S6K1 pathway in muscle and did not induce insulin resistance in old rats as determined by OGTT, muscle glucose uptake, or insulin signaling. Rats receiving the leucine-supplemented diet increased their body weight during the first 2 weeks of supplementation, but this weight gain did not translate into muscle mass increase. On the contrary, leucine supplementation induced a dramatic increase in fat mass as assessed by a marked (44%) increase in perirenal adipose tissue weight associated with increased mTOR/S6K1 and a trend to a negative feedback on early steps of insulin signaling.
A defect in postprandial anabolism with age has been proposed to be one of the mechanisms respon-sible for the loss of muscle mass during aging. This anabolic resistance has been attributed to a decrease in leucine sensitivity and may be counteracted by increasing leucine proportion in the diet in both rodents and humans (Dardevet et al. 2002; Rieu et
al.2003,2006,2007; Combaret et al.2005; Katsanos
et al.2006). Consequently, it has been suggested that long-term dietary leucine supplementation may be necessary to counteract or prevent muscle loss during
Control LEU Control LEU
Control LEU Control LEU 0 0.5 1 1.5 2 2.5 3 3.5 FAS / 36B4 0 0.5 1 1.5 2 2.5 3 ACC α α / 36B4 0 0.4 0.8 1.2 PPAR γ γ / 36B4
*
A B 0 0.5 1 1.5 2 2.5 SREBP1c / 36B4 C DFig. 6 mRNA levels of FAS (a), ACCα (b), SREBP1c (c), and PPARγ (d) in adipose tissue from control and leucine-supplemented old rats. Results are expressed relative to the reference gene, 36B4 (values are means±SEM; n=7–9 for SREBP1c, FAS, and ACCα; n=12 for PPARγ). *P<0.05
aging. Recently, Verhoeven et al. (2009) did not obtain any effect of a 3-month leucine supplementa-tion on skeletal muscle mass and strength in healthy elderly men. However, two confounding effects might explain their data: they did not report a significant elevation of plasma leucine concentration in leucine-supplemented subjects and plasma valine was lower than in placebo group suggesting that a defect in valine availability may have counteracted the anabolic effect of leucine. In the present study, we did not observe any significant increase in skeletal muscle mass in old rats supplemented ad libitum with free leucine for 6 months despite a significant increase in plasma leucine. This absence of change cannot result from imbalance of BCAA concentrations because plasma valine and isoleucine levels were similar to that of the control group in the post-absorptive state and were slightly increased in the fed state. Lack of
muscle mass gain after chronic leucine supplementa-tion could be explained by a loss of leucine efficiency to stimulate postprandial muscle protein synthesis when given ad libitum after a long-term period compared to short-term supplementations through a leucine-enriched meal, as demonstrated previously (Rieu et al.2003,2007). The lack of major activation of the mTOR pathway observed in skeletal muscle from leucine-supplemented rats is consistent with such a hypothesis. Alternatively, fat mass excess in the leucine group might have contributed to induce a low-grade inflammation in rats that should have attenuated leucine’s effect on muscle tissue. Indeed, we previously showed that development of low-grade inflammation partly contributes to the postprandial anabolic resistance in old rats (Balage et al.2010). We also demonstrated that antioxidants are able to improve leucine’s ability to stimulate protein synthe-sis in muscles of old rats (Marzani et al. 2008), suggesting that a combination of leucine and antiox-idant supplementation may be more efficient to counteract age-related sarcopenia than leucine alone. The optimal nutritional strategies based on leucine supplementation to prevent aging-related muscle loss remain to be defined.
Several reasons might have contributed to the increase in adipose tissue mass in leucine-supplemented rats. First, rats in the leucine group showed an increased food intake the first 2 weeks, concomitant to their weight gain. After this period, both groups had comparable food intakes. It is of interest to mention that, as we did not assess body composition throughout the study, we can only assume that fat mass gain was a continuous process, but probably more important in the first 2 weeks of the study due to increased food intake. The mecha-nism by which leucine supplementation may induce increased food intake is not clear. Indeed, Cota et al. (2006) reported an anorexigenic effect of leucine in rats but when directly injected in the intracerebroven-tricular area. However, Zhang et al. (2007) reported orexigenic effects of an oral leucine supplementation in mice; Krauss and Mayer (1965) showed that this effect lasted only for 2 weeks, as observed in our experiment. Leucine may also increase food intake through an increase in gastric emptying or by competing with tryptophan, a precursor of serotonin, for crossing the blood–brain barrier (Laviano et al. 2005). Alternatively, adipose tissue accumulation 0 0.4 0.8 1.2 PA PP30 PA PP30 PA PP30 PA PP30 Control LEU P-mTOR(S2448) / mTOR 0 0.2 0.4 0.6 0.8 1 P-S6K(T389) / S6K1 Control LEU A B a a a b PA PP30 PA PP30 a ab a b P-mTOR mTOR P-S6K1 S6K1
Fig. 7 Phosphorylation of mTOR (S2448) (a) and S6K1 (T389) (b) in white adipose tissue from control and leucine-supplemented old rats after an overnight food deprivation (PA) or 30 min (PP30) after gavage with a nutrient bolus. Values are means±SEM (n=4–6). Values with different letters are signif-icantly different at least at P<0.05
might result from leucine supplementation per se. Indeed, we previously showed a 25% increase in adipose tissue weight in young rats fed a leucine-supplemented diet, whereas food intake was not increased (Balage et al. 2011). Adipose tissue gain in leucine group could also be due to decreased energy expenditure despite contradictory results were described. Indeed, Cheng et al. (2010) reported that young mice maintained on a 7-day leucine-deficient diet underwent a rapid loss of abdominal fat and showed an increase in total energy expenditure. Opposite findings were found by Zhang et al. (2007) who reported that leucine supplementation increased energy expenditure and decreased adiposity. Elevated levels of leptin in both adipose tissue and plasma in the leucine group compared to the control group are consistent with white adipose tissue hypertrophy (Lonnqvist et al. 1997). Moreover, increased activa-tion of the mTOR pathway in adipose tissue from leucine-supplemented rats, as assessed by increased phosphorylation of both mTOR and S6K1, is consistent with a protein synthesis-induced hypertrophy. Previous-ly, Lynch et al. (2002a,b) showed that an acute or a 12-day leucine administration significantly increased
adipose tissue protein synthesis in young rats. Leucine seems to have also a direct positive effect on adipocyte differentiation, as suggested by a higher PPARγ gene expression in the leucine group. Amino acids influence adipogenesis, as reported by in vitro experiments in 3T3L1 adipocytes; a recent study has shown that leucine acts as regulator of adipocyte differentiation factors such as PPARγ and C/EBPα, and is a promoter of PPARγ activity via the mTOR pathway (Kim and
Chen 2004). The increased PPARγ gene expression
after a 6-month leucine supplementation is consistent with these findings and may explain the persistence of a body weight difference between groups, 5 months after their food intake became similar. Even though no microscopic examination was performed, we can hypothesize that leucine supplementation induced both hypertrophy and hyperplasia of white adipose tissue.
A main objective of this work was to assess the effect of long-term leucine supplementation on insulin sensitivity. Indeed, BCAA or leucine alone has been implicated in the regulation of insulin sensitivity with conflicting results. For example, Zhang et al. (2007) showed that long-term leucine supplementation reduced diet-induced obesity and hyperglycemia, 0 0.4 1.2 1.6 0.8 P -I R S 1 (S636 -639 ) / I R S -1
*
Control LEU IRS1 IRS1A
0 10000 20000 30000 RICTOR (A U ) Control LEU**
B
P-Akt Akt PA PP30 PA PP30 0 0.5 1 1.5 2 P-A kt( S47 3) / A k t Control LEU P < 0.1C
0 P-RICTOR (A U ) P-Akt Akt Fig. 8 Phosphorylation of IRS1 (S636/639) (a), RIC-TOR expression (b), and phosphorylation of Akt (S473) (c) in white adipose tissue from control and leucine-supplemented old rats. Akt phosphorylation (S473) was determined after an overnight food depriva-tion (PA) or 30 min after gavage with a nutrient bolus (PP30). Values are means±SEM (n=4–6). *P<0.05, **P<0.005and improved glucose tolerance in mice fed a high-fat diet. In addition, She et al. (2007) demonstrated that disruption of the mitochondrial branched-chain ami-notransferase isozyme gene (BCATm) in mice which resulted in a dramatic increase in BCAA plasma levels was associated with increased glucose tolerance and insulin sensitivity. Finally, co-ingestion of AA mixture or leucine with protein hydrolysate improves glycemic control in type 2 diabetic patients (Manders et al.2005,2006). However, it has also been reported that leucine or BCAA could impair insulin sensitivity or glucose tolerance. Newgard et al. (2009) reported that chronic BCAA supplementation decreased glu-cose tolerance and contributed to the development of insulin resistance in rats fed a high-fat diet. We recently showed that short-term (5 weeks) leucine supplementation impaired whole-body glucose toler-ance in young adult rats that correlated with perirenal adipose tissue accumulation (Balage et al. 2011). In the present study, 6-month leucine supplementation did not change overall glucose tolerance in old rats despite a significant increase in perirenal adipose tissue content suggesting an age-related effect of leucine supplementation: decreased overall glucose tolerance in young vs. no effect in old rats. In agreement, Verhoeven et al. (2009) did not observe any changes in glycemic control and/or whole-body glucose tolerance in healthy elderly men subjected to a long-term leucine supplementation. Alternatively, it could be speculated that whole-body insulin resis-tance was partly present in old rats (18 months old) before leucine supplementation compared to young ones (4 months old), limiting the leucine effect on glucose tolerance. Leucine has been shown to promote glucose uptake in isolated soleus muscle from normal rats (Nishitani et al.2002) or in rats with liver cirrhosis (Nishitani et al.2005). In contrast, Doi et al. (2003) found that leucine did not increase glucose transport in C2C12 myotubes or in vivo in gastrocnemius from young rats (Doi et al.2005,2007). In the present study, basal glucose transport was unchanged in isolated muscle from long-term leucine-supplemented old rats, but the insulin-stimulated glucose transport was improved as previously observed in young rats (Balage et al. 2011). This improvement was sustained by the elevated phosphorylation of Akt at T308 and S473 observed in muscles from leucine-supplemented rats; Akt playing a key role in insulin-stimulated glucose transport. The improved Akt
phos-phorylation in leucine-supplemented rats was not linked to increased PI3K activity, which was similar in control and LEU groups. Besides being a down-stream effector of PI 3-kinases, Akt may also be activated in a PI 3-kinase-independent manner (Bhaskar and Hay2007), but this was not investigated in the present study. It may be surprising that increased insulin-stimulated glucose uptake did not translate into overall glucose tolerance increase in leucine-supplemented rats (see above). However, Kleemann et al. (2010) reported that development of insulin resistance is a time- and tissue-dependent process. They clearly showed that high-fat-diet-induced insulin resistance in mice produced overall glucose intolerance at week 1, decreased insulin sensitivity only at week 3 in liver, at week 12 in white adipose tissue, without change in skeletal muscle using hyperinsulinemic clamp technique. Interestingly, phosphorylation of IRS1 on S636/639 was increased in adipose tissue from leucine-supplemented rats, whereas mRNA and protein levels of Akt as well as mRNA and protein levels of RICTOR (an activator of Akt phosphoryla-tion) were decreased. These data were in favor of decreased insulin sensitivity on glucose metabolism in adipose tissue compared to muscle despite no measure-ments were done on glucose metabolism.
It has been suggested that acute overactivation of the mTORC1→S6K1 pathway by amino acids may alter early steps of insulin signaling and promote insulin resistance (Tremblay and Marette 2001; Tremblay et al. 2007a, b). The present study showed that chronic leucine supplementation did not induce a similar effect in skeletal muscle. Indeed, S6K1 phos-phorylation was similar in control and leucine-supplemented rats both in the basal state and after administration of the nutrient bolus, suggesting that chronic exposure to leucine excess has not induced sustained activation of S6K1. This correlated with similar (1) tyrosine phosphorylation of IRβ and IRS1, (2) serine phosphorylation of IRS1, and (3) PI3K activity in muscle from control and leucine-supplemented rats. Recently, Newgard et al. (2009) reported that chronic BCAA supplementation in young rats induced an elevation in mTOR/S6K1 phosphorylation in response to feeding but only when rats were fed a high-fat diet. Unlike in muscle, sustained leucine excess tended to induce activation of mTOR/S6K1 pathway in adipose tissue and inhibition of IRS/Akt pathway. Further studies are needed for a better comprehension of the
cross-talk between muscle and adipose tissue in a critical situation such as aging and to determine the optimum nutritional design to prevent age-related sarcopenia using dietary leucine (i.e., combination with exercise, other nutrients, or discontinuous supplemen-tation periods) without fat mass gain.
In summary, this study shows that long-term leucine supplementation in old rats does not improve skeletal muscle mass but induces a gain in fat mass, probably through initial orexigenic effects, stimulation of the mTOR pathway, and increased PPARγ expression in adipose tissue. Chronic leucine supplementation does not induce a sustained activation of the mTOR pathway in skeletal muscle, consistent with an absence of insulin signaling impairment and overall glucose tolerance. On the contrary, Akt phosphorylation of muscles from leucine-supplemented rats is more responsive to nutrient intake than in control rats and correlates with improved insulin-stimulated glucose transport.
Acknowledgments The authors thank Claire Sornet, Philippe Denis, Nordine Hafnaoui, and Hélène Lafarge for their technical participation and Christian Lafarge for animal care.
This work was supported by the Institut Benjamin Delessert, Paris, France; by INSERM, Université de Nice Sophia– Antipolis, and Conseil Général des Alpes-Maritimes.
References
Balage M, Dardevet D (2010) Long-term effects of leucine supplementation on body composition. Curr Opin Clin Nutr Metab Care 13:265–270
Balage M, Averous J, Remond D, Bos C, Pujos-Guillot E, Papet I, Mosoni L, Combaret L, Dardevet D (2010) Presence of low-grade inflammation impaired postprandial stimulation of muscle protein synthesis in old rats. J Nutr Biochem 21:325–331
Balage M, Dupont J, Mothe-Satney I, Tesseraud S, Mosoni L, Dardevet D (2011) Leucine supplementation in rats induced a delay in muscle IR/PI3K signaling pathway associated with overall impaired glucose tolerance. J Nutr Biochem 22:219–226
Bhaskar PT, Hay N (2007) The two TORCs and Akt. Dev Cell 12:487–502
Boirie Y (2009) Physiopathological mechanism of sarcopenia. J Nutr Health Aging 13:717–723
Boura-Halfon S, Zick Y (2009) Phosphorylation of IRS proteins, insulin action, and insulin resistance. Am J Physiol Endocrinol Metab 296:E581–E591
Cheng Y, Meng Q, Wang C, Li H, Huang Z, Chen S, Xiao F, Guo F (2010) Leucine deprivation decreases fat mass by stimulation of lipolysis in white adipose tissue and upregulation of uncoupling protein 1 (UCP1) in brown adipose tissue. Diabetes 59:17–25
Combaret L, Dardevet D, Rieu I, Pouch MN, Bechet D, Taillandier D, Grizard J, Attaix D (2005) A leucine-supplemented diet restores the defective postprandial inhibition of proteasome-dependent proteolysis in aged rat skeletal muscle. J Physiol 569:489–499
Cortez MY, Torgan CE, Brozinick JTJ, Ivy JL (1991) Insulin resistance of obese Zucker rats exercise trained at two different intensities. Am J Physiol Endocrinol Metab 261: E613–E619
Cota D, Proulx K, Smith KAB, Kozma SC, Thomas G, Woods SC, Seeley RJ (2006) Hypothalamic mTOR signaling regulates food intake. Science 312:927–930
Cuthbertson D, Smith K, Babraj J, Leese G, Waddell T, Atherton P, Wackerhage H, Taylor PM, Rennie MJ (2005) Anabolic signaling deficits underlie amino acid resistance of wasting, aging muscle. FASEB J 19:422–424
Dardevet D, Sornet C, Attaix D, Baracos VE, Grizard J (1994) Insulin-like growth factor-1 and insulin resistance in skeletal muscles of adult and old rats. Endocrinology 134:1475–1484
Dardevet D, Sornet C, Balage M, Grizard J (2000) Stimulation of in vitro rat muscle protein synthesis by leucine decreases with age. J Nutr 130:2630–2635
Dardevet D, Sornet C, Bayle G, Prugnaud J, Pouyet C, Grizard J (2002) Postprandial stimulation of muscle protein synthesis in old rats can be restored by a leucine-supplemented meal. J Nutr 132:95–100
Doi M, Yamaoka I, Fukunaga T, Nakayama M (2003) Isoleucine, a potent plasma glucose-lowering amino acid, stimulates glucose uptake in C2C12 myotubes. Biochem Biophys Res Commun 312:1111–1117
Doi M, Yamaoka I, Nakayama M, Mochizuki S, Sugahara K, Yoshizawa F (2005) Isoleucine, a blood glucose-lowering amino acid, increases glucose uptake in rat skeletal muscle in the absence of increases in AMP-activated protein kinase activity. J Nutr 135: 2103–2108
Doi M, Yamaoka I, Nakayama M, Sugahara K, Yoshizawa F (2007) Hypoglycemic effect of isoleucine involves increased muscle glucose uptake and whole body glucose oxidation and decreased hepatic gluconeogenesis. Am J Physiol Endocrinol Metab 292:E1683–E1693
Frick GP, Tai LR, Blinder L, Goodman HM (1981) L-Leucine activates branched chain alpha-keto acid dehydrogenase in rat adipose tissue. J Biol Chem 256:2618–2620
Jitomir J, Willoughby DS (2008) Leucine for retention of lean mass on a hypocaloric diet. J Med Food 11:606–609 Katsanos CS, Kobayashi H, Sheffield-Moore M, Aarsland A,
Wolfe RR (2005) Aging is associated with diminished accretion of muscle proteins after the ingestion of a small bolus of essential amino acids. Am J Clin Nutr 82:1065–1073
Katsanos CS, Kobayashi H, Sheffield-Moore M, Aarsland A, Wolfe RR (2006) A high proportion of leucine is required for optimal stimulation of the rate of muscle protein synthesis by essential amino acids in the elderly. Am J Physiol Endocrinol Metab 291:E381–E387
Kim JE, Chen J (2004) Regulation of peroxisome proliferator-activated receptor-gamma activity by mammalian target of
rapamycin and amino acids in adipogenesis. Diabetes 53:2748–2756
Kim JS, Wilson JM, Lee SR (2010) Dietary implications on mechanisms of sarcopenia: roles of protein, amino acids and antioxidants. J Nutr Biochem 21:1–13
Kleemann R, van Erk M, Verschuren L, van den Hoek AM, Koek M, Wielinga PY, Jie A, Pellis L, Bobeldijk-Pastorova I, Helder T, Toet K, Wopereis S, Cnubben N, Evelo C, van Ommen B, Kooistra T (2010) Time-resolved and tissue-specific systems analysis of pathogenesis of insulin resistance. PLoS ONE 5:e8817
Krauss RM, Mayer J (1965) Influence of protein and amino acids on food intake in the rat. Am J Physiol 209:479–483
Laviano A, Muscaritoli M, Cascino A, Preziosa I, Inui A, Mantovani G, Rossi-Fanelli F (2005) Branched-chain amino acids: the best compromise to achieve anabolism? Curr Opin Clin Nutr Metab Care 8:408–414
Layman DK (2003) The role of leucine in weight loss diets and glucose homeostasis. J Nutr 133:261S–267S
Layman DK, Walker DA (2006) Potential importance of leucine in treatment of obesity and the metabolic syndrome. J Nutr 136:319S–323S
Lonnqvist F, Nordfors L, Jansson M, Thorne A, Schalling M, Arner P (1997) Leptin secretion from adipose tissue in women. Relationship to plasma levels and gene expres-sion. J Clin Invest 99:2398–2404
Lynch CJ, Hutson SM, Patson BJ, Vaval A, Vary TC (2002a) Tissue-specific effects of chronic dietary leucine and norleucine supplementation on protein synthesis in rats. Am J Physiol Endocrinol Metab 283:E824–E835 Lynch CJ, Patson BJ, Anthony J, Vaval A, Jefferson LS, Vary
TC (2002b) Leucine is a direct-acting nutrient signal that regulates protein synthesis in adipose tissue. Am J Physiol Endocrinol Metab 283:E503–E513
Manders RJ, Wagenmakers AJ, Koopman R, Zorenc AH, Menheere PP, Schaper NC, Saris WH, van Loon LJ (2005) Co-ingestion of a protein hydrolysate and amino acid mixture with carbohydrate improves plasma glucose disposal in patients with type 2 diabetes. Am J Clin Nutr 82:76–83
Manders RJ, Koopman R, Sluijsmans WE, van den Berg R, Verbeek K, Saris WH, Wagenmakers AJ, van Loon LJ (2006) Co-ingestion of a protein hydrolysate with or without additional leucine effectively reduces postprandial blood glucose excursions in type 2 diabetic men. J Nutr 136:1294–1299
Marzani B, Balage M, Venien A, Astruc T, Papet I, Dardevet D, Mosoni L (2008) Antioxidant supplementation restores defective leucine stimulation of protein synthesis in skeletal muscle from old rats. J Nutr 138:2205–2211 Mosoni L, Valluy MC, Serrurier B, Prugnaud J, Obled C,
Guezennec CY, Patureau MP (1995) Altered response of protein synthesis to nutritional state and endurance training in old rats. Am J Physiol 268:E328–E335 Newgard CB, An J, Bain JR, Muehlbauer MJ, Stevens RD,
Lien LF, Haqq AM, Shah SH, Arlotto M, Slentz CA, Rochon J, Gallup D, Ilkayeva O, Wenner BR, Yancy WS Jr, Eisenson H, Musante G, Surwit RS, Millington DS, Butler MD, Svetkey LP (2009) A branched-chain amino acid-related metabolic signature that differentiates obese
and lean humans and contributes to insulin resistance. Cell Metab 9:311–326
Nishitani S, Matsumura T, Fujitani S, Sonaka I, Miura Y, Yagasaki K (2002) Leucine promotes glucose uptake in skeletal muscles of rats. Biochem Biophys Res Commun 299:693–696
Nishitani S, Takehana K, Fujitani S, Sonaka I (2005) Branched-chain amino acids improve glucose metabolism in rats with liver cirrhosis. Am J Physiol Gastrointest Liver Physiol 288:G1292–G1300
Odessey R, Goldberg AL (1972) Oxidation of leucine by rat skeletal muscle. Am J Physiol 223:1376–1383
Prod’homme M, Balage M, Debras E, Farges MC, Kimball S, Jefferson L, Grizard J (2005) Differential effects of insulin and dietary amino acids on muscle protein synthesis in adult and old rats. J Physiol 563:235–248
Reeves PG, Nielsen FH, Fahey GC (1993) AIN-93 purified diets for laboratory rodents: final report of the American Institute of Nutrition ad hoc writing committee on the reformulation of the AIN-76A rodent diet. J Nutr 123:1939–1951
Rieu I, Sornet C, Bayle G, Prugnaud J, Pouyet C, Balage M, Papet I, Grizard J, Dardevet D (2003) Leucine-supplemented meal feeding for ten days beneficially affects postprandial muscle protein synthesis in old rats. J Nutr 133:1198–1205
Rieu I, Balage M, Sornet C, Giraudet C, Pujos E, Grizard J, Mosoni L, Dardevet D (2006) Leucine supplementation improves muscle protein synthesis in elderly men independently of hyperaminoacidaemia. J Physiol 575:305–315
Rieu I, Balage M, Sornet C, Debras E, Ripes S, Rochon-Bonhomme C, Pouyet C, Grizard J, Dardevet D (2007) Increased availability of leucine with leucine-rich whey proteins improves postprandial muscle protein synthesis in aging rats. Nutrition 23:323–331
Rosenthal J, Angel A, Farkas J (1974) Metabolic fate of leucine: a significant sterol precursor in adipose tissue and muscle. Am J Physiol 226:411–418
She P, Reid TM, Bronson SK, Vary TC, Hajnal A, Lynch CJ, Hutson SM (2007) Disruption of BCATm in mice leads to increased energy expenditure associated with the activation of a futile protein turnover cycle. Cell Metab 6:181–194 Tremblay F, Marette A (2001) Amino acid and insulin signaling
via the mTOR/p70 S6 kinase pathway—a negative feedback mechanism leading to insulin resistance in skeletal muscle cells. J Biol Chem 276:38052–38060 Tremblay F, Brule S, Hee Um S, Li Y, Masuda K, Roden M,
Sun XJ, Krebs M, Polakiewicz RD, Thomas G, Marette A (2007a) Identification of IRS-1 Ser-1101 as a target of S6K1 in nutrient- and obesity-induced insulin resistance. Proc Natl Acad Sci USA 104:14056–14061
Tremblay F, Lavigne C, Jacques H, Marette A (2007b) Role of dietary proteins and amino acids in the pathogenesis of insulin resistance. Annu Rev Nutr 27:293–310
Um SH, D’Alessio D, Thomas G (2006) Nutrient overload, insulin resistance, and ribosomal protein S6 kinase 1, S6K1. Cell Metab 3:393–402
Vary TC, Lynch CJ (2007) Nutrient signaling components controlling protein synthesis in striated muscle. J Nutr 137:1835–1843
Verhoeven S, Vanschoonbeek K, Verdijk LB, Koopman R, Wkwh W, Dendale P, Van Loon LJC (2009) Long-term leucine supplementation does not increase muscle mass or strength in healthy elderly men. Am J Clin Nutr 89:1468–1475
Wang P, Mariman E, Renes J, Keijer J (2008) The secretory function of adipocytes in the physiology of white adipose tissue. J Cell Physiol 216:3–13
Yaspelkis BB, Singh MK, Krisan AD, Collins DE, Kwong CC, Bernard JR, Crain AM (2004) Chronic leptin treatment enhances insulin-stimulated glucose disposal in skeletal muscle of high-fat fed rodents. Life Sci 74:1801–1816 Zhang YY, Guo KY, Leblanc RE, Loh D, Schwartz GJ, Yu YH
(2007) Increasing dietary leucine intake reduces diet-induced obesity and improves glucose and cholesterol metabolism in mice via multi-mechanisms. Diabetes 56:1647–1654