Publisher’s version / Version de l'éditeur:
Conference Record of the 2010 IEEE International Symposium on Electrical
Insulation (ISEI), pp. 1-5, 2010-08-16
READ THESE TERMS AND CONDITIONS CAREFULLY BEFORE USING THIS WEBSITE. https://nrc-publications.canada.ca/eng/copyright
Vous avez des questions? Nous pouvons vous aider. Pour communiquer directement avec un auteur, consultez la première page de la revue dans laquelle son article a été publié afin de trouver ses coordonnées. Si vous n’arrivez pas à les repérer, communiquez avec nous à PublicationsArchive-ArchivesPublications@nrc-cnrc.gc.ca.
Questions? Contact the NRC Publications Archive team at
PublicationsArchive-ArchivesPublications@nrc-cnrc.gc.ca. If you wish to email the authors directly, please see the first page of the publication for their contact information.
NRC Publications Archive
Archives des publications du CNRC
This publication could be one of several versions: author’s original, accepted manuscript or the publisher’s version. / La version de cette publication peut être l’une des suivantes : la version prépublication de l’auteur, la version acceptée du manuscrit ou la version de l’éditeur.
For the publisher’s version, please access the DOI link below./ Pour consulter la version de l’éditeur, utilisez le lien DOI ci-dessous.
https://doi.org/10.1109/ELINSL.2010.5549836
Access and use of this website and the material on it are subject to the Terms and Conditions set forth at
Dielectric properties of polypropylene containing synthetic and natural
organoclays
Bulinski, A.; Bamji, S.S.; Abou-Dakka, M.; Chen, Y.
https://publications-cnrc.canada.ca/fra/droits
L’accès à ce site Web et l’utilisation de son contenu sont assujettis aux conditions présentées dans le site LISEZ CES CONDITIONS ATTENTIVEMENT AVANT D’UTILISER CE SITE WEB.
NRC Publications Record / Notice d'Archives des publications de CNRC:
https://nrc-publications.canada.ca/eng/view/object/?id=ae0c9ad4-dc96-40c9-931c-63101d70bed7 https://publications-cnrc.canada.ca/fra/voir/objet/?id=ae0c9ad4-dc96-40c9-931c-63101d70bed7
Dielectric Properties of Polypropylene Containing
Synthetic and Natural Organoclays
A. Bulinski, S.S. Bamji,
M. Abou-Dakka
and Y. Chen
Institute for National Measurement Standards National Research Council of Canada
Ottawa, Ontario, Canada, K1A 0R6
I. INTRODUCTION
Polypropylene (PP) is extensively used as a dielectric in power capacitors, cable wraps and layer and phase separators for rotating electrical equipment and transformers. It is also used with paper laminates as the insulation of transmission-class power cables. It has excellent mechanical, thermal and electrical properties and provides outstanding resistance to moisture, grease and oils [1].
A polymer such as polypropylene can be reinforced with small quantities of nano-sized particles to achieve not only better chemical, thermal and mechanical properties but also, as some of the recent published data suggest, to improve dielectric properties, such as electrical breakdown strength, surface and volume resistivity, space charge and polarization characteristics [2-4], resistance to partial discharges [5-8], etc.
Improvements in the dielectric strength would lead to less electrical insulation material for the same applied voltage and thus to significant cost savings for manufacturers and utilities [9]. Similarly, the improved thermal properties of the insulation would allow for a higher power transfer or power rating of the equipment. Materials with increased corona resistance could, in certain applications, tolerate the presence of partial discharges and in turn provide some cost savings by withstanding higher working electrical stresses.
The results reported in this paper are part of collaboration with the NRC Industrial Materials Institute to develop polypropylene-based nanocomposites for high voltage capacitor applications. PP film capacitors constitute a significant share of a $2.8 billion USD market for polymer capacitors [10]. This share could be increased with the improvement of film properties such as the maximum working temperature and/or the resistance to partial discharges.
Abstract -Fully synthetic tetrasilisic mica from Topy Co., Ltd. and
Cloisite powder of Wyoming natural montmorillonite clay from Southern Clay Products were used to manufacture polypropylene-based nanocomposites with organoclay concentrations up to 8%-wt. Both types of nano-filler increase the AC breakdown strength by approx. 10% over the unfilled material. However, the resistance to partial discharges is significantly improved, with both nano-fillers yielding similar results. Nano-nano-fillers increase dielectric losses of PP over broad frequency and temperature ranges. Specimens containing natural clay show higher losses than the specimens containing synthetic clay, especially at higher frequencies and temperatures.
®
II. EXPERIMENTAL
A. Nanocomposite Samples
An isotactic PP and two types of nano-filler: (1) the Topy synthetic tetrasilisic mica from Topy Co., Ltd. of Japan, pre-intercalated with di-methyl di-stearyl-ammonium chloride, and (2) Cloisite 20A natural montmorillonite clay from Wyoming, pre-intercalated with di-methyl di-hydrogenated tallow and manufactured by Southern Clay Products, were used to prepare PP-based nanocomposites with different contents of the clays. They are referred to in this paper as “PP+x% Topy” and “PP+y% Cloisite”, where x% indicates the percentage by weight content of the Topy organoclay and y% the percentage by weight content of the Cloisite 20A organoclay in PP, respectively. Unfilled polypropylene is marked throughout this paper as “PP”. The Cloisite 20A particles had a narrower distribution of length and width than the Topy particles. The individual platelets aspect ratios were 6000 and 286 for Topy and Cloisite 20A, respectively.
The manufacture of nanocomposites involved three steps: (1) preparation of the Master Batch (MB), (2) dilution of MB, and (3) preparation of films.
The base PP material was melt compounded with a 1:1 mixture of two compatibilizers [PP grafted with maleic anhydride (PP-MA) from Eastman (Epolene 3015) and from Chemtura (Polybond 3150)], antioxidant Irganox B-225 (from Ciba) and one of the organoclays. The compounding was carried out at 200°C under a blanket of dry nitrogen in a twin-screw extruder (TSE; Leistritz 34 mm, L/D = 40; high shear intensity screw, speed: 200 rpm, T = 200°C; throughput: 5 kg/h). The resulting composition for Topy-based MB was: 75.8-wt% PP + 0.2-wt% antioxidant + 16-wt% compatibilizers + 8-wt% of clay, and for Cloisite-based MB: 81.8-wt% PP + 0.2-wt% antioxidant
®
£ £
Step 1. Preparation of the Master Batch (MB)
Two types of organoclay were used in this work: synthetic tetrasilisic mica and Cloisite 20A with natural montmorillonite from Wyoming. Nanocomposites were based on PP, Profax HL-451H from Basell, and contained up to 8 wt% of clay. This communication summarizes the effect of adding an organoclay to a PP matrix on the AC breakdown strength, dissipation factor frequency and temperature characteristics, and the resistance to partial discharges.
®
+ 12-wt% compatilizer + 6-wt% of clay.
25 mm sphere-to-plane electrodes were used to apply a 60 Hz ac voltage at a rate of 400 V/s to specimens immersed in silicon oil. The diameter of the samples was ~90 mm, which allowed for obtaining up to six breakdown (bd) data points for each sample. All tests were conducted at room temperature. After each breakdown, the top ball bearing electrode was rotated to minimize the effect of electrode damage. The bottom electrode was made of a highly polished photographic plate that was replaced after testing three consecutive samples. Each value of the breakdown voltage was associated with a particular speci-men thickness measured exactly at the breakdown point, and the breakdown strength was determined by dividing the breakdown voltage by the insulation thickness. The breakdown data were analyzed using a two-parameter Weibull distribution of the ReliaSoft Weibull 7 software.
The PD withstand tests were performed in a test cell with Samples containing 0, 1, 2, 4 and 8-wt% of Topy and 0, 2 and 6-wt% of Cloisite 20A were prepared. To ascertain the same compounding history of the samples all samples were extruded at 180°C under a blanket of dry nitrogen, using the same TSE with the same processing parameters as used for both MBs. Thus, PP + antioxidant were extruded twice. The MBs obtained in Step 1 were re-extruded and the other compositions were prepared by first dry-blending pre-extruded PP with each MB at an appropriate ratio and then re-extruding the blend. The clay dispersion parameters for the Topy and Cloisite 20A-based samples were: (1) the interlayer spacing d : 3.45 for Topy and 2.8 ± 0.2 nm for Cloisite, (2) the number of platelets in the residual stacks N: 2.64 for Topy and 3.1 ± 0.2 for Cloisite, and (3) the degree of exfoliation EX: 88% for Topy and 50% for Cloisite.
The pelletized dried compositions obtained in step 2 were film blown at T = 180°C to 230°C into films with an approx. thickness of 135 ± 7 µm. Subsequently, the films were rolled twice at 115°C between 3-rolls in a Metaplast calender, to obtain the final samples for testing.
All specimens were prepared by the Industrial Materials Institute of NRC. Specimens with Cloisite 20A have also been used in a project within the VAMAS Technical Working Area 33 (TWA-33) working toward development of test methods for chemical, morphological, mechanical and electrical character-ization techniques for polymer nanocomposites [11]. VAMAS is an international organization, which supports world trade in products that depend on advanced materials technologies. It accomplishes this through collaborative projects that involve laboratories from different countries and which provide the technical basis for harmonizing measurement techniques, testing procedures, specifications, and standards. Step 2. Dilution of MB
Step 3. Preparation of films
001
~
++
C. Partial Discharge Withstand Tests B. AC Breakdown Tests
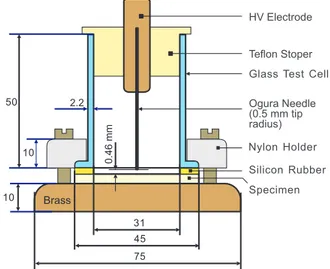
Fig. 1. Test cell for the time to breakdown tests under partial discharges (all dimensions in millimeters).
electrodes similar to the IEC Type B electrode system [8] (Fig. 1). It consists of needle-to-plane electrodes enclosed inside a glass cell to limit ozone permeation into the lab environment. The needle, with a radius of 0.5 mm, is raised 0.46 mm above the specimen surface. The time to breakdown tests were carried out at voltages between 7.6 and 10.5 kV. To account for the specimen thickness variations, all times to breakdown were adjusted in the calculations to a thickness of 130 µm.
D. Dielectric Loss Measurements
A. AC Breakdown Tests
The measurements were performed in a three-electrode system (measuring electrode: 50 mm in diameter) using a Tettex 2914 test cell with a 2966 temperature controller. The measurements were conducted between 30°C and 150°C at increments of 10°C. The temperature variation at each measurement step was less than 0.5°C.
The measurements were performed with two instruments, each covering a different frequency range: (1) AH 2700A Andeen Hagerling Ultra-precision Capacitance Bridge - frequencies between 50 Hz and 20 kHz, and (2) IDAX 206 Insulation Diagnostic Analyzer by PAX Diagnostics - frequencies between 0.01 Hz and 1 kHz. The A&H Bridge was operated at 15 V and the IDAX analyzer at 140 V .
III. R
The breakdown test results are summarized in Figs. 2 and 3. The values of the breakdown strength were obtained using Mason's formula [12], which takes into account the fact that short term breakdowns of low loss polymers immersed in oil are caused by surface discharges in oil. The calculated breakdown strengths are larger than the usually reported average bd strengths (i.e. bd voltage/specimen thickness), as they account for the enhancement of electric field at the point where the discharge in oil strikes the specimen surface prior to breakdown. They were shown to better fit to the Weibull distribution than the average bd strengths [13], which suggested they better represent the physical nature of the breakdown process. The calculated values are closer to the intrinsic breakdown strength reported for
rms rms
ESULTS AND DISCUSSION
Glass Test Cell
Nylon Holder 10 31 Ogura Needle (0.5 mm tip radius) Teflon Stoper 10 2.2 45 75 Silicon Rubber Specimen 0.46 mm 50 HV Electrode Brass
0.2 0.1 2 20 70 90 98 99.9 50 30 10 5 1 0.5 W
eibull Cumulative Bd Probability
, % 120 150 200 250 Breakdown Strenght (kV/mm) 150 200 250 300 PP+6% Cloisite PP PP+2% Cloisite 63.2 PP+6% Topy PP PP+2% Topy 120
Fig. 2. Distributions of the ac ramp voltage breakdown strengths in Weibull graphs. The values of the bd strength were calculated
using Mason's formula [12].
200 220 240 260 280 AC Breakdown Strength, kV/mm PP PP+2% T opy PP+2% Cloisite PP+8% T opy PP+6% Cloisite
Fig. 3. The effect of the nano-filler type and concentration on the median value (50% bd probability) of ac breakdown strength.
B. Time to Breakdown Tests under Partial Discharges
Fig. 4 shows the time to breakdown distributions for unfilled PP at four different voltage levels. All test voltages were higher than the PD inception voltage, which was around 2.4 kV. Fig. 5 compares performance of an unfilled material with nanocomposites containing 2%-wt content of the clays. Table 1 summarizes the results shown in Fig. 5.
Fig. 4. Times to bd distributions of unfilled PP subjected to partial discharges in a test cell from Fig. 1.
0.2 2 20 70 90 98 99.9 50 30 10 5 1 0.5 W
eibull Cumulative Failure Probability
, % Time to Breakdown, s 10-1 100 101 102 103 104 105 10 h 1 h 1 min
PP [14] than the average values.
There is a moderate, ~10% increase of the ac bd strength with the addition of 2%-wt of either Topy or Cloisite 20A nano-filler. Further increase of the concentration of the fillers produces only a slight improvement of the bd strength. The effect of a much purer, synthetic nano-filler was comparable to that of the natural clay that is known to contain impurities, chemical notably iron and particulate minerals such as quartz, dolomite and gypsum. Filler particles of a micrometer size have long been used in polymers to improve their mechanical properties, thermal stability, tracking resistance, etc. However, their use almost always leads to significant reduction of insulation breakdown strength. The fact that nano-fillers do not do this has an impor-tant practical advantage. It also indicates a different type of interaction between nanometer-sized particles and the polymer matrix, as compared with the micrometer-sized particles. Significantly larger surface areas of nano-fillers as compared with micro-fillers of the same percentage content by weight is now widely accepted to be responsible for this [15].
0.2 0.1 2 20 70 90 98 99.9 50 30 10 5 1 0.5 W
eibull Cumulative Failure Probability
, % Time to Breakdown, s 10-1 100 101 102 103 104 105 106 10 h 1 h 1 min 100 h 63.2
Fig. 5. Times to breakdown distributions under PDs at 9.7 kV showing the effect of two types of nano-filler at a 2%-wt concentration.
Parameter PP PP+2% Topy PP+2% Cloisite
b 2.351 3.752 1.273 a (h) 0.036 18.39 17.23 Mean (h) 0.032 16.60 15.45 Median (50%) (h) 0.031 16.67 13.70 10% Percentile (h) 0.014 10.09 4.22 F(t ) = 1 - exp -bd for x³0 tbd a b
)
)
2-parameter Weibull distribution:TABLE I
PARAMETERS OF TIME TO BREAKDOWN DISTRIBUTIONS FOR UNFILLED PP AND TWO TYPES OF NANOCOMPOSITES SUBJECTED TO PARTIAL DISCHARGES AT 9.7 KV.
63.2 63.2 PP PP+2% Topy PP+2% Cloisite 9.7 kV 10.5 kV 7.6 kV 8.6 kV
Fig. 6. Dissipation factor, tan , frequency characteristics of PP-based nanocomposites at different temperatures.d
Dissipation Factor tan
d 10-5 10-4 10-3 10-2 10-1 100 Frequency (Hz) 10-2 10-1 100 101 102 103 104 30°C PP PP+2% Topy PP+8% Topy PP+2% Cloisite PP+6% Cloisite (a)
Dissipation Factor tan
d 10-5 10-4 10-3 10-2 10-1 100 Frequency (Hz) 10-2 10-1 100 101 102 103 104 60°C (b) PP PP+2% Topy PP+8% Topy PP+2% Cloisite PP+6% Cloisite
Dissipation Factor tan
d 10-5 10-4 10-3 10-2 10-1 100 Frequency (Hz) 10-2 10-1 100 101 102 103 104 90°C (c) PP PP+2% Topy PP+8% Topy PP+2% Cloisite PP+6% Cloisite
Dissipation Factor tan
d 10-5 10-4 10-3 10-2 10-1 100 Frequency (Hz) 10-2 10-1 100 101 102 103 104 120°C (d) PP PP+2% Topy PP+8% Topy PP+2% Cloisite PP+6% Cloisite
Adding either of the nano-fillers to PP significantly improves its resistance to partial discharges. This result is consistent with other authors' findings that the depth of erosion of PP-based nanocomposites subjected to PD is smaller than in unfilled PP [8]. Times to bd of Cloisite 20A-containing specimens were considerably more scattered than those for Topy specimens, which indicates a better uniformity of the latter. Since Topy fluoromica is less hydrophilic and therfore better miscible with hydrophobic PP than Cloisite 20A organoclay, it can be better dispersed in PP. This allows for the manufacturing more uniform specimens. The ability to manufacture more uniform nanocomposites using fully synthetic clay has important practical significance. Tests with different voltages (PD intensity) and other clay concentrations are continuing.
Figs 6a to 6d show dissipation factors for various nanocomposites and unfilled PP as a function of frequency at four different temperatures. The measurements at a given temperature were conducted in practically isothermal conditions with a temperature variation of less than 0.5°C.
At all temperatures above 10 Hz, the dissipation factor of nanocomposites is at least two orders of magnitude larger than
C. Dielectric Loss Spectra
the dissipation factor of PP. For the same particle concentration, dielectric losses of Cloisite 20A-based nanocomposites are almost an order of the magnitude higher than those of Topy-based. For both types of nanocomposites the increase of particle content increases dielectric losses. At 90°C and 120°C and below ~1 Hz the losses of all materials, including unfilled PP, are similar. This could probably be attributed to the presence of maleated compatibilizer, which could be hydrolyzed into bi-acids, which are ionic. In Figs 6b - 6d the values of tan show broad peaks for all four nanocomposites, which are not present in PP. These are most likely caused by charge trapping at the interfaces between clay particles and the polymer.
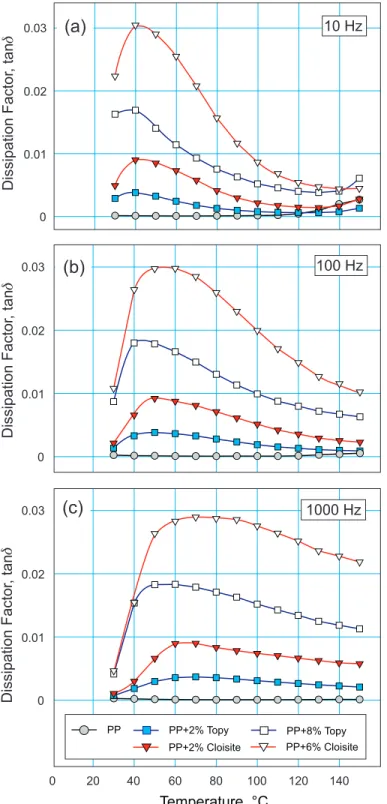
Variations of tan with temperature at 10 Hz, 100 Hz and 1000 Hz are shown in Fig. 7a to 7c.
The presence of nano-fillers increases dielectric losses that, depending on the filler type and frequency, reach their maxima between 40°C and 80°C. Across the whole temperature range the losses are larger in the Cloisite 20A-based materials and the difference between the two increases with the applied frequency, especially at higher temperatures.
It indicates that for higher frequencies and/or temperatures, nanocomposites based on synthetic organoclay would have a distinct advantage over nanocomposites using natural clay.
d
IV. C
Synthetic tetrasilisic mica by Topy Co., Ltd. and Cloisite 20A powder of natural montmorillonite clay from Southern Clay Products were used to manufacture PP-based nanocomposites with nano-filler concentrations up to 8%-wt.
ONCLUSIONS
®
Fig. 7. Temperature dependence of tan of PP-based nanocomposites at selected frequencies.
d
REFERENCES
[1] W.T. Shugg, “Handbook of Electrical and Electronic Insulating Materials”, IEEE Press, ISBN 0-7803-1030-6, 1995.
[2] M. Roy, J.K. Nelson, R.K. MacCrone and L.S. Schadler, “Candidate Mechanisms Controlling the Electrical Characteristics of Silica/XLPE Nanodielectrics”, J. Mater. Sci. Vol. 42, pp. 3789-3799, 2007.
[3] C.D. Green, A.S. Vaughan, G.R. Mitchell and T. Liu, “Structure Property Relationship in Polyethylene/Montmorillonite Nanodielectrics”, IEEE Trans. Dielectrics Elect. Insul., Vol. 15, pp. 134-143, 2008
[4] T. Tanaka, G.C. Montanari, and R. Mülhaupt, “Polymer Nanocomposites as Dielectrics and Electrical Insulation – Perspectives for Processing Technologies, Material Characterization and Future Applications”, IEEE Trans. Dielectrics Elect. Insul., Vol. 11, pp. 763-784, 2004.
[5] J.K. Nelson, Y. Hu, “Nanocomposite Dielectrics – Properties and Implications”, J. Phys. D: Appl. Phys., Vol. 38, pp. 213-222, 2005. [6] N. Fuze, Y. Ohki, M. Kozako and T. Tanaka, “Possible Mechanisms of
Superior Resistance of Polyamide Nanocomposites to Partial Discharges and Plasmas”, IEEE Trans. Dielectrics Elect. Insul., Vol. 15, pp. 161-169, 2008.
[7] M. Takala, M. Karttunen, P. Salovaara, S. Kortet, K. Kannus and T. Kalliohaka, “Dielectric Properties of Nanostructured Polypropylene-Polyhedral Oligomeric Silsesquioxane Compounds”, IEEE Trans. Dielectrics Elect. Insul., Vol. 15, pp. 40-51, 2008.
[8] T. Tanaka, “Interface Properties and Surface Erosion Resistance”, in “Dielectric Polymer Nanocomposites”, Springer Science and Business Media, LLC 2010, ISBN 978-1-4419-1590-0, K. Nelson Editor, pp. 229-258.
[9] E. Tuncer and I. Sauers, “Industrial Application Perspective for Nanodielectrics”, in “Dielectric Polymer Nanocomposites”, Springer Science and Business Media, LLC 2010, ISBN 978-1-4419-1590-0, K. Nelson Editor, pp. 321-338.
[10] Qi Tan, P. Irwin and Y. Cao, “Advances Dielectrics for Capacitors”, IEEJ Trans. FM, Vol. 126, No. 11, pp. 1153-1159, 2006.
[11] (http://www.vamas.org/twa33/index.html)
[12] J. Mason, “Effects of Thickness and Area on the Electric Strength of Polymers”, IEEE Trans. Elect. Insul., Vol. 26, No. 2, pp. 318-322, 1991. [13] A. Bulinski, S. Bamji, M. Abou Dakka and Y. Chen, “Dielectric Properties
of Polypropylene Loaded with Synthetic Organoclay”, 2009 CEIDP Annual Report.
[14] J.J. McKeown, “Intrinsic Electric Strengths of Organic Polymeric Materials”, Proc. IEE, Vol. 112, No. 4, pp. 824-828, 1965
[15] K. Nelson, “Background, Principles and Promise of Nanodielectrics”, in “Dielectric Polymer Nanocomposites”, Springer Science and Business Media, LLC 2010, ISBN 978-1-4419-1590-0, K. Nelson Editor, pp. 1-30. The short-term AC breakdown strength of nanocomposites is slightly higher (~10%) as compared with the base polymer. The type of filler does not have any significant effect.
The resistance to partial discharges is significantly improved by the presence of both the synthetic and natural clays. Specimens based on synthetic clay showed a narrower distribu-tion of the times to breakdown under partial discharges than the specimens containing natural clay. This may reflect better purity and a more uniform distribution of synthetic clay in PP.
Nano-fillers increase dielectric losses of PP over broad frequency and temperature ranges. Specimens containing natural clay show higher losses than the specimens containing synthetic clay, especially at higher frequencies and temperatures.
A
The authors wish to thank Dr. L. A. Utracki of the Industrial Materials Institute of NRC Canada for providing nano-composite specimens for this work and for his insightful comments regarding the content of this communication.
CKNOWLEGEMENTS Dissipation Factor , tan d 0.03 0.02 0.01 0 10 Hz Dissipation Factor , tan d 0.03 0.02 0.01 0 0 20 40 60 80 100 120 140 1000 Hz