Biomechanics of Cervical Function in Pregnancy
-Case of Cervical Insufficiency
by
Anastassia P. Paskaleva
Submitted to the Department of Mechanical Engineering
in partial fulfillment of the requirements for the degree of
Doctor of Philosophy in Mechanical Engineering
at the
MASSACHUSETTS INSTITUTE OF TECHNOLOGY
'August 2007
©
2007 Massachusetts Institute of Technology. All Rights Reserved
The author hereby grants to Massachusetts Institute of Technology permission to
reproduce and
to distribute copies of this thesis document in whole or in part.
Signature of Author ...
.
.
...
.. ...
Department of Mechanical Engineering
/I ,,27 August 2007
C ertified by ... /... ..4 ...
Simona Socrate
Assistant professor of Mechanical Engineering
Thesis Supervisor
Accepted by...
...
Lallit Anand
MASsACHUSETTS I y Professor of Mechanical Engineering
OF TEO NOLOGY
Chairman, Department Committee on Graduate Students
Biomechanics of Cervical Function in Pregnancy
-Case of Cervical Insufficiency
by
Anastassia P. Paskaleva
Submitted to the Department of Mechanical Engineering on 27 August 2007, in partial fulfillment of the
requirements for the degree of
Doctor of Philosophy in Mechanical Engineering
Abstract
The uterine cervix is a passive organ in the female body. Its normal function in pregnancy is to stay firm and closed for the duration of the gestation. At term, under the action of coordinated contractions from the myometrium the cervix dilates sufficiently to allow for the delivery of the fetus. Cervical insufficiency refers to a condition in which the cervix dilates asymptomatically
and painlessly in the absence of contractions from the uterine smooth muscle and results in a spontaneous pregnancy loss between the second and third trimester of pregnancy. An elusive and often misdiagnosed condition, cervical insufficiency accounts for a significant percentage of extremely premature deliveries with high incidence of infant mortality and morbidity. Accurate diagnostic criteria and treatment guidelines for this condition are not established and remain a clinical and research challenge. In an attempt to better understand the biomechanics of cervical insufficiency, a fully three-dimensional constitutive model for the large strain, time dependent mechanical behavior of the cervical stroma is proposed.
The constitutive model is implemented numerically and integrated with a three dimensional solid model of the lower pelvic region of a pregnant patient into a finite element framework. The resulting finite element model provides a tool to study the effects of different clinical features on the biomechanics of the pregnant cervix and uterus, and allows to investigate the conditions that lead to a premature dilation in the case of cervical insufficiency.
New findings on the mechanical behavior of the stroma emphasize the complexity of the stress-strain and volume change behavior of the stroma as well as the intricate correlation between the two. The challenges involved in prescribing a constitutive behavior for the cervical tissue include characteristics such as nonlinearity, viscoelasticity, anisotropy, inhomogeneity and preconditioning. Additionally, the tissue behavior exhibits marked differences in tension and compression with associated stress levels differing more than an order of magnitude between the different modes of deformation.
A new constitutive framework capable of capturing the complexity of tissue behavior is proposed and material properties in compression are obtained by fitting finite element model simulations to experimental data. The model is further extended to incorporate effects of anisotropy of the cervical stroma. Suitable choice of the levels of tissue anisotropy is shown to accommodate the differences between the mechanical behavior in tension and compression.
Thesis Supervisor: Simona Socrate
Acknowledgements
First I would like to express my deepest gratitude to my advisor Professor Simona Socrate for all the support and guidance throughout the years and for being an amazing friend. I am indebted to her for her incredible advice, constant encouragement, boundless enthusiasm, and gargantuan patience. I would always cherish the warmest memories of the times we spent working together side by side and all the wonderful discussions we had.
I also want to thank my committee members, Professors Lorna Gibson, Subra Suresh, and Michael House for their support and very helpful advice during my years at MIT. I would especially like to thank Professor Michael House for his invaluable help with the creation of the
solid model of the pregnant lady and his constant enthusiasm and motivation.
To my colleagues, Sebastien Febvay and Kristin Myers, goes my most sincere gratitude for all their help, constant support, and dear friendship. To Kristin, with whom I shared every moment of my PhD experience: without you the years at MIT would have never been such an
amazing period in my life.
I am also very grateful to my office mates and friends Asha Balakrishnan, Petch Jearanaisi-lawong, Timothy Johnson, Jamie Kofoid, Bruce Wu, and Thibault Prevost who made my time at MIT a brighter experience. To Nici Ames, who shared the quals experience with me: thank you for being a great friend and the best study buddy ever.
To my amazing friends, Sebastian Pokutta, Daniela Tzvetkova, Mariana Markova, Shelly Levy-Tzedek, Melis Arslan, Mats Danielsson, and all the other great people who supported me and motivated me through the years: thank you for believing in me. I am the luckiest person to have you by my side.
Finally, my utmost gratitude goes to my lovely family. Mom, Dad, Tutty, and Alex, thank you for being the most loving, understanding, and supporting family on Earth. Thank you for your unquestionable belief in me, constant sacrifice and deepest love. To you I owe everything.
Contents
1 Cervical Insufficiency 25
1.1 Introduction . . . 25
1.2 Definition and Diagnosis . . . 27
1.3 Risk Factors . . . 31
1.3.1 Loading Conditions on the Structure of the Cervix and the Uterus in Pregnancy . . . 31
1.3.2 Anatomical Risk Factors . . . 35
1.3.3 Consistency of the Cervical Stroma (Mechanical Properties) . . . 37
1.3.4 Conclusions . . . 38
1.4 Preventive Methods and Treatment . . . 38
1.4.1 Surgical Procedures . . . 39
1.4.2 Non-Surgical Procedures . . . 43
1.5 Conclusions . . . 43
2 Biochemical Composition of the Cervical Tissue 44 2.1 Introduction: The Extracellular Matrix (ECM) . . . 44
2.2 Collagen . . . 45
2.3 Proteoglycans and Glycosaminoglycans . . . 48
2.4 Elastin . . . 49
2.5 Fetal Fibronectin . . . 50
2.6 Cervical maturation . . . 51
2.8 Simplified and Idealized Model for Human Cervical Stroma . . .
3 Mechanical Properties of the Cervical Tissue
3.1 Overview of the Mechanical Properties of the Human Cervix
3.2 Experimental Behavior of the Cervical Tissue: A Comprehensive chemical Composition and Mechanical Properties . . . .
3.3 Variability in the Tissue Response . . . . 3.4 Preconditioning . . . .
3.5 Tension vs Compression . . . .
3.6 Pregnant vs Nonpregnant . . . .
. . . 57
Study
Biomechanics of the Cervical Function: Healthy vs Insufficient Introduction . . . .
Gross Characterization of the Cervix and the Uterus in Pregnancy . . .
of
Bio-Stroma
4.3 Construction of an Idealized 3-D Solid Geometry of the Abdominal and Lower Pelvic Region of a Pregnant Patient .
4.3.1 Anatomical Features . . . . 4.3.2 Mechanical Support . . . . 4.3.3 Loading Conditions . . . .
4.4 Preliminary Constitutive Model for the 4.4.1 Collagen Network . . . .
4.4.2 Glycosaminoglycan Network. . 4.4.3 Interstitial Fluid Flow . . . . . 4.5 Growth of the Cervix and the Uterus . 4.5.1 Kinematics . . . . 4.5.2 Rate Quantities . . . . 4.5.3 Results: Growth of the Healthy 4.6 Biomechanics of Funneling . . . . 4.6.1 Constitutive Prescription of Fun 4.6.2 Results: Funneling of the Insuffi
Mechanical Behavior .ne.n... ciet.Crvi... . . . . .. . . . cient Cervix . . . . . of the Cervix
Uterus
. .
.
4.7 Contractions . . . . 4 The 4.1 4.2 59 59 63 72 73 73 74 83 83 85 86 89 91 92 93 94 96 97 98 99 100 102 108 109 111 1154.7.1 Results: Contraction of the Uterus and the Progress of Cervical Dilation . 115 4.8 Axisymmetric vs 3-D Geometry . . . .
4.9 Funneling Revisited . . . .
4.10 Cerclage . . . . 4.11 Anatomical Variables . . . . 4.11.1 Effect of the Diameter of the Endocervical 4.11.2 Effect of Cervical Length . . . . 4.11.3 Effect of Membrane Adhesion . . . . 4.12 Conclusions . . . . Canal . . . 119 . . . 125 . . . 125 . . . 127 . . . 127 . . . 128 . . . 128 . . . 129
Constitutive Modeling of the Cervical Tissue During Pregnancy 5.1 Introduction . . . . 5.2 Review of Existing Models for Human Cervical Tissue . . . . 5.3 Constitutive Modeling of the Cervical Stroma . . . . 5.4 Different PGs Compartments . . . . 5.5 GAG Response . . . . 5.6 Collagen Response . . . . 5.6.1 Collagen Network Response . . . . 5.6.2 Transient Tissue Response . . . . 5.7 Pregnant Cervical Tissue . . . . 5.7.1 Viscous Stress in the Collagen Network . . . . 5.7.2 Backstress in the Collagen Network . . . . 5.8 E lastin . . . . 5.9 Interstitial Fluid Flow . . . . 5.10 Numerical Implementation of the Isotropic Constitutive Model for ti Strom a . . . . 5.10.1 Fit of the Simulation to Experimental Data in Compression . 5.10.2 Sensitivity of the Parameters . . . . 5.10.3 Tension and Compression . . . . e 5.11 Anisotropy of the Tissue . . . . 5.11.1 Force-Stretch Behavior for a Single Collagen Fiber . . . 185
5 137 137 138 141 143 147 150 151 158 161 163 165 165 166 168 168 173 176 184 Cervical
5.11.2 Representative Unit Cell . . . 185 5.11.3 Homogenization of the Unit Cell into a 3-D Continuum Constitutive Model186
5.11.4 Numerical Implementation of the Anisotropic Constitutive Model for Cer-vical Tissue Behavior . . . 187
6 Conclusions and Recommendations for Future Work 193
6.1 Concluding Remarks . . . 193
6.2 Recommendations for Future Work . . . 194
A Derivations 196
A.1 Jacobian Relationship . . . 196 A.2 Deformation Gradient Relationship . . . 197 A.3 Macroscopic Hydrostatic Stress . . . 198
List of Figures
1-1 Anatomical environment around the cervix and the uterus in pregnancy. Modi-fied from "Sobotta Atlas of Human Anatomy" [76]. . . . 26 1-2 Healthy cervix during gestation. (A) Closed cervix. (B) Effaced cervix at term.
Published with permissions, Copyright Krames/Stay Well. . . . 26
1-3 Fetal membranes prolapsing into the endocervical canal of the insufficient cervix. 28 1-4 T, Y, V, U progression of the cervical dilation in the case of insufficiency. From
www.thefetus.net with permission. . . . 28
1-5 Relative risk of premature delivery before 35 weeks and distribution of subjects versus cervical length percentile as estimated via means of transvaginal ultra-sonography at 24 weeks of gestation. Reproduced by Iams et al [46]. . . . 31
1-6 Transvaginal sonography at 24 weeks' gestation. (A) Closed cervicla canal in the absence of transfundal pressure. (B) Breaking of the cervix at the site of the internal os of the same patient as a result of application of transfundal pressure. Reproduced from MacDonald et al [58]. . . . 32 1-7 (A) Length of cervix at the time of onset of cervical change and prior to clinical
intervention without the aplication of fundal pressure. (B) Length of cervix at the time of onset of cervical change and prior to clinical intervention with the aplication of fundal pressure. Reproduced from MacDonald et al [58]. . . . 33 1-8 Transvaginal ultrasound images of the uterine cervix. (A) Pre-contraction. (B)
At the peak of contraction. Reproduced from Saito [82]. . . . 35
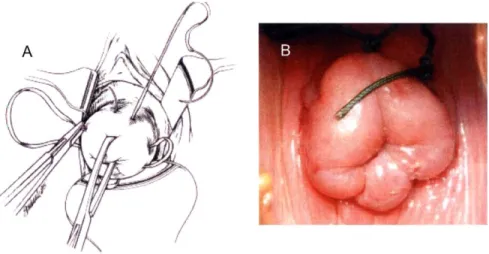
1-9 Transvaginal cerclage. (A) Schematic of the procedure. Modified from "Netter
2-1 Idealized representation of the composition of the human cervical stroma. . . . . 45 2-2 The collagen triple helix. (A) (left) Polypeptide segment with a Gly-X-Y amino
acid sequence. (center) Each chain is twisted into a left-handed helix and all three chains wrap around each other to form a right-handed triple helix. (right)
A schematic representation of the triple helical structure. (B) A cross-sectional
view of the triple helical structure showing the center of the triple helix occupied
by the small glycine residues. Reproduced from "Molecular Cell Biology" by
Lodish et al [55]. . . . 46 2-3 Fibril assembly and crosslinking. After secretion from the Golgi apparatus the
trimers are assembled into fibrils and are covalently cross-linked. The 64-nm staggering of the trimers give the collagen its striated appearance on electron m icrographs. . . . 47
2-4 Decorin proteoglycan with core protein and dermatan sulfate GAGs with mole-cular weigth 90-140 kDa. . . . 49
2-5 The elastic fiber network. (A) The loose network of cross-linked elastin fibrils (B) Uniaxial extension of the elastic fibers. . . . 51 2-6 Schematic of the collagen orientation in the human cervical tissue as observed
from X-ray diffraction [5]. . . . 56 2-7 Fractional anisotropy map of a transverse section of the nonpregnant cervix.
Color code for the main diffusion vector: red: in the left-right direction; green: top-down direction; blue: through-plane direction. OCL = outer circular layer. M odified from W eiss et al [88. . . . 57 3-1 Stress-strain relationships for human cervical tissue. (A) Comparison between
non-pregnant and pregnant specimens. (B) Nonpregnant specimens from the same patient tested at the site of the internal os at various radial distances from the endocervical canal. Reproduced from Conrad et al [21]. . . . 62
3-2 Siffness parameter q; calculated by Mazza et al [61] for tests performed in- and ex-vivo. Reproduced by Mazza et al [61]. . . . 63
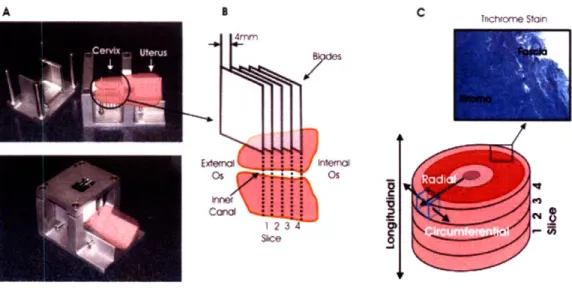
3-3 Compression specimen preparation. (A) Custom made slicing device for ex-vivio excision of circular specimen slices. (B) Core punch for excising cylindrical specimens from the slices. (C) Zwick universal testing machine. (D) Specimen dim ensions. . . . 64 3-4 Specimen preparation. (A) Custom made stainless steel slicing device with the
positioning of the organ. (B) Numbering of the tissue slices relative to the cervical anatomy. (C) Schematic of the cervix with the orientation convention and a micrograph of the stroma and the fascia of the tissue. . . . 65
3-5 Specimen geometry for the experimental tests. (A) Specimen compression
geom-etry. (B) Testing setup for compression. (C) Specimen tension geomgeom-etry. (D) Testing setup for tension. . . . 66
3-6 Response of the cervical stroma to load-unload cycles in unconfined
compres-sion. (A) Differences between non-pregnant specimens-with (NPPD) or without
(NPND) previous vaginal deliveries and pregnant specimens (PCS). (B)
Differ-ences between different equiliration times for specimens collected from the same cervical slice. . . . 67
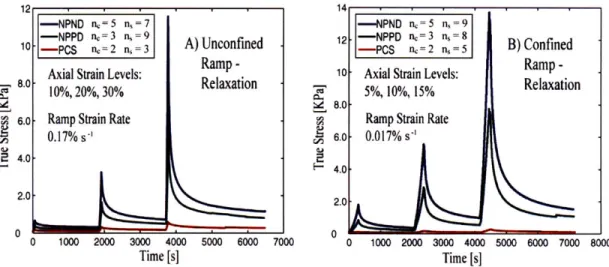
3-7 Response of the cervical stroma to ramp-relaxation compression tests. (A)
Un-confined compression test. (B) Confined compression test. . . . 69
3-8 Experimental results from uniaxial extension load-unload test. Between cycles,
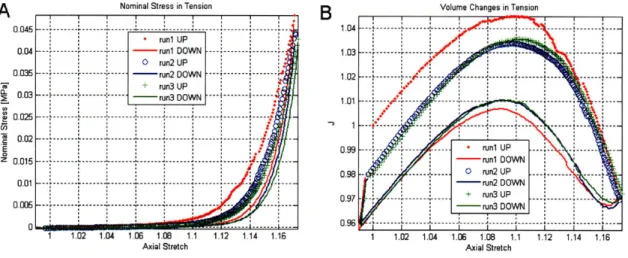
the unloaded specimens were equilibrated for 30 min in PBS. (A) Results col-lected for 3 specimens from 3 patients with different obstetrics background. (B) Experimental response of cervical stroma for 2 specimens from a single pregnant patient. Specimen 1 was excised close to the external OS and specimen 2 was excised close to the internal OS. . . . 70 3-9 Comparison between the tension and the compression results. (A) Load-unload
unconfined compression test. (B) Stress-relaxation test in unconfined compres-sion . . . . 71
3-10 (A) Specimen preparation of compression cubes and tension strips. (B)
Anatom-ical directions of the cervix. Multiple samples are cut along the radial direction to capture different fiber orientations. (C) Collagen fiber orientation. Circles indicate fibers in the circumferential direction (out of plane). . . . . 72 3-11 Compression data for three load-unload cycles to -45% true axial strain applied
in the circumferential direction for non-pregnant patient Feb 16. (A) Nominal stress vs axial stretch [Mpa]. (B) Volume changes vs axial stretch. . . . 73
3-12 Compression data for three load-unload cycles to -30% true axial strain applied
in the circumferential direction for nonpregnant patient Mar 1. (A) Nominal stress vs axial stretch [Mpa]. (B) Volume changes vs axial stretch. . . . 74
3-13 Compression data for three load-unload cycles to -45% true axial strain applied
in the circumferential direction for non-pregnant patient Mar 15. (A) Nominal stress vs axial stretch [Mpa]. (B) Volume changes vs axial stretch. . . . 75 3-14 Compression data for a stress-relaxation test to -45% true axial strain applied
in the circumferential direction for non-pregnant patient Feb 16. (A) Nominal stress vs time [Mpa]. (B) Volume changes vs time. . . . 76
3-15 Compression data for a stress-relaxation test to -30% true axial strain applied in
the circumferential direction for nonpregnant patient Mar 1. (A) Nominal stress vs time [MpaI. (B) Volume changes vs time. . . . 77
3-16 Compression data for a stress-relaxation test to -45% true axial strain applied
in the circumferential direction for non-pregnant patient Mar 15. (A) Nominal stress vs time
{Mpa].
(B) Volume changes vs time. . . . 783-17 Tension data for three load-unload cycles to 15% applied axial strain (measured 17% true axial strain) for patient Feb 16. (A) Nominal stress vs axial stretch
[Mpa]. (B) Volume changes vs axial stretch. . . . . 79 3-18 Combined tension and compression data for three load-unload cycles in tension
to 15% applied axial strain and three load-unload cycles in compression to -45% applied axial strain for patient Feb 16. (A) Nominal stress vs axial stretch [Mpa]. (B) Volume changes vs axial stretch. . . . 80
3-19 Tension data for three load-unload cycles to 3 levels of applied strain (15%, 20%
and 25%) for patient Mar 1. (A) Nominal stress vs axial stretch [Mpa]. (B) Volume changes vs axial stretch. . . . 80
3-20 Combined tension and compression data for three load-unload cycles in tension
to 15%, 20% and 25% applied axial strain and three load-unload cycles in com-pression to -35% applied axial strain for patient Mar 1. (A) Nominal stress vs axial stretch [Mpa]. (B) Volume changes vs axial stretch. . . . 81
3-21 Magnification of the small stress regime for the combined tension and
compres-sion data for three load-unload cycles in tencompres-sion to 15%, 20% and 25% applied axial strain and three load-unload cycles to -35% applied axial strain in the circumferential direction in compression for patient Mar 1. . . . 81
3-22 Compression data for three load-unload cycles to -45% true axial strain applied
in the circumferential direction for non-pregnant patient Feb 16. Left: schematic represantation of the different deformation stages; Right: Nominal stress [MPa] vs axial stretch and volume changes vs axial stretch with the identified regions of the mechanical response. . . . 82 4-1 Ultrasound imaging of pregnancy. (A) Saggital, midline view of the cervix at 21
weeks of gestation. (B) The same view with structures identified with a color code: yellow - cervical stroma; red - cervical mucosa. . . . . 84 4-2 Sagittal ultrasound image showing the cervix, part of the uterus, the border
between the mucosa and the stroma of the cervix and the following angles: 1) Cervical canal -cranio-caudal axis, 2) cervical canal -posterior uterus; 3) Cervical canal -anterior uterus. Copyright Dr. House. . . . 85 4-3 MRI scan of the lower pelvis of a pregnant patient. (A) MR image. (B) Object
map superposed on the MR image. Object map: green - bones; light pink
-amniotic sac; dark pink - cervix; yellow - bladder; red - right obturator internus;
orange -
levator
ani. . . . 87 4-4 3-D reconstruction of the lower pelvis. Color code: gray - bones; light pink-amniotic sac; dark pink - cervix; yellow -bladder; red - right obturator internus;
4-5 Medical images with superposed solid reconstruction of the cervix and the uterus.
(A) Raw ultrasound data in a stack of confocal images. (B) A single MR image.
Copyright Dr. House. . . . 89
4-6 3-D solid model of the cervix, uterus and the amniotic sac. (A) Sagittal view. (B) Posterior view. (C) A sagittal cross-sectional view. Copyright Dr. House. . . 90
4-7 3-D reconstruction of the lower pelvis: insufficient cervix with fetal membranes protruding into the endocervical canal. Color code: light pink - amniotic sac; dark pink -cervix and uterus; yellow -bladder. . . . 91 4-8 A sagittal view of a pregnant patient at 20 weeks of gestation showing the
struc-turre of the cervix (outlined in white) and dimensions of the amniotic sac. . . . 92
4-9 Idealized 3-D geometry of a pregnant patient at the 20th week of gestation. (A) Solidworks model of the abdomen and pelvis. (B) Pelvic bones. (C) Superpo-sition of the idealized abdominal and pelvic geometry and the structure of the bones. ... ... 93
4-10 Idealized 3-D geometry of the abdomen and lower pelvic region of a pregnant patient at 20 weeks of gestation with identified structures. . . . 94 4-11 Rheological model for the preliminary model for the stroma of the cervix [30]. 95
4-12 Decomposition of the total deformation gradient into growth, plastic and elastic parts. BO is the initial configuraion, B9 and BR is the intermediate unstressed
configurations. . . . 100
4-13 Reduced rheological model for the material behavior of the healthy cervical strom a. . . . 103
4-14 Solid model of the abdominal and pelvic region of a pregnant patient at the 20th week of gestation. . . . 106
4-15 Implementation of growth. The structure of the amniotic membrane is not dis-played. (A) Reference state at 20th week of gestation. (B) Grown uterus at the 24th week of gestation. . . . 107
4-16 Growth from 20th week to 24th week of gestation - Misses stress distribution.
(A) Reference state at 20th week of gestation. (B) Grown uterus at the 24th
4-17 Stress distribution and the progression of funneling. (A) Initial configuration. (B) Funneling initiates at the internal cervical os. (C) Characteristic "V" shape of the progression. (D) Fully dilated cervix in the "U" shape. . . . 113 4-18 The progression of deformation of the dilating insufficient cervix. (A) Initial
configuration. (B) Funneling initiates at the internal cervical os and the cervix assumes characteristic "Y" shape. (C) Characteristic "V" shape of the progres-sion. (D) Fully dilated cervix in the final "U" shape with fetal membranes protruding at the site of the external os. . . . 114 4-19 Uterine contractile activity. Left: deformation profile, middle: strain
distribu-tion, right: strain levels. (A) Initial configuration: the cervix and the uterus at the 20th week of gestation. (B) The grown uterus and cervix at the 24th week of gestation. (C) Initiation of contraction. (D) Peak of the first contraction. (E)
Resting state following the contraction. (F) Peak of the second contraction. . . . 118
4-20 Stress distribution in the uterus and the cervix during uterine contractile activity. Left: Mises stress distribution, right: corresponding stress levels. (A) Initial grown configuration: the cervix and the uterus at the 24th week of gestation. (B) Initiation of contraction. (C) Peak of the first contraction. (D) Resting state following the contraction. (E) Peak of the second contraction. . . . 120
4-21 Internal uterine pressure as a function of time arising as a result of a contractile activity of the myometrium. . . . 121 4-22 Mises stresses at the internal os as a function of time arising as a result of a
contractile activity of the myometrium. . . . 121
4-23 Maximum principle stress at the internal os as a function of time arising as a result of a contractile activity of the myometrium. . . . 122
4-24 Comparison between a 3-D and axisymmetric geometry. (A) Axisymmetric geometry. (B) 3-D geometry. Top: All the identified structures included; bottom: The essential structures without the structure of the abdominal organs. . . . 123 4-25 Contact pressures as a result of application of intrauterine pressure of 10 mmHg.
4-26 Contact pressures as a result of application of intrauterine pressure of 10 mmHg and gravity. (A) Axisymmetric geometry. (B) 3-D solid geometry. . . . 124 4-27 Funneling of the insufficient cervix (axisymmetric geometry) and the maximum
principal stress distribution. (A) Initial configuration. (B) Initiation of funneling and a characteristic "Y" shape of the deformation. (C) Characteristic "V" shape of the deformation. (D) Final "U" shape of the deformation with fetal membranes protruding into the endocervical canal. . . . 131
4-28 Cerclage effectiveness. Far left: initial axisymmetric configuration; left middle: deformation profiles at the end of the simulation; right middle: corresponding maximum principal stress distribution; far right: corresponding stress values.
(A) High cerclage. (B) Middle cerclage. (C) Low cerclage. (D) No cerclage. . . . 132
4-29 Force in the cerclage stitch as a function of normalized time. Color code: red
-high cerclage; green -middle cerclage; blue - low cerclage. . . . 133
4-30 Effect of the diameter of the endocervical canal on the distribution of the out of plane (circumferential) stress in the cervix. (A) Canal diameter 12 mm. (B) Canal diameter 8 mm. (C) Canal diameter 4 mm . . . 134 4-31 Effect of cervical lenght on the distribution of the out of plane (circumferential)
stress in the cervix. (A) Cervical length of 1.5 cm. (B) Cervical length of 2.5 cm. (C) Cervical length of 3.5 cm. . . . 135
4-32 Effect of membrane adhesion on the distribution of the out of plane (circumfer-ential) stress in the cervix. (A) Case of no adhesion. (B) Case of adhesion. . . . 136 5-1 Schematic of an idealized ECM of the cervical tissue. (A) Components of the
idealized stroma. (B) Different water compartments. . . . 143
5-2 Micrograph of a collagen matrix. (A) Undeformed state. (B) Reorientation and
stretching of the collagen fibrils under the action of uniaxial extension. (Modified from Roeder et al [80]). . . . 152 5-3 The 8-chain unit cell. The cell deforms along the principal directions b1 b2 b3 of
the left Cauchy-Green tensor B with stretches Aj, A2, A3 equal to the principal stretches. . . . 154
5-5 Rheological model for the volumetric network . . . 158
5-6 Rheological model of compartment 2. . . . 159
5-7 Rheological model of compartment 1. . . . 160
5-8 Rheological model for the deviatoric collagen network and backstress. . . . 162
5-9 Rheological model for the macroscopic response of the stroma of the cervix. . . . 167
5-10 Fit of the model simulation and the experimental data in compression. Color code: red -first loading ramp; blue - second loading ramp; green - third loading ramp; black -simulation fit (three load-unload ramps). (A) Nominal stress [MPa] vs axial stretch. (B) Volumetric change vs stretch. . . . 170
5-11 Model simulation results vs axial stretch. Upper left: Macroscopic stress in MPa; upper right: Total volumetric stress; lower left: volume of the bound GAG/collagen compartment; lower right: volume of the free GAG compartment. 171 5-12 Model simulation results. Upper left: Hydrostatic stress in the elastin; upper right: hydrostatic stress in the free GAGs; middle left: hydrostatic stress in the bounf GAGs; middle right: hydrostatic stress in the collagen; lower left: intercompartmental stress; lower right: deviatoric stress in the collagen. . . . 172
5-13 Fit of the model simulation and the experimental data in compression. Color code: red -experimental data; black -simulation fit. (A) Nominal stress [Mpa] vs time. (B) Volumetric change vs time. . . . 173
5-14 Description of the initial equilibrium of compartment one: solid black axes repre-sent the initial situation in which the prestretched collagen fibers are equilibrated by the precompressed bound GAGs (depicted by *). Broken blue axes represent an alternative description of the equilibrium stress state which treats the colla-gen as having no initial prestretch and associates a bigger bulk compressibility coefficient of the boung GAGs. Top: collagen response; bottom: GAG response. . 175 5-15 Sensitivity of the parameters: choice of material parameters II. Left: experimen-tal response; right: simulation fit. (A) Nominal stress [MPa] vs axial stretch. (B) Volume change vs axial stretch. . . . 177
5-16 Sensitivity of the parameters: choice of material parameters III. Left:
experimen-tal response; right: simulation fit. (A) Nominal stress [MPa] vs axial stretch. (B) Volume change vs axial stretch. . . . 178 5-17 Sensitivity of the parameters: choice of material parameters IV. Left:
experimen-tal response; right: simulation fit. (A) Nominal stress [MPa] vs axial stretch. (B) Volume change vs axial stretch. . . . 179 5-18 Fit of the model simulation and the experimental data in both tension and
com-pression. Color code: red - first loading ramp; blue - second loading ramp; green - third loading ramp; black -simulation fit (three load-unload ramps). (A) Nominal stress [MPa] vs axial stretch. (B) Volumetric change vs stretch. . . . 180
5-19 Fit of the model simulation and the experimental data in tension. Color code:
red -first loading ramp; blue -second loading ramp; green - third loading ramp;
black -simulation fit (three load-unload ramps). (A) Nominal stress [MPa] vs axial stretch. (B) Volumetric change vs stretch. . . . 181
5-20 Fit of the model simulation and the experimental data in tension. (A) Nominal
stress [MPa] vs time. Color code: red - experimental material response; black
- simulation fit. (B) Volumetric change vs time. Color code: red -first loading
ramp; blue - second loading ramp; green - third loading ramp; black -simulation
fit (three load-unload ramps). . . . 181
5-21 Assessment of the effective collagen fibril stretch. (A) Fibril stretch based on the
macroscopic
left
Cauchy-Green tensor,A
= . (B) Fibril stretch based onthe isochoric left Cauchy-Green tensor, = F (C) Fibril stretch based on
the modified left Cauchy-Green tensor, A, ... . . ... 183
5-22 Eight-chain models. Left: Three dimensional isotropic unit cell proposed by
Arruda and Boyce [3]; right: Three-dimensional orthotropic unit cell proposed
5-23 Fit of the anisotropic model simulation and the experimental data in both
ten-sion and compresten-sion. Color code: red -first loading ramp; blue - second load-ing ramp; green - third loading ramp; black - simulation fit (three load-unload ramps). (A) Nominal stress [MPa vs axial stretch. (B) Volumetric change vs stretch. . . . 189 5-24 Fit of the anisotropic model simulation and the experimental data in tension.
Color code: red - first loading ramp; blue - second loading ramp; green - third loading ramp; black - simulation fit (three load-unload ramps). (A) Nominal stress [MPa] vs axial stretch. (B) Volumetric change vs stretch. . . . 189
5-25 Fit of the anisotropic model simulation and the experimental data in tension.
(A) Nominal stress [MPa] vs time. Color code: red - experimental data; black
-simulation fit. (B) Volumetric change vs time. Color code: red - first loading ramp; blue - second loading ramp; green -third loading ramp; black -simulation fit (three load-unload ramps). . . . 190
5-26 Fit of the anisotropic model simulation and the experimental data in compression.
Color code: red - first loading ramp; blue - second loading ramp; green -third loading ramp; black - simulation fit (three load-unload ramps). (A) Nominal stress [MPa] vs axial stretch. (B) Volumetric change vs stretch. . . . 190
5-27 Fit of the anisotropic model simulation and the experimental data in compression.
(A) Nominal stress [MPa] vs time. Color code: red -experimental data; black
-simulation fit. (B) Volumetric change vs time. . . . 191
5-28 Effective stretches in both tension and compression for the anisotropic material
m odel. . . . 192 5-29 Preliminary predictions of the model from uniaxial compression tests in the
lon-gitudinal direction. (A) Model predictions. (B) Experimental data. Color code: red - loading in the longitudinal direction; blue -loading in the circumferential direction. . . . 192
List of Tables
2.1 Composition of the ECM . . . 53
3.1 Comparison between peak and equilibrium stresses for uniaxial unconfined com-pression for three different obstetric cases. NPND - non-pregnant no previous deliveries; NPPD -non-pregnant with previous vaginal deliveries; PCS -pregnant taken out at the time of cesarian section. . . . . 3.2 Comparison between peak and equilibrium stresses for uniaxial confined
com-pression for three different obstetric cases. NPND - non-pregnant no previous deliveries; NPPD -non-pregnant with previous vaginal deliveries; PCS -pregnant taken out at the time of cesarian section. . . . . 4.1 4.2 4.3 4.4 4.5 5.1 5.2 5.3 5.4 5.5 5.6
Constitutive parameters for the healthy cervical stroma . . . . Loading history for the funneling simulation . . . . Constitutive parameters for the insufficient cervical stroma . . . . Loading history for the simulation of uterine contractions . . . . Constitutive parameters for the healthy cervical stroma chosen for the simulation of uterine contractions . . . . Material parameters for the cervical stroma. . . . . Isotropic material parameters for the healthy cervical stroma. . . . . Isotropic material parameters for the healthy cervical stroma (reduced)... Alternative set of material parameters for the cervical stroma .. . . . . Isotropic material parameters for the healthy cervical stroma (choice II). Isotropic material parameters for the healthy cervical stroma (choice III). .
68 69 . 104 .111 112 116 116 167 168 169 174 176 176
5.7 Isotropic material parameters for the healthy cervical stroma (choice IV). . . . . 177 5.8 Anisotropic material parameters for the healthy cervical stroma. . . . 188
Chapter 1
Cervical Insufficiency
1.1
Introduction
The uterine cervix is a collagenous organ in the female body situated at the neck of the uterus. The cervix acts as a physical barrier between the unborn fetus and the outside world (see figure
1-1). The normal function of the cervix in pregnancy is to stay firm and closed for the duration
of the gestation in order to contain the fetus in the uterine cavity (see figure 1-2).
At term, under the action of coordinated contractions from the uterine smooth muscle (the myometrium) the cervix undergoes a dramatic metamorphosis opening sufficiently to allow for the delivery of the fetus [251. In its physiologic nonpregnant condition the cervix does not bear loads and has a well defined compositional balance of the main constituents which comprise its stroma. During gestation the cervix undergoes a very complex compositional change associated with an altered balance of the main constituents which takes a physical manifestation in a significant softening of the stroma. This process of continual evolution of the cervical composition is referred to as cervical maturation and is a prerequisite for vaginal delivery.
Cervical dilation precedes every spontaneous vaginal delivery. In some patients, a mal-function of the cervical structure can lead to a premature delivery and a potential adverse outcome in the newborn. Other pathological conditions associated with preterm delivery can include an early onset of uterine contractions (preterm labor), and premature rupture of the amniotic membranes. In some particular cases the aforementioned cervical dilation proceeds
fetus
placenta
\ '
umbilical cord
X
amniotic sac
Figure 1-1: Anatomical environment around the from "Sobotta Atlas of Human Anatomy" [76].
cervixeri
bladder
cervix and the uterus in pregnancy. Modified
Figure 1-2: Healthy cervix during gestation. (A) Closed cervix. (B) Effaced cervix at term. Published with permissions, Copyright Krames/Stay Well.
in the absence of such complicating factors. Cervical insufficiency is an example of such case and is defined as a condition characterized by a gradual, progressive and asymptomatic cervical funneling [69]. Initiating at the inner os of the insufficient cervix, the dilation has a typical onset at the end of the second trimester or early third trimester. The dilation of the insufficient cervix happens in the absence of uterine contractions and is usually accompanied by a prolapse of the amniotic membrane into the endocervical canal [74], [72], [18].
The progression of the deformation of the cervical canal in the case of cervical insufficiency follows a T, Y, V, U pattern and starts at the internal os of the cervix and progresses towards the external os assuming a U shape in its final stage with amniotic membranes protruding at the site of the external os (see figure 1-3) [23]. A schematic representation of the dilation of the cervix is presented in Fig 1-4.
1.2
Definition and Diagnosis
The condition of cervical insufficiency accounts for a number of recurrent late second- or early third-trimester pregnancy losses. It differs from other causes of preterm delivery such as preterm labour and preterm ruptured membranes, bleeding and intra-amniotic infection [24], [47]. There exists a great variation in the incidence of this condition, with reports ranging between 0.05% and 2% of all deliveries [22]. The substantial variation in the reported numbers is partly due to the rarity of the condition, and partly due to the difficulty of making a correct diagnosis. In his 1980 publication McDonald [62] proposed a clinical definition for cervical insufficiency: a "history of one or more mid-trimester abortions, with early rupture of the membranes, usually before the onset of labor. There is absence of significant hemorrhage. The labors are short and relatively pain-free; the fetus is born alive. Repeated middle term trimester miscarriages at the same gestation are significant." Evidence shows that this definition is insufficient for diagnosis and requires the loss of at least one pregnancy in order to be contemplated [58].
The diagnosis of cervical insufficiency has long been a subject of controversy in the field of obstetrics. This elusive condition is most confidently established by an obstetric history of passive and painless dilation of the cervix in the late second- or early third-trimester of pregnancy. This asymptomatic effacement of the cervix, which happens in the absence of
Figure 1-3: Fetal membranes prolapsing into the endocervical canal of the insufficient cervix.
@2001 Philippe Jeanty
Figure 1-4: T, Y, V, U progression of the cervical dilation in the case of insufficiency. From www.thefetus.net with permission.
contractions from the uterine smooth muscle or labor, is often but not always accompanied by
a protrusion of the amniotic membranes into the endocervical canal [74], [181, [72], [32]. The aforementioned criteria are used in current clinical practice but are essentially inconclusive for objective diagnosis of cervical insufficiency [32]. Other than the case of most classic presentation of gross cervical malformation, the condition of cervical insufficiency is very hard to detect, especially in the absence of previous obstetric history of the patient. The diagnosis is usually made in retrospect after a poor obstetric outcome of a previous gestation and careful monitoring during a subsequent pregnancy [69].
The origin of the diagnostic controversy around cervical insufficiency lies ultimately in the existence of 2 different theories for the cervical function during pregnancy. Traditionally, the function of the cervix has been considered categorical in the sense that the cervix was regarded as either completely functional (competent) or nonfunctional (incompetent) based on the obstetric history of the patient or digital examination of the organ [74]. More recent studies based on ultrasonographic measurements of the length of the cervix and its obstetric performance challenge the idea of the cervix as a categorical variable and propose a treatment of the cervical function along a continuum of "competence" [47].
Even though a standard method for evaluation of the cervix in pregnancy, digital examina-tion proves an unsatisfactory method for cervical assessment due to the large variaexamina-tions among examiners [46]. Transvaginal sonography, in contrast, is a better reproducible method of ex-amination and has been used for years to study the dilation and length of the cervix of women with preterm birth [32].
In their 1995 study Iams et al used digital and transvaginal ultrasound sonography to assess the cervices of pregnant women at different gestational age with a history of one or more preterm births between 16 and 35 weeks of gestation [47]. The different group constituted women who delivered before 26 weeks, between 27 and 32 weeks, and between 33 and 35 weeks. The study also included a group of women with insufficient cervices and a control group of normal subjects. The analysis of the cervical length during the current pregnancy among the different groups clearly indicated a strong correlation between the obstetric history of the patient and the length of the cervix. Higher incidence of previous premature birth was associated with short cervical length, which supported the working hypothesis of the authors of cervical competence
as a continuum. Therefore the findings of this study are not consistent with the traditional theory of the cervical function as fully competent of fully insufficient. The authors support the idea of a multifactorial model of spontaneous birth in which the competence of the cervix is a continuous variable, thus providing an explanation for the relatively low predictive capabilities of individual risk factors associated with preterm delivery.
Another study assessing the correlation between the length of the cervix and the risk of spontaneous preterm delivery indicates the usefulness of this anatomical factor in predicting the successful outcome of pregnancy [46]. In their study Iams et al. performed transvaginal ultrasonographic assessment of the cervix of 2915 pregnant patients between 22 and 24 and 6/7 weeks gestational age. 2531 of those patients were examined again at 28 weeks. The reported values for cervical length at 24 weeks were 34.0 (t7.8 SD) mm for women with no previous deliveries and 36.1 (±8.4 SD) mm for parous women. The comparable results at 28 weeks reported cervical length of 32.6 (+8.1 SD) mm for nulliparous patients and 34.5 (+8.7 SD) mm for women with previous gestation. The reported differences in the values between parous and nulliparous patients were clinically unimportant and the number of previous deliveries in parous women was found to have no effect on the length of the cervix. Therefore the data were combined for analysis. Further investigation of the preterm birth predictive capabilities of funneling showed comparable clinical value of this test. The findings of Iams et al confirmed the existence of a direct relation between the duration of pregnancy and the length of the cervix: the shorter the cervix, the greater the likelihood of giving birth prematurely. Figure 1-5 shows the relative risk of a premature delivery before 35 weeks and patient distribution versus percentile cervical length as measured by Transvaginal Ultrasonography of women at 24 weeks of gestation. For example, this study shows that if the cervix is shorter than 1.5 cm, the risk of preterm birth is 10 times greater than the background risk. Supporting the hypothesis that there exists a continuum of cervical performance, the authors ascribe to the idea of spontaneous delivery as a multifactorial phenomenon in which the length of the cervix is an indirect indicator of cervical competence.
The presented studies confirm the crucial importance of the competency of the cervix in maintaining a healthy gestation and confirm the role of the cervix as a structure with variable performance along a continuum (rather than a dichotomous variable). These publications also
ao
10 100 4 2 0tasaaeanes 10 0 0 48 12182C42Sfl834444fl1MflMU 5 103550 7SFigure 1-5: Relative risk of premature delivery before 35 weeks and distribution of subjects versus cervical length percentile as estimated via means of transvaginal ultrasonography at 24 weeks of gestation. Reproduced by Iams et al [46].
emphasize the multifactorial nature of premature delivery in which anatomical features such as cervical length individually provide an insufficient evidence for objective clinical diagnosis.
1.3
Risk Factors
1.3.1 Loading Conditions on the Structure of the Cervix and the Uterus in
Pregnancy
It is well recognized in the medical community that the loading conditions on the cervical structure play an important role in controlling the outcome of the gestation. Clinicians agree
that factors such as gravity, intra-amniotic pressure and uterine contractility are crucial in
establishing the risk of preterm delivery for each patient. Notwithstanding the awareness of the relevance of these individual factors, the complexity of their interplay and their combined
effect on the outcome of the pregnancy is not well understood and still a subject of clinical investigations [74].
Effects of Fundal/Intra-Amniotic Pressure
MacDonald et al investigated the use of transvaginal sonography in monitoring the cervical anatomy and deformation of women at high risk of a preterm delivery in order to diagnose cervical insufficiency [58]. A cohort of 106 patients at high risk of preterin labor was surveyed via means of transvaginal sonography for the duration of the pregnancy starting at the second trimester between the 14th and the 21st week of gestation. This observational study performed between 1995 and 1997 aimed at studying the cervical changes after an initial appearance of open cervix at the site of the internal os. The anatomical variables monitored included the length and the width of the cervix, as well as any deformation of the internal cervical os. Opening of the internal os of more than 5mm, protrusion of amniotic membranes into the cervical canal as well as shortening of the cervical length of > 5mm served as a definition of cervical change.
Figure 1-6: Transvaginal sonography at 24 weeks' gestation. (A) Closed cervicla canal in the absence of transfundal pressure. (B) Breaking of the cervix at the site of the internal os of the same patient as a result of application of transfundal pressure. Reproduced from MacDonald et al [58].
The study demonstrated a significant changes in cervical length with the application of fundal or suprapubic pressure (see figure 1-7). The results showed a decrease in the median cervical length in the surveyed group from 21 mm to 16 mm and in all cases the change was progressive. Figure 1-7 A shows the progression of the decrease in the length of the cervix from 21 mm to 8 mni at rest and figure 1-7.B demonstrates the same progression after fundal
pressure with a reduction of the cervical length from 16 mm to 6 mm at the time of surgical intervention. The investigators concluded that a progressive cervical change initiated before 24 weeks suggests that a cervix which appears to be open at the internal os, at rest or under the application of a fundal pressure, is most likely the sonographic visualization of cervical insufficiency. The authors emphasized that cervical length alone is not suggestive of a risk of preterm delivery, but in combination with a deformed cervical geometry and bulging fetal membranes may be an indicator of an incompetent cervix. The importance of the application of fundal pressure in order to identify an insufficient cervix was apparent.
3o
T
I
IUS- -E N
om t of Prior to cerclage Onset Ok Prior to cerdage
Change change
Figure 1-7: (A) Length of cervix at the time of onset of cervical change and prior to clinical intervention without the aplication of fundal pressure. (B) Length of cervix at the time of onset of cervical change and prior to clinical intervention with the aplication of fundal pressure. Reproduced from MacDonald et al [58].
Effects of Multiple Gestation
Women carrying multiple gestations (twins or triplets) are at a higher risk of delivering preterm.
A comparison of singleton and multiple pregnancies performed by Goldenberg et al in 1996 [36]
revealed that short cervical length (< 25mm) was more common among twin pregnancies, both at 24 and 28 weeks, and that there are no other significant differences in the risk factors for preterm birth between singleton and multiple gestations. Cervical length of < 25mm measured at 24 weeks was concluded to be the best predictor for SPTB at < 32 weeks, < 35 weeks and
<37 weeks in twin gestations, while after the 28th week fetal fibronectin measurements proved
Bergelin et al [12] observed the cervical changes in twin pregnancies via means of transvaginal ultrasonography in the later part of pregnancy in order to determine the normal course of cervical deformation in the case of multiple gestation. A comparison between the changes in the geometry of the cervix of women with twins who gave birth preterm and at term was made as well. The results showed an accelerated cervical opening, open inner cervical os and dynamic changes earlier in the gestation, lesser extent of broadening of the cervix, and more frequently observed dynamic changes in preterm twin pregnancies (at 32-35 weeks gestation) as compared to twin pregnancies carried to full term ( 37 weeks gestation).
The results collected for twin pregnancies were also compared with previous studies per-formed by the researchers, which established some differences between the cervical geometries and changes in twin and singleton pregnancies carried to full term ( 37 weeks gestation).
Initial length of the cervix at first examination at 24 weeks was comparable for both twins and singleton pregnancies. The differences became more acute with the advance of the gestation in both cases with much faster cervical length reduction in the case of twin pregnancies. The length reduction rates were 1.0 mm/week for singleton pregnancies and 1.8 mm/week for twin pregnancies, and in both cases the reported results were for pregnancies that reached full term
( 37 weeks gestation). The authors speculated that the increased shortening rate of the cervix
could be attributed to overdistension of the uterus and increased pressure on the cervix rather than cervical ripening.
Effects of Uterine Contractions
Uterine contractions are the most important risk factor for preterm delivery and are present throughout the course of pregnancy. There is a significant difference between the early preg-nancy contractions which do not affect the course of the pregpreg-nancy and contractions causing preterm birth. Saito et al [82] investigated the length of the cervix before, during and after a contraction by means of transvaginal sonography in the initial stage of labor in an attempt to determine whether the changes in the cervix during contraction can be used to distinguish between active and latent labor and between normal and abnormal labor. 73 patients with uncomplicated labor with gestational age varying between 37 and 42 weeks (full term) were monitored for this study. The degree of shortening of the cervix was expressed as a percentage
and was defined as the ratio of the contracted length of the cervix during a contraction and the length of the cervix prior to the contraction. The transvaginal ultrasound observations revealed that on average the cervix shortened about 50% during an active contraction in the normal course of labor. The shortening of the cervix in the case of insufficient contractile activity was significantly smaller, such as in the cases of false labor and uterine dysfunction. It was concluded that measurements of the length of the cervix during an inactive state and during contraction can facilitate the identification of inefficient vs normal labor and can be helpful for providing a guideline for appropriate labor management.
Figure 1-8: Transvaginal ultrasound images of the uterine cervix. (A) Pre-contraction. (B) At the peak of contraction. Reproduced from Saito [82].
1.3.2 Anatomical Risk Factors
The role of anatomical risk factors has been also recognized. In his seminal study discussed in the previous section, Iams et al [47] correlated a shorter cervical length with an increased risk for preterm delivery. A study by Goldenberg et al investigates the role of a large number of risk factors for preterm birth in order to better understand the strength of one risk factor versus another, as well as their complex interdependence [35]. The authors identified a number of risk factors for preterm birth (PTB), which were categorized in several groups. Some of the monitored variables included cervical length or funneling as measured by ultrasonography, as
-well as effacement, dilatation and consistency as determined by digital examination. Uterine contractile activity, presence of cervical or vaginal fetal fibronectin (FFN) and obstetric history were surveyed as well. The study included more than 3000 women at approximately 24 weeks of gestation and was conducted at 10 medical centers in the US between the years 1993 and 1996. The monitored patients were evaluated at 24, 26, 28 and 30 weeks' gestation. The findings of this study indicate that previous obstetric history of preterm birth, in particular an early one, vaginal or cervical FFN presence especially between 24 and 26 weeks and anatomically short cervix are strong predictors of preterm birth. The most important factors associated with spontaneous preterm birth (SPTB) at less than 32 weeks of gestations were announced as a positive cervical-vaginal fetal fibronectin test of > 50 ng/mL, cervix shorter than 25 mm and a history of a previous SPTB.
A very recent study conducted by Schmitz et al [83] assesses the predictive potential of
selective fetal fibronectin detection after cervical cerclage measurement. A cohort of 359 women hospitalized for preterm labour between 18 and 34 weeks' gestation participated in the study. Cervical length < 25mm and FFN > 50 ng/mL were chosen as the best indicators for predicting PTB before 35 weeks of gestation. The results indicated that cervical length < 25mm was less specific than FFN > 50 ng/mL for positive preterm birth. In order to assess the selective use of FFN after cervical length measurement, risk patient were identified as having cervical length < 15 mm or between 16 and 30 mm wit FFN concentration > 50 ng/mL. Selective FFN measurements posterior to cervical length measurement indicated excellent negative predictive values (94%) for delivery before 35 weeks thus suggesting that selective use of FFM in daily obstetric practice could provide a better assessment of the potential preterm risk and subsequent treatment of the patient.
Guzman et al [37] surveyed a cohort of 469 women at high risk of PTB between 15 and 24 weeks' gestation using transvaginal sonography and transfundal pressure. The anatomical factors investigated in this study were funnel width and length, cervical length, percent fun-neling and cervical index. The investigators concluded that there is no additional advantage of measurement of funnel width and length, percent funneling and cervical index over the cervical length. Moreover, cervical length appeared to be a better predictor especially in the case of earlier PTB (at < 28 and < 30 weeks) in comparison with the other anatomical parameters.
Simpler to obtain, sonographic measurements of the cervical length were shown to be the most beneficial for the prediction of prematurity in conjunction with the patient history of prior mid-trimester loss and/or a prior preterm birth. Based on their findings the investigators propose possible treatment guidelines and intervention strategies. For a cervical length of 2.1-2.5 cm the patients were advised to reduce physical activities, while the recommendation in the case of cervical length between 1.6 and 2.0 cm was bed rest. Cervical length of less than 1.5 cm was chosen as a cut-off value for surgical intervention (i.e. cerclage).
Other studies suggest that cervical length may be more efficient in predicting the outcome of a high-risk singleton gestation than assessing the risk of a premature delivery in the case of multiple gestations.
1.3.3 Consistency of the Cervical Stroma (Mechanical Properties)
Finally, the consistency of cervical stroma, as assessed by the attending clinician in a physical exam of the patient, can also be an indicator of risk. While a normal cervix progressively softens during pregnancy and dramatically weakens (ripens) sub-partum, an insufficient cervix can be found to be already in a weakened soft state in earlier stages of gestation or even in non-pregnant patients. During a physical examination, an increased softness of the cervix is an indication of altered biochemical composition of the stroma [42], [64], [29], [27].
Several studies assessing the resistance of non-pregnant cervices via methods of in-vivo balloon and dilators showed that mechanical testing of the cervix in the non-pregnant state can predict cervical insufficiency in subsequent pregnancies [91]. Zlatnik et al studied a cohort of 184 patients with a history of spontaneous second-trimester abortions and early preterm deliveries performing hysterography, catheter traction and dilator passage tests to calculate a compliance score. Women with potentially insufficient cervices had higher compliance scores (corresponding to less cervical resistance) and delivered earlier in gestation than women with low scores.
Anthony et al [2] measured the "cervical resistance index" (CRI) defined as the force required to achieve short-range dilation of the cervix in 20 patients with an obstetric history of previous spontaneous mid-trimester abortion. The CRI of patients with a history of potential cervical insufficiency was much lower (2.44±0.78) in comparison with the index of parous patients with
normal menstrual cycles (4.91±0.41), which indicated a lower cervical resistance associated with insufficiency.
Kiwi et [49] al performed a study assessing the elastance of the cervix, defined as the change in volume of a compliant balloon placed within the endocervical canal, in patients with a history of one or more previous spontaneous mid-term pregnancy losses. The study concluded that the elastance of the cervices of non-pregnant patients with an obstetric history of preterm birth associated a diagnosis of cervical insufficiency is lower than the normal control group. The authors also speculated that this decreased resistance is suggestive of actual physical changes in the cervix, which facilitates dilatation of the cervix during labor.
1.3.4 Conclusions
Mechanicians can easily recognize these three classes of risk factors as the underlying condi-tions governing any problem of structural integrity: loading, geometry, and material properties. Ideally, the structural integrity of a cervix, in its load bearing function, can be assessed and predicted for individual patients using conventional tools of structural mechanics, such as the finite element method. Numerical simulations, integrating anatomical factors, loading condi-tions, and tissue properties can be a powerful tool to gain a deeper insight into the biomechanics of pregnancy and to investigate the complex interplay of risk factors for preterm delivery. A bet-ter understanding of the mechanical behavior of the cervical tissue is an imperative prerequisite to pursue these objectives.
1.4
Preventive Methods and Treatment
A major issue in obstetric management is the prevention of preterm delivery. A correct
pre-diction of the potential risk of a preterm birth for the individual patient is prerequisite for an effective intervention and treatment. In current clinical practice, a short cervix is one of the main factors leading to clinical interventions (cerclage, bed rest) to prevent premature delivery.
![Figure 1-1: Anatomical environment around the from "Sobotta Atlas of Human Anatomy" [76].](https://thumb-eu.123doks.com/thumbv2/123doknet/14165281.473774/26.918.272.684.184.546/figure-anatomical-environment-sobotta-atlas-human-anatomy.webp)

![Figure 3-2: Siffness parameter r7 calculated by Mazza et al [61] for tests performed in- and](https://thumb-eu.123doks.com/thumbv2/123doknet/14165281.473774/65.918.260.687.166.455/figure-siffness-parameter-calculated-mazza-et-tests-performed.webp)