The Biomechanics of the Knee Following Injury and
Reconstruction of the Posterior Cruciate Ligament
Louis E. DeFrate
B.S. Mechanical Engineering, University of Pittsburgh, 1999
S.M. Mechanical Engineering, Massachusetts Institute of Technology, 2001 Submitted to the Department of Mechanical Engineering in partial fulfillment of the
requirements for the degree of
Doctor of Science in Mechanical Engineering at the Massachusetts Institute of Technology
June 2005
© Louis E. DeFrate. All Rights Reserved
MASSACHUSETTS INS OF TECHNOLOGY
JUN 1 6 2005
1
LIBRARIES
The Author hereby grants to MIT permission to reproduce and to distribute publicly paper and electronic copies of this thesis document in whole or in part.
Signature of Author:
Certified by:
Certified by:
Accepted by:
Department of Mechanical Engineering April 29, 2005
Guoan Li A'Ssoci e Professor of Orthopaedic Surgery/Bioengineering
... " ...
Harvard Medical School Thesis Supervisor
Derek Rowell Professor of Mechanical Engineering Thesis Supervisor
Lillit Anand Professor of Mechanical Engineering Graduate Officer
The Biomechanics of the Knee Following Injury and
Reconstruction of the Posterior Cruciate Ligament
Louis E. DeFrate
Submitted to the Department of Mechanical Engineering
in partial fulfillment of the requirements for the degree of Doctor of Science in Mechanical Engineering
Abstract
Very little is known regarding the function of the posterior cruciate ligament in response to physiological loading conditions. A limited understanding of posterior cruciate ligament function might contribute to the poor clinical outcomes that are observed after reconstruction. Therefore, the objectives of this thesis were to quantify the biomechanical function of the posterior cruciate ligament both in-vitro and in-vivo and to investigate the effects of injury and reconstruction of the posterior cruciate ligament on knee joint biomechanics.
First, muscle loading conditions were simulated in cadavers to measure the effects of posterior cruciate ligament injury and reconstruction on knee joint kinematics and contact pressures. Next, the structural properties of the grafts used in posterior cruciate ligament reconstructions were optimized using a theoretical model. In order to verify these results using an experimental model, an imaging system was developed to measure the strain distributions around the graft surface during tensile testing.
Finally, the deformation of the posterior cruciate ligament was studied in living subjects using imaging and solid modeling techniques. Three-dimensional models of the knee joint, including the insertion sites of the posterior cruciate ligament were created from magnetic resonance images. The subjects then flexed their knees as they were imaged using fluoroscopy from two orthogonal directions. The models and orthogonal images were imported into a solid modeling software and used to reproduce the kinematics of the knee as a function of flexion. From these models, the three-dimensional deformation of the posterior cruciate ligament insertion sites was measured. These data illustrated that the in-vivo function of the posterior cruciate ligament is different from that observed in in-vitro studies. Current surgical treatments of posterior cruciate ligament injuries do not account
for the in-vivo function observed in this study.
In summary, this thesis quantified the biomechanical role of the posterior cruciate ligament in response to physiological loading conditions. In addition, grafts used to reconstruct the posterior cruciate ligament were optimized. These data provide valuable information for developing surgical treatments that recreate the in-vivo biomechanics of the posterior cruciate ligament.
Guoan Li, Thesis Supervisor
Associate Professor of Orthopaedics (Bioengineering) Harvard Medical School
Derek Rowell, Thesis Supervisor Professor of Mechanical Engineering Massachusetts Institute of Technology
Alan
J.
Grodzinsky, Committee MemberProfessor of Electrical, Mechanical, and Biological Engineering Massachusetts Institute of Technology
Thomas
J.
Gill, Committee Member Assistant Professor of Orthopaedic SurgeryMassachusetts General Hospital and Harvard Medical School
Acknowledgements
First of all, I'd like to thank my committee for all of their help completing this work. My advisor Dr. Guoan Li patiently guided me throughout my graduate studies. Dr. Li is truly a great researcher and a wonderful teacher. Dr. Gill always provided me with excellent clinical perspectives and was a constant source of enthusiasm regarding our projects. I'd also like to thank Professor Rowell for all of his help as my academic advisor and chairman of my committee. Professor Grodzinsky constantly always had keen insight into the fundamental biomechanical principles that were involved. Thank you all for your excellent guidance and support.
I'd also like to thank all of the members of our laboratory including
Ramprasad Pappanagari (who always eagerly helps everyone in the lab!), Ephrat Most, Alex van der Ven, Shay Zayontz, Hao Sun, Conrad Wang, Jeremy Moses, Neil Pathare, Jeremy Suggs, Janine Pierce, Bruce Stamos, Chris Carey, David Golden, Dr. Park, Dr. Yoo, Patrick Boyer, Lu Wan, Jeremie Axe, Andy Silver, George Hanson, Ran Schwarzkopf, Lunan
Ji,
Matt Schutzer, Bill Bartholomew, Jenny Cooper, Ara Nazarian, and Vaida Glatt. Without you all, this work would have been impossible. Thank you for all of your support, both professionally and personally. Also, I'd like to thank Dr. Rubash and Dr. Herndon for all of their support and leadership in the lab. Thanks also to my classmates at MIT who helped me to make it through my class work at MIT, including Anton Thomas, Mike Johnson, Neil Gupta, Phil Balucan, Matt Lim, Byron Stancil, Srikanth Vendatam, and Jeremy Levitan.Finally, I'd like to thank my family for their support. Mom, Dad, Peter, Vickie Daniel, Grandpa Lou, Grandma Jewell, Grandma Jean, and Grandpa Edwin-- thank you for believing in me and helping me along. Thanks also to Marisa's family for their patience and encouragement. Last, but not least, I'd like to thank Marisa, my wonderful wife for all of her effort and support. I could have never made it without you. This degree is as much yours as it is mine.
Table of Contents
TABLE OF FIGURES ...
10
CHAPTER 1: INTRODUCTION ...
19
1.1. The posterior cruciate ligament... 19
1.2. Objectives and overview ... 22
1.3. Conclusion... 26
1.4. Related Publications... 27
CHAPTER 2: THE BIOMECHANICS OF THE POSTERIOR CRUCIATE
LIGAM ENT DEFICIENT KNEE ...
29
2.1. Posterior cruciate ligament injury ... 29
2.2. Previous biomechanical studies... 33
2.3. Objective ... 36
2.4. Materials and methods... 37
Statistical Analysis ... 43
2.5. Results ... 44
Anterior-posterior tibial translation in response to posterior loads... 44
Kinematics in response to muscle loads ... 45
2.6. Discussion of results ... 49
2.7. Conclusion... 55
CHAPTER 3: POSTERIOR CRUCIATE LIGAMENT
RECON STRUCTION ...
56
3.1. Introdu ction ... 56
3.2. O bjective ... 62
3.3.
M eth ods...
63
Surgical P rocedure ... 66
Contact Pressure Measurements ... 67
Statistical A nalysis... 69
3.4. R esults ... 70
Tibiofemoral Kinematics...70
Patellofemoral Joint Contact Pressures... 75
3.5. Discussion of Results...80
CHAPTER 4: THE EFFECTS OF LENGTH ON THE STRUCTURAL
STIFFNESS OF POSTERIOR CRUCIATE LIGAMENT GRAFTS...88
4.1. Introduction... 88
4.2. Theoretical Model: Materials and Methods ... 91
4.3. Theoretical Model: Results ... 97
Achilles Tendon Graft ... 97
Patellar tendon graft ... 99
4.4. Theoretical Model: Discussion...102
4.5. Experimental Model: Introduction ... 108
4.6. Experimental Model: Materials and Methods...108
4.7. Experimental Model: Results ... 112
4.8. Experimental Model: Discussion...115
CHAPTER 5: MEASURING IN-VIVO KNEE KINEMATICS...120
5.1. Introduction...120
5.2. M aterials and methods...122
3D fluoroscope ... 122
Validation of dual orthogonal imaging technique to measure position of 3D objects...123
Application to the measurement of in-vivo knee joint kinematics...126
5.3. Results ... 129
Accuracy of the orthogonal image technique ... 129
In-vivo weight-bearing knee kinematics ... 130
5.4. Discussion...133
CHAPTER 6: IN-VIVO POSTERIOR CRUCIATE LIGAMENT
KIN EM ATICS ...
138
6.1. Introduction...138
6.2. M aterials and M ethods...140
6.3. Results ... 147
Length...147
Functional Bundle Length...148
T w ist...14 9 Elevation ... 150
D eviation...151
6.4. Discussion...152
CHAPTER 7: MEASURING SURFACE STRAIN DISTRIBUTIONS
DURIN G TEN SILE TESTIN G ...
158
7.1. Introduction...158 7.2. M ethods...161 System Validation ... 165 D ata Analysis ... 167 7.3. Results ... 169 7.4. Discussion...172
CHAPTER 8: CONSTITUTIVE MODELING OF LIGAMENT AND
TEN D ON S ...
176
8.1. Introduction...176
8.2. M ethods...178
M ooney-Rivlin M odel...178
Exponential formulations...180
Prediction of stress-strain behavior of ligaments and tendons...181
Prediction of Stress Relaxation...181
8.3. Results ... 183
8.4. Discussion...190
CH APTER 9: CON CLUSION ...
194
9.1. Summary and Future Directions...194
REFEREN CES ...
199
Table of Figures
Figure 1.1. An image of a healthy posterior cruciate ligament created using magnetic resonance. The posterior cruciate ligament attaches on the femur and the posterior aspect of the tibia. ... 21 Figure 1.2. The robotic testing system. Loads are measured using the load cell attached to the end of the robotic arm. Muscle loads are applied through a system of ropes and pulleys ... 23
Figure 1.3. A three-dimensional model of the knee joint recreated from magnetic resonance images (left). The model includes the insertion points of the femur and tibia. The models are used to reproduce tibiofemoral kinematics using orthogonal pairs of fluoroscope... 25
Figure 2.1. Anterior and posterior view of a left knee joint. The cruciate ligaments form a cross in the center of the femur and the tibia, with the anterior cruciate ligament in front, and the posterior cruciate ligament behind...30 Figure 2.2. Experimental setup for many biomechanical studies on posterior cruciate
ligament function. The femur is held fixed as loads of approximately 10ON are applied to the tibia and the resulting translation in the posterior direction is m easu red . ... 33
Figure 2.3. Figure denoting definitions of anterior and posterior translation and internal and external rotation... 36
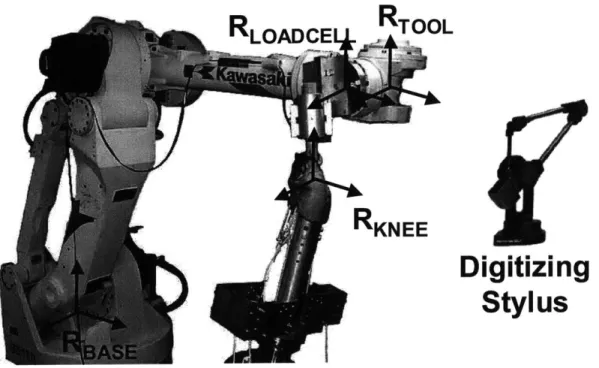
Figure 2.4. The robotic testing system consists of a robotic arm and a six degrees-of-freedom load cell. The femur is fixed to a pedestal and the tibia is attached to the end of the robotic arm. Muscle loads are applied via the system of ropes an d p u lleys. ... 39
Figure 2.5. The digitizing stylus used to create coordinate systems on the knee joint
(RKNEE), the load cell (RLOADCELL), the end of the robotic arm (RTOOL). The relative position and orientation of the tool coordinate system relative to the base (RBASE) is controlled by the robot ... 40
Figure 2.6. Coordinate system used to measure tibiofemoral kinematics...41 Figure 2.7. Posterior tibial translation as a function of flexion in response to the
posterior tibial load. Negative values denote posterior tibial translation. PCL deficiency resulted in a statistically significant increase in the translation at each flexio n an gle... 44 10
Figure 2.8. A plot of tibial translation (mean ± standard deviation) versus flexion angle in response to the quadriceps load (400N). Positive values denote anterior translation and negative values denote posterior translation. At 90 and 120 degrees of flexion, there was a statistically significant difference in the motion of intact and posterior cruciate ligament deficient knees. ... 46 Figure 2.9. A plot of tibial translation (mean ± standard deviation) versus flexion angle in response to the combined quadriceps/hamstrings load (400N/200N). Positive values denote anterior translation and negative values denote posterior translation. At 90 and 120 degrees of flexion, there was a statistically significant difference in the motion of intact and posterior cruciate ligament deficient k n ees...4 6 Figure 2.10. A plot of tibial rotation (mean ± standard deviation) versus flexion angle in response to the quadriceps load (400N). Positive values denote internal rotation and negative values denote external rotation. At 30, 60, 90 and 120 degrees of flexion, there was a statistically significant difference in the rotation of the intact and posterior cruciate ligament deficient knees... 47 Figure 2.11. A plot of tibial rotation (mean ± standard deviation) versus flexion angle in response to the combined quadriceps/hamstrings load (400N). Positive values denote internal rotation and negative values denote external rotation. At
30, 60, 90 and 120 degrees of flexion, there was a statistically significant
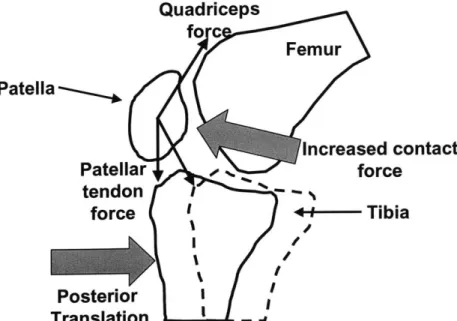
difference in the rotation of the intact and posterior cruciate ligament deficient k n ees...4 8 Figure 2.12. A figure demonstrating the effects of posterior tibial translation on contact pressures in the patellofemoral joint. A posterior shift of the tibia reduces the angle between the patellar and quadriceps tendons, thus increasing the patellofem oral contact force. ... 52
Figure 2.13. A figure demonstrating the effects of external tibial rotation (or internal femoral rotation on the contact pressures in the patellofemoral joint. External rotation would cause an increase in the contact pressures on the lateral surface of the patellofem oral joint... 53
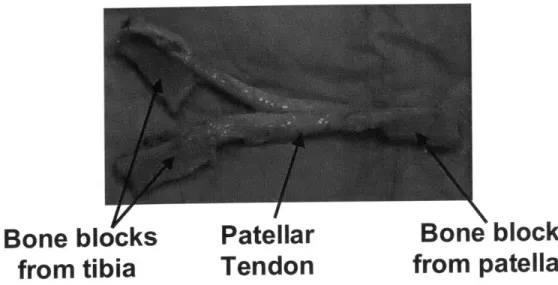
Figure 3.1. A patellar tendon graft used to reconstruct the PCL. This particular graft has been prepared for a double bundle reconstruction, as it has been split into two parts to simulate different portions of the PCL... 57
Figure 3.2. An Achilles tendon graft used to surgically reconstruct the posterior cru ciate ligam ent... 57
Figure 3.3. A schema of the transtibial tunnel technique. Tunnels are drilled through both the tibia and femur, and the graft is fixed within these tunnels...59
Figure 3.4. A schema of the tibial inlay technique. A trough is cut into the posterior aspect of the tibia, and the bone block is placed so that its outer surface is flush w ith th e tib ia... 59
Figure 3.5. Robotic testing system (left) and pressure sensor (right) used to measure patellofemoral contact pressures. The sensor was sutured to the patellar tendon in order to keep beneath the patella as the knee joint was moved by the robotic testin g system . ... 63
Figure 3.6. Flowchart of testing protocol. Each knee was tested by first measuring knee kinematics in response to simulated muscle loads with the posterior cruciate ligament intact, after the posterior cruciate ligament was cut, and after reconstruction. Patellofemoral contact pressures were then obtained by reproducing kinematics of intact, PCL deficient and PCL reconstructed conditions with a thin film pressure transducer... 65
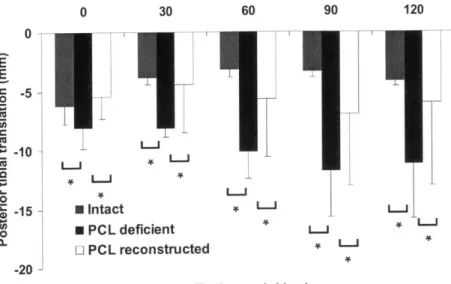
Figure 3.7. A graph of posterior tibial translation versus flexion angle for the intact, posterior cruciate ligament deficient, and reconstructed knee in response to a posterior tibial load. At each flexion angle, a statistically significant increase in translation was observed after posterior cruciate ligament deficiency. After reconstruction translation was decreased. (* p < 0.05)...71 Figure 3.8. A graph of tibial translation versus flexion angle for the intact, posterior
cruciate ligament deficient, and reconstructed knee in response to quadriceps loading (400N). Positive values denote anterior translation, and negative values denote posterior translation. A statistically significant posterior shift of the tibia was observed at 90 and 1200 of flexion after posterior cruciate ligament d eficien cy...7 1
Figure 3.9. A graph of tibial translation versus flexion angle for the intact, posterior cruciate ligament deficient, and reconstructed knee in response to combined quadriceps (400N) and hamstrings (200N) loading. Positive values denote anterior translation, and negative values denote posterior translation. A
statistically significant posterior shift of the tibia was observed at 60, 90, and 1200 of flexion after posterior cruciate ligament deficiency. After reconstruction, there was a statistically significant increase in posterior translation com pared to the intact knee. ... 72
Figure 3.10. A graph of tibial rotation versus flexion angle for the intact, posterior cruciate ligament deficient, and reconstructed knee in response to quadriceps (400N) loading. Positive values denote anterior translation, and negative values denote posterior translation. A statistically significant external rotation of the tibia was observed at 90 and 120' of flexion after posterior cruciate ligament
deficiency. Reconstruction reduced the external rotation, but no statistically significant differences were observed relative to the deficient or intact knee...73 Figure 3.11. A graph of tibial rotation versus flexion angle for the intact, posterior cruciate ligament deficient, and reconstructed knee in response to combined quadriceps (400N) and hamstrings (200N) loading. Positive values denote anterior translation, and negative values denote posterior translation. A
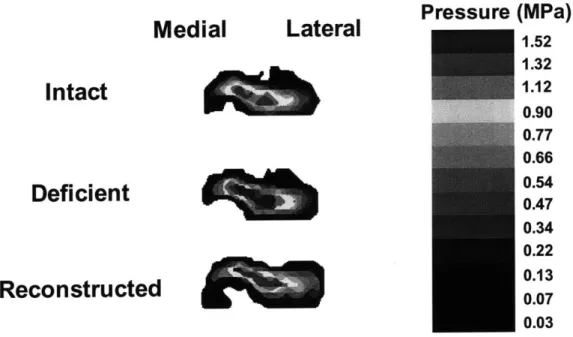
statistically significant external rotation of the tibia was observed at 90 and 1200 of flexion after posterior cruciate ligament deficiency. Reconstruction reduced the external rotation, but no statistically significant differences were observed relative to the deficient or intact knee... 74 Figure 3.12. Contact pressure distributions of a left knee at 90' flexion under intact,
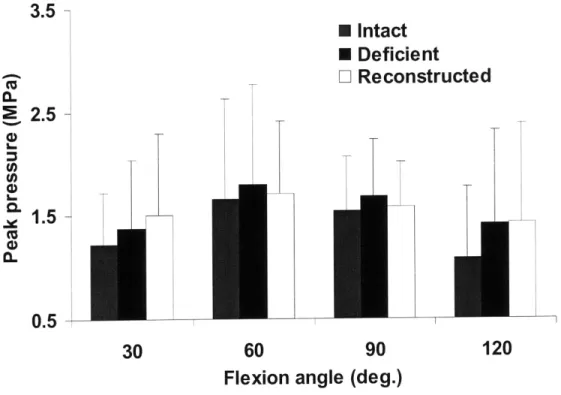
PCL deficient and PCL reconstructed conditions with simulated combined quadriceps and hamstring loading (400/200N)...75 Figure 3.13. Peak contact pressure of all knees in intact, PCL deficient and PCL
reconstructed states in response to simulated quadriceps loading...76 Figure 3.14. Peak contact pressure of all knees in intact, PCL deficient and PCL
reconstructed states under simulated A) quadriceps loading (400N) and B) the combined quadriceps and hamstrings loading (400/200N)...77 Figure 3.15. Plot of peak pressure for intact, deficient, and reconstructed knees in
response to simulated quadriceps loading (400N) and the combined quadriceps and hamstrings loading (400/200N). Statistically significant increases in contact pressures relative to that measured in the intact knee were measured after posterior cruciate ligament deficiency and reconstruction...79 Figure 4.1. A schema demonstrating how graft length changes with the location of
the fixation within the tunnels. A graft fixed at point A on the femur and point B on the tibia is longer than a graft fixed at point C on the femur and point D o n th e tib ia...90
Figure 4.2. A graph of force versus elongation for the posterior cruciate ligament generated from Equation (3) and values from the literature. The curve consists of two regions: a non-linear toe region, and a linear region. The shaded area beneath the curve represents the deformation energy of the posterior cruciate lig am en t...93
Figure 4.3. A graph of force versus elongation for the posterior cruciate ligament (PCL) and a 58mm long Achilles tendon (AT) graft. The difference in deformation energy is represented by the area between the two curves. This area is minimized in the objective function given in Equation (5)...96
Figure 4.4. A graph of the difference in deformation energy between the posterior cruciate ligament and an Achilles tendon graft as a function of graft length at loading levels ranging from 10ON to 1000N. Minimal strain energy corresponds to the optimal graft length. The optimal graft length for the Achilles tendon graft was near 48mm. The difference in deformation energy increased when the graft was lengthened or shortened relative to the optimal graft length...98 Figure 4.5. A graph of force versus elongation for the posterior cruciate ligament
(PCL) and three lengths of Achilles tendon (AT) grafts: 32mm, 48mm, and 75mm. The optimal graft length of 48mm closely matches the force displacement behavior of the posterior cruciate ligament. At the same displacement, grafts shorter than the optimal graft length result in more force than that transmitted by the posterior cruciate ligament, while graft longer than the optimal graft length result in less force ... 99
Figure 4.6. A graph of the difference in deformation energy between a patellar tendon graft and the posterior cruciate ligament as a function of graft length for loads ranging from 10ON to 1000N. The optimal graft length was near 34mm fo r all lo ad s. ... 100
Figure 4.7. A graph of force versus elongation for the posterior cruciate ligament (PCL) and two lengths of patellar tendon (PT) grafts: 34mm and 48mm. The optimal graft length of 34mm closely matches the force-displacement behavior of the posterior cruciate ligament. At the same displacement, the 48mm graft resulted in less force than the optim al graft...101 Figure 4.8. A graph of force versus elongation for the posterior cruciate ligament
(PCL) and a 75mm long Achilles tendon (AT) with an initial tension applied. At an applied force of 100N, the displacement of the graft and posterior cruciate ligam ent are sim ilar...105 Figure 4.9. A graph of force versus elongation for the posterior cruciate ligament
(PCL) and a 75mm long Achilles tendon (AT) with an initial tension applied. At an applied force of 100N, the displacement of the graft and posterior cruciate ligament are similar. However, at high levels of loading, the graft results in significantly more displacement than the posterior cruciate ligament...106 Figure 4.10. A figure of the Achilles tendon graft mounted on the materials testing
m ach in e. ... 109
Figure 4.11. A graph of force versus time during the preconditioning cycles. The peak force decreased at the number of cycles increased, with minimal change after ten cycles...110
Figure 4.12. Elongation versus force curve for a typical specimen. The specimen was tested sequentially from long to short. As the graft was shortened, there was less displacement under the same force. At higher levels of loading, the differences in displacement between the different graft lengths became larger.
... 1 1 2
Figure 4.13. Average elongation versus force plot for short, medium and long grafts (mean ± standard error of the mean). The plus sign indicates a statistically significant difference between long and medium grafts and the asterisk denotes a statistically significant difference between medium and short grafts...114 Figure 4.14. Linear stiffness of short, medium, and long grafts (mean ± standard
deviation). With increasing length, the linear stiffness of the graft decreased sign ifican tly...114
Figure 5.1. The 3D fluoroscope used to create models of the knee joint (left) and then used to measure kinematics during in-vivo knee flexion (right)...122 Figure 5.2. A schema of the virtual environment used to match the position of the
ball and cylinder. The position each object was changed until the outline of the object matched its projection on both flouoroscopic images...125 Figure 5.3. The measurement of in-vivo knee kinematics from the two the
fluoroscopic images and knee model. The tibia and femur were manually manipulated in six degrees-of-freedom until the outline of the model matched the outline of the orthogonal fluoroscopic images...127 Figure 5.4. The change in diameter of the ball's projection on the image intensifier as
the ball's position changed in the perpendicular direction (negative values correspond to translation towards the image intensifier and positive values corresponding to translations away from the orthogonal image intensifier). Position 1 corresponds to a point midway between the image intensifier and the source. Position 2 corresponds to a point closer to the image intensifier...130 Figure 5.5. Left: Tibiofemoral contact points at different flexion angles during the
weight-bearing lunge for a typical subject. Right: Tibiofemoral contact points of the three subjects versus flexion during the weight-bearing lunge (mean ± standard deviation). Positive values are anterior to the midline of the medial/lateral tibial plateaus and negative values are posterior to the midline. 131 Figure 5.6. Internal tibial rotation of the three subjects versus flexion angle during
in-vivo weight bearing lunge (mean ± standard deviation)...132 Figure 5.7. This figure shows the effects of slightly mismatching the diameter of the
ball in one image plane on the position of the ball in the orthogonal plane. A
slight mismatch in one plane (a) results in a large error in the orthogonal plane
(b )...1 3 4 Figure 6.1. Magnetic resonance image (left) and three-dimensional model created
from im age (righ t)...141 Figure 6.2. Three dimensional MR-based knee model of tibia and femur for a typical
specimen. The insertion areas of the PCL on the tibia and femur are divided into two functional bundles: anterolateral (AM) and posteromedial (PL)...141 Figure 6.3. The determination of in-vivo knee kinematics from the two the
fluoroscopic images and the 3D knee MR-based knee model. The tibia and femur were manually manipulated in 6 degrees-of-freedom until the outline of the model matched the outline of the orthogonal fluoroscopic images. ... 143 Figure 6.4. The relative position and orientation of the subject's knee are reproduced
by the knee model during flexion from 0 to 900 (top). The relative motion of
the insertion areas of the PCL of the same subject during flexion (bottom). Note the elongation and twisting motion of the PCL with increasing flexion. 144 Figure 6.5. The angles used to describe the orientation of the PCL. Elevation (a) is measured by projecting the long axis of the PCL on to the sagittal plane and measuring the angle relative to the anterior direction. Deviation (0) is measured
by the projection of the long axis of the PCL on the tibial plateau...145
Figure 6.6. Graph of the length of the posterior cruciate ligament (PCL) as a function of flexion during in-vivo weight-bearing flexion. ... 147
Figure 6.7. A plot of average length of the AL and PM bundles of the PCL versus flexion angle (*p< 0.05)...148 Figure 6.8. A plot of twist as a function of flexion. Positive twist corresponds to
external rotation of the tibial insertion relative to the femoral insertion, whereas negative twist corresponds to internal rotation of the femoral insertion relative to the fem oral insertion...149 Figure 6.9. A plot of twist as a function of flexion. Positive twist corresponds to
external rotation of the tibial insertion relative to the femoral insertion, whereas negative twist corresponds to internal rotation of the femoral insertion relative to the fem oral insertion...150 Figure 6.10. A plot of deviation as a function of flexion. The PCL was oriented
m edially with flexion from 0 to 90 ... 151
Figure 6.11. (a) The variation of femoral insertion of the AL bundle of the PCL by 5 mm in the anterior, posterior, proximal and distal directions; (b) AL bundle of the PCL elongations measured using different insertion points on the femur. Note that insertion variation affected the magnitudes of the ligament length, but had minimal effect on the length pattern along the flexion path...155 Figure 7.1. Schema of graft with locations of beads. The displacement of the bead
pairs were tracked on four surfaces: the front, back, and both sides. Beads attached to the clamps were used to measure the clamp displacement. A pair of beads was also attached to the interface of the clamps and tendon, in order to ensure that the graft did not slip within the clamps. ... 163
Figure 7.2. A fluoroscopic image of the specimen and beads during testing (left). The same image after thresholding and centroid calculation for each bead (rig h t)...164
Figure 7.3. Plot of measured displacement versus crosshead displacement when the crosshead was moved by a known amount. On average, this technique underestimated displacement by 0.02mm. Assuming an initial bead separation of approximately 10mm, this would result in an error in strain of approximately 0 .2 % ... 167
Figure 7.4. A plot of engineering strain versus average engineering stress for a typical specimen (A) and averaged over the eight specimens (B). Both applied stress and strain measure had statistically significant effects on strain. All of the differences between strain measurements were statistically significant beyond 0.5MPa. (average local tissue strain
=
average, minimum local tissue strain=
min, maximum local tissue strain
=
max, strain calculated from clamps=
clamp)... 17 0
Figure 7.5. A plot of elastic modulus calculated from each of the different strain measures. All of the differences between strain measurements were statistically significant except for those calculated from maximum tissue strain and the strain calculated from the clamps. (average local tissue strain
=
average, minimum local tissue strain=
min, maximum local tissue strain=
max, strain calculated from clam p s=
clam p) ... 171Figure 8.1. A plot of engineering stress versus strain for the anterior cruciate ligament
(ACL). The experimental data is depicted by the circles (Woo, et al., 1992), and
the predictions of the models are represented by the lines. All of the models closely fit the data below 3% strain and overestimated the stress beyond 3%
strain. However, the Mooney Rivlin (MR) model more accurately predicted the stress response compared to the exponential formulations (Equations (9) and
(1 2))...1
8 5
Figure 8.2. A plot of engineering stress versus strain for the patellar tendon. The experimental data is depicted by the circles (Johnson, et al., 1994), and the predictions of the models are represented by the lines. All of the models closely
fit the data below 3% strain and overestimated the stress beyond 3% strain.
However, the Mooney Rivlin (MR) model more accurately predicted the stress response compared to the exponential formulations (Equations (9) and (12)).185 Figure 8.3 A plot of engineering stress versus strain for the Achilles tendon. The
experimental data is depicted by the circles (DeFrate, et al., 2005), and the predictions of the models are represented by the lines. All of the models closely
fit the data below 3% strain and overestimated the stress beyond 3% strain.
However, the Mooney Rivlin (MR) model more accurately predicted the stress response compared to the exponential formulations (Equations (9) and (12)).187 Figure 8.4. A plot of engineering stress versus strain for the anterior cruciate ligament
(ACL). The experimental data (Woo, et al., 1992) was used to fit the models to 3 different levels of strain: 2% (A) 4% (B) and 6%(C). As the strain level used
to fit the models increased, the accuracy of the models increased. ... 188 Figure 8.5. A graph of stress versus time for patellar tendon. An instantaneous step in strain of 3% was applied, followed by stress relaxation. All three models were
fit to the experim ental data...189 Figure 8.6. A graph of stress versus time for patellar tendon. In this figure, a step
strain of 6% was applied. After 100s of relaxation, the exponential formulations
overestimated the peak stress of the experimental data by more than 200%...189
Figure 9.1. A figure depicting the cartilage thickness distribution on the tibial plateau (Left). The motion of the cartilage-to-cartilage contact points during in-vivo knee flexion. Note that the contact points are located where the cartilage is th ick est...197
Chapter 1: Introduction
1.1.
The posterior cruciate ligament
Injuries to the knee joint are relatively common. The American Academy of Orthopaedic Surgeons estimates that knee injuries are the most frequent reason for visits to orthopaedic surgeons in the United States, accounting for approximately 20 million visits in 2002. Injuries to the ligaments of the knee represent a significant impairment of normal knee joint function, resulting in pain, instability, and the long-term development of osteoarthritis (Andriacchi and Dyrby, 2005; Bergfeld et al, 2001; Buckwalter and Lane, 1997; Lipscomb et al, 1993; Roos et al, 1995).
The anterior cruciate ligament is thought to be the most frequently injured knee ligament. In 2000, it was estimated that approximately 80,000 anterior cruciate ligament ruptures occur each year in the United States, at an estimated cost of one billion dollars (Griffin et al, 2000). Although the documented cases of posterior cruciate ligament rupture are less frequent than those of anterior cruciate ligament, injuries to the posterior cruciate ligament (Figure 1.1) affects a significant number of patients.
It has been estimated that five to twenty percent of all knee ligament injuries and as much as sixty percent of ligament injuries treated in emergency rooms involve the posterior cruciate ligament (Bergfeld, et al, 2001; Clancy et al, 1983; Parolie and Bergfeld, 1986). The posterior cruciate ligament is often injured due to a large, posteriorly oriented force being applied to the tibia. Two of the most common injury
mechanisms include the dashboard injury, where the tibia strikes the dashboard during an automobile accident, and sporting activities (Bergfeld, et al, 2001). After posterior cruciate ligament injury, cartilage degeneration is predominantly found in the medial compartment of the tibiofemoral joint and in the patellofemoral joint. In an effort to ameliorate the osteoarthritis, pain, and instability experienced by patients with posterior cruciate ligament ruptures, many surgeons recommend reconstruction using a variety of graft materials and surgical techniques (Berg, 1995; Bergfeld, et al, 2001; Harner et al, 2000a; Harner et al, 2000b; Mannor et al, 2000; Markolf et al,
2003; Markolf et al, 1997a; Markolf et al, 1997b; McAllister et al, 2002). However,
the clinical outcomes of posterior cruciate ligament reconstruction remain unpredictable, with between 44-60% of patients developing osteoarthritis 4-7 years after surgery ((Lipscomb, et al, 1993; Wang et al, 2003; Wang et al, 2002). The precise mechanisms causing this degeneration remain unclear.
One possible explanation for this disparity in the performance of current reconstruction techniques in cadaver studies and in patients is that previous in-vitro studies do not accurately simulate physiological loading conditions. Few experiments evaluating posterior cruciate ligament reconstruction techniques have accounted for muscle forces, which are extremely important to normal joint function. Furthermore, the knee is a six degrees-of-freedom joint. Earlier studies have generally measured translation in only one direction (posterior direction). Finally, the magnitudes of the applied loads have also been relatively low (approximately 100N), compared to the estimate that several times body weight is transferred through the joint during in-vivo
activities (Li et al, 1999b). There is little data in the literature on the function of the
posterior cruciate ligament and
physiological loading conditions.
the effects of reconstruction in response to
Patella
Posterior
cruciate
ligament
Figure 1.1. An image of a healthy posterior cruciate ligament created using
magnetic resonance. The posterior cruciate ligament attaches on the femur
and the posterior aspect of the tibia.
1.2. Objectives and overview
The objective of this thesis was to gain a better understanding of the biomechanical function of the posterior cruciate ligament under physiological conditions. It is important to fully understand the role the posterior cruciate ligament plays under physiological loading conditions in order to improve surgical treatments of posterior cruciate ligament injury. First, a cadaver model was used to measure the six degrees-of-freedom kinematics of the knee joint in response to simulated muscle loads. Muscle loads were be applied based on data from a previous inverse dynamics study from our laboratory (Li, et al, 1999b). Knee
joint
kinematics were measured as a function of flexion using a robotic testing system (Gill et al, 2003a; Gill et al, 2004; Gill et al, 2003b; Li et al, 2002). Three different conditions were simulated: a healthy knee with the posterior cruciate ligament intact, an injured knee with the posterior cruciate ligament transected, and knee with the posterior cruciate ligament reconstructed. These data were used to quantify the effects of posterior cruciate ligament injury and reconstruction on the six degrees-of-freedom motion of the knee joint under muscle loading conditions.Load Cell
Robot
Tibia
Femur
Muscle Loads
Figure 1.2. The robotic testing system. Loads are measured using the load
cell attached to the end of the robotic arm. Muscle loads are applied through
a system of ropes and pulleys.
In addition, the contact pressures in the patellofemoral joint were measured
under the muscle loading conditions. These data were used to determine the effect
of altered kinematics on the load transfer between the cartilage layers. Although
altered knee kinematics have been thought to lead to joint degeneration (Andriacchi
et al, 2004; Buckwalter and Lane, 1997; Roos, et al, 1995), the precise mechanisms
remain unclear. The data from this thesis provides insight into the mechanisms
leading to osteoarthritis after the injury and reconstruction of the posterior cruciate
ligament.
Next, the deformation of the posterior cruciate ligament was studied in living
subjects using imaging and solid modeling techniques.
In order to improve
reconstruction techniques, it is essential to understand the biomechanical role of the
ligament being replaced. The knees of healthy subjects were scanned using magnetic resonance imaging. The images from these scans were used to create three-dimensional models of the knee joint (Figure 1.3). These models included the insertion sites of the posterior cruciate ligament and cartilage layers. The human subjects then performed a single-leg lunge as they were imaged from two orthogonal directions using fluoroscopy. The models and orthogonal images were imported into a solid modeling software and the model was manipulated in six degrees-of-freedom until its projection matched the outline of the two orthogonal images (Figure 1.3). After the models were matched at each flexion angle, they represented the kinematics of the knee as a function of flexion. This allowed for the measurement of the relative motion of the posterior cruciate ligament insertion sites during in-vivo knee motion in three dimensions. The elongation, twist, and changes in orientation of the posterior cruciate ligament were quantified in-vivo. These data provide a better understanding of the function of the posterior cruciate ligament under physiological conditions.
The data from these in-vivo and in-vitro experiments were used to optimize the structural properties of grafts used to reconstruct the posterior cruciate ligament, including the graft material and the dimensions of the graft. A theoretical approach was used first. Material properties from the literature were used to simulate the non-linear constitutive behavior of the posterior cruciate ligament and the materials used in its reconstruction. The difference in the deformation energy between the graft and the intact ligament were minimized by varying the geometry and material of the graft
under various loading conditions. Once an optimal graft was determined, the results
were experimentally validated on cadavers. An imaging system was developed to
measure strain distributions around the surface of grafts, since the strain distributions
in ligaments and tendon are not uniform during tensile testing. Closely matching the
structural properties of the graft should result in a reconstruction that will more
closely restore the biomechanical function of the posterior cruciate ligament. This
graft will reproduce the force transferred by the ligament and hence restore the
kinematics of the knee under physiological loading conditions.
Normal joint
kinematics and kinetics should result in normal loading patterns of the articular
cartilage and minimize degeneration. Finally, the predictive ability of some currently
used constitutive models of ligament and tendon were evaluated.
Femoral insertion
Tibial insertion
Figure 1.3.
A three-dimensional model of the knee joint recreated from
magnetic resonance images (left). The model includes the insertion points of
the femur and tibia.
The models are used to reproduce tibiofemoral
kinematics using orthogonal pairs of fluoroscope.
1.3.
Conclusion
Very little is known of the function of the knee ligaments during the activities of daily living. This thesis quantified the effects of posterior cruciate ligament injury and reconstruction on the kinematics and load transfer through the knee joint. Using a cadaver model, the relationship between knee kinematics and contact pressures was studied, in order to understand the biomechanical factors that contribute to cartilage degeneration following ligament injury. In addition, this thesis provides data on the in-vivo function of the posterior cruciate ligament. These data improve our understanding of the biomechanical function of the intact posterior cruciate ligament, thus providing a guideline for improving posterior cruciate ligament reconstruction techniques. Finally, the structural properties of replacement grafts were optimized in order to more closely reproduce the force transferred by the posterior cruciate ligament. The predictive ability of several constitutive laws of ligament and tendon were also evaluated. The studies performed in this thesis have been published in a number of journal articles, which are listed below.
1.4.
Related Publications
1. G. Li, T.J. Gill, L.E. DeFrate, S. Zayontz, V. Glatt, B. Zarins. "Biomechanical
consequences of PCL deficiency in the knee under simulated muscle loads--an in vitro experimental study".
J
Orthop Res, 2002. 20(4): 887-92.2. T.J. Gill, L.E. DeFrate, C. Wang, C.T. Carey, S. Zayontz, B. Zarins, G. Li. "The
biomechanical effect of posterior cruciate ligament reconstruction on knee joint function. Kinematic response to simulated muscle loads". Am
J
Sports Med, 2003.31(4): 530-6.
3. G. Li, L.E. DeFrate,
J.
Suggs, T. Gill. "Determination of optimal graft lengths for posterior cruciate ligament reconstruction--a theoretical analysis".J
Biomech Eng, 2003. 125(2): 295-9.4. L.E. DeFrate, T.J. Gill, G. Li. "In vivo function of the posterior cruciate ligament
during weightbearing knee flexion". Am J Sports Med, 2004. 32(8): 1923-8.
5. L.E. DeFrate, H. Sun, T.J. Gill, H.E. Rubash, G. Li. "In vivo tibiofemoral contact
analysis using 3D MRI-based knee models".
J
Biomech, 2004. 37(10): 1499-504. 6. S.E. Park, B.D. Stamos, L.E. DeFrate, T.J. Gill, G. Li. "The effect ofposterior knee capsulotomy on posterior tibial translation during posterior cruciate ligament tibial inlay reconstruction". Am
J
Sports Med, 2004. 32(6):1514-9.
7. G. Li, L.E. DeFrate, H. Sun, T.J. Gill. "In vivo elongation of the anterior
cruciate ligament and posterior cruciate ligament during knee flexion". Am
J
Sports Med, 2004. 32(6): 1415-20.
8. G. Li, L.E. DeFrate, S. Zayontz, S.E. Park, T.J. Gill. "The effect of tibiofemoral joint kinematics on patellofemoral contact pressures under
simulated muscle loads".
J
Orthop Res, 2004. 22(4): 801-6.9. G. Li, T.H. Wuerz, L.E. DeFrate. "Feasibility of using orthogonal
fluoroscopic images to measure in vivo joint kinematics".
J
Biomech Eng,2004. 126(2): 314-8.
10. L.E. DeFrate, A. van der Ven, T.J. Gill, G. Li. "The effect of length on the
structural properties of an Achilles tendon graft as used in posterior cruciate ligament reconstruction". Am
J
Sports Med, 2004. 32(4): 993-7.11. G. Li, E. Most, L.E. DeFrate, J.F. Suggs, T.J. Gill, H.E. Rubash. "Effect of the posterior cruciate ligament on posterior stability of the knee in high
12. G. Li, S. Zayontz, E. Most, L.E. DeFrate, J.F. Suggs, H.E. Rubash. "In situ forces of the anterior and posterior cruciate ligaments in high knee flexion: an in vitro investigation".
J
Orthop Res, 2004. 22(2): 293-7.13. T.J. Gill, L.E. DeFrate, C. Wang, C.T. Carey, S. Zayontz, B. Zarins, G. Li.
"The effect of posterior cruciate ligament reconstruction on patellofemoral contact pressures in the knee joint under simulated muscle loads". Am
J
Sports Med, 2004. 32(1): 109-15.
14. G. Li, S. Zayontz, L.E. DeFrate, E. Most, J.F. Suggs, H.E. Rubash. "Kinematics of the knee at high flexion angles: an in vitro investigation".
J
Orthop Res, 2004. 22(1): 90-5.15. G. Li, L.E. DeFrate, S.E. Park, T.J. Gill, H.E. Rubash. "In vivo articular
cartilage contact kinematics of the knee: an investigation using dual-orthogonal fluoroscopy and magnetic resonance image-based computer models". Am J Sports Med, 2005. 33(1): 102-7.
16. J.D. Yoo, R. Papannagari, S.E. Park, L.E. DeFrate, T.J. Gill, G. Li. "The
effect of anterior cruciate ligament reconstruction on knee joint kinematics under simulated muscle loads". Am J Sports Med, 2005. 33(2): 240-6.
17. G. Li, L.E. DeFrate, T.J. Gill. "In-vivo kinematics of the anterior cruciate
ligament during weightbearing knee flexion".
J
Orthop Res, 2005. 23(2):340-4.18. L.E. DeFrate, A. van der Ven, P.J. Boyer, T.J. Gill, G. Li. "The measurement
of the variation of surface strains of achilles tendon grafts using imaging techniques".
J
Biomech, 2005. In press.19. S.E. Park, L.E. DeFrate, J.F. Suggs, T.J. Gill, H.E. Rubash, G. Li.
"Elongation of the medial and lateral collateral ligaments during in-vivo knee flexion". Knee, 2005. In press.
20. G. Li, S.E. Park, L.E. DeFrate, M.E. Schutzer, L.
Ji,
H.E. Rubash."Site-specific analysis of cartilage thickness in the tibiofemoral joint using 3D MRI models of the knee." Clin Biomech, 2005. Accepted for publication.
21. L.E. DeFrate, G. Li. "An analytical simulation of the stress-strain behavior of ligaments and tendons". Submitted to
J
Biomech, 2005.Chapter 2: The biomechanics of the
posterior cruciate ligament
deficient knee
2.1.
Posterior cruciate ligament injury
The anterior and posterior cruciate ligaments form a cross-like shape in the center of the knee joint, with the anterior cruciate ligament in front of the posterior cruciate ligament (Figure 2.1). The anterior cruciate ligament inserts near the center of the tibial plateau and on the medial wall of the lateral condyle. The posterior cruciate ligament inserts on the posterior aspect of the tibia and on the lateral wall of the medial femoral condyle. Although little is known about the function of the cruciate ligaments during everyday activities, the anterior cruciate ligament is thought to resist anteriorly oriented loads to the tibia, while the posterior cruciate ligament posterior cruciate ligament is thought to resist posterior loads applied to the tibia
(Butler et al, 1980; Fukubayashi et al, 1982).
While not as frequent to injuries to the anterior cruciate ligament, posterior cruciate ligament tears can cause a significant impairment to normal knee function. Posterior cruciate ligament injuries are typically caused by a large posteriorly oriented force applied to the tibia (Covey and Sapega, 1993). Two of the most common mechanisms are the dashboard injury, when the dashboard strikes the tibia during motor vehicle accidents, and sports related injuries (Covey and Sapega, 1993; Schulz
et al, 2003). After posterior cruciate ligament injuries, many patients experience a
number of symptoms, including knee pain, osteoarthritis, and instability (Bergfeld, et
al, 2001; Keller et al, 1993; Richter et al, 1996).
Femur
Anterior
Cruciate
Ligament
Femur
Posterior
Cruciate
Ligament
Tibia
Tibia
Anterior View
Posterior View
Figure 2.1. Anterior and posterior view of a left knee joint. The cruciate
ligaments form a cross in the center of the femur and the tibia, with the
anterior cruciate ligament in front, and the posterior cruciate ligament behind.
Dandy and Pusey (Dandy and Pusey, 1982) studied twenty patients with
isolated posterior cruciate ligament tears treated non-operatively at an average of
seven years after injury. The average age of the patient at the time of follow-up was
31 years. Seventy percent of patients reported pain when walking long distances,
of patients reported that their knees were unstable when walking on uneven ground, and 30% of patients while descending stairs.
Keller et al (Keller, et al, 1993) studied 40 patients an average of six years after isolated posterior cruciate ligament injury. Ninety percent of these patients complained of knee pain. Forty three percent of patients experienced problems with walking. With increasing time from injury, there was an increase in the degeneration of the cartilage of the knee joint, as observed using radiographs. Degeneration began in the medial compartment of the tibiofemoral joint, and then moved into the patellofemoral joint and lateral compartment.
More recently, Boynton and Tietjens (Boynton and Tietjens, 1996) reviewed
30 patients with posterior cruciate ligament injuries and otherwise healthy knees at an
average of 13 years after injury. Patients had an average age of 29 years at the time of injury. Seventy-four subjects reported limited activity levels due to their injury. With increasing time from injury, there was an increase in the incidence and severity of osteoarthritis observed radiographically, with the degree of cartilage degeneration greater in the injured knee than in the uninjured knee. Osteoarthritic changes were observed in primarily the medial compartment of the tibiofemoral joint, but also were observed in the patellofemoral joint.
These studies all demonstrate that posterior cruciate ligament injury causes significant problems for the patient, causing instability and limiting the ability of patients to perform many activities of daily living. In the long-term, most patients
develop osteoarthritis after this injury. The precise mechanisms causing these symptoms are not well understood.
2.2. Previous biomechanical studies
Previous studies have investigated the effects of posterior cruciate ligament
injury on the biomechanics of the knee joint (Burns et al, 1995; Fox et al, 1998;
Fukubayashi, et al, 1982). These studies have been primarily performed in cadavers,
with the femur fixed and loads of approximately 10ON applied to the tibia in the
posterior direction (Figure 2.2) (Burns, et al, 1995; Fox, et al, 1998; Fukubayashi, et al,
1982).
The resulting translation in the posterior direction is then measured in
response to these loads. Posterior cruciate ligament injury is then simulated by
cutting the ligament, and the translation is again measured in response to the same
applied load. After cutting the posterior cruciate ligament, increases in translation of
approximately 10mm are measured (Fukubayashi, et al, 1982; Harner, et al, 2000b).
Femur
PCL
Force
~10ON
T
ibia
Figure 2.2. Experimental setup for many biomechanical studies on posterior
cruciate ligament function. The femur is held fixed as loads of approximately
10ON are applied to the tibia and the resulting translation in the posterior
direction is measured.
The number of studies quantifying the effects of posterior cruciate ligament deficiency in response to simulated muscle loading conditions is limited. Hoher et al measured the force in the posterior cruciate ligament in response to simulated muscle loading conditions (Hoher et al, 1999). In this study, quadriceps and hamstrings loads were applied to a cadaver knee at various flexion angles, and the tibia was permitted to move in the remaining five degrees-of-freedom. The posterior cruciate ligament was then cut, and the position of the joint before the posterior cruciate ligament was cut was reproduced. The principle of superposition was used to calculate the force in the posterior cruciate ligament by taking the difference between the applied force before and after cutting the ligament. Hoher et al reported that posterior cruciate ligament forces were maximal near 900 of flexion.
Skyhar et al applied quadriceps loading to cadavers and measured the contact pressures in the patellofemoral joint before and after resection of the posterior cruciate ligament (Skyhar et al, 1993). Pressure sensitive film was inserted into the patellofemoral joint and color intensity was correlated to contact pressures. An increase in the contact pressures was observed after posterior cruciate ligament resection.
The effects of posterior cruciate ligament injury on knee joint kinematics in response to physiological loading conditions remain unclear. Previous studies have focused on applying posterior loads to the tibia and measuring the translation in the posterior direction. Many studies do not account for the six degrees-of-freedom motion of the knee joint and do not simulate the effects of muscle loading. Muscle
loading is extremely important to normal joint function. In addition, these loading levels are low compared to the high forces (on the order of several times body weight) that are thought to be transferred through the knee joint during many activities of daily living.
2.3. Objective
The purpose of this study was to measure the effects of posterior cruciate
ligament injury on both anterior-posterior translation and tibial rotation of the
knee
in response to simulated muscle loads (Figure 2.3). This study is aimed at better
understanding the effects of posterior cruciate ligament on knee joint kinematics in
six degrees-of-freedom. Knee joint motion was measured before and after posterior
cruciate ligament dissection.
Posterior
translation
Internal
Rotation
Anterior
translation
External
Rotation
Figure 2.3. Figure denoting definitions of anterior and posterior translation
and internal and external rotation.
2.4. Materials and methods
Ten fresh-frozen cadaveric knee specimens (seven left and three right, age range 50-78 years) were used in this study. The night prior to testing the specimens were defrosted. Each specimen was radiographed and inspected by an orthopaedic surgeon to ensure that it had no gross abnormalities. Next, the specimens were cut at the midpoint of the femoral and tibia shafts and the ends of the femur and tibia was stripped of soft tissue. The remaining soft tissues surrounding the knee joint were left intact. The fibula was fixed to the tibia in its anatomical position using cortical bone screws. The ends of the femur and tibia were then fixed in cylinders of bone cement to enable rigid fixation during testing. The quadriceps tendon and the medial and lateral hamstrings tendons (semitendinosus/semimembranosus and biceps femoris) were isolated and ropes were sutured to the tendons in order to simulate muscle loads using a system of pulleys (Figure 2.1). Each specimen was then preconditioned by manually flexing and extending it ten times.
Next, the specimen was fixed in a robotic testing system (Figure 2.2), which was used to apply external loads each knee specimen (Li, et al, 2002; Li et al, 2003b). This system is composed of a six degrees of freedom (three translations and three rotations) robotic manipulator (Kawasaki UZ150, Kawasaki Heavy Industry, Japan) and a six degrees of freedom (three forces and three moments) force-moment sensor (JR3, Woodland, California). The robotic testing system operates in both force-moment control mode, where the knee is moved until the force-force-moment sensor registers the desired loading condition, and position control mode, where the position
of the knee joint is controlled and the load cell measures the applied force. Muscle loads are applied to the knee joint using a system of ropes and pulleys.
The femoral cylinder was rigidly fixed in a specially designed clamp that enabled the six degrees of freedom positioning of the specimen relative to the base of the manipulator (Figure 2.4). The tibial cylinder was mounted to the robot through the load cell, which was rigidly fixed to the end-effector of the robotic manipulator. After installing the specimen, a series of coordinate systems were created using a digitizing stylus (3DX, Microscribe, Immersion Technologies, San Jose, CA, Figure
Load Cell
Robot
Tibia
Femur
Hamstrings
Quadriceps
load
load
Figure 2.4. The robotic testing system consists of a robotic arm and a six
degrees-of-freedom load cell. The femur is fixed to a pedestal and the tibia is
attached to the end of the robotic arm. Muscle loads are applied via the
system of ropes and pulleys.
RLOADCE
RTOOL
RKNEE
Digitizing
Stylus
Figure 2.5. The digitizing stylus used to create coordinate systems on the
knee joint
(RKNEE),the load cell
(RLOADCELL),the end of the robotic arm
(RTOoL). The relative position and orientation of the tool coordinate system
relative to the base (RBASE) is controlled by the robot.