Publisher’s version / Version de l'éditeur:
Analytical Atomic Spectrometry, 25, 3, pp. 384-389, 2010-03-01
READ THESE TERMS AND CONDITIONS CAREFULLY BEFORE USING THIS WEBSITE.
https://nrc-publications.canada.ca/eng/copyright
Vous avez des questions? Nous pouvons vous aider. Pour communiquer directement avec un auteur, consultez la Questions? Contact the NRC Publications Archive team at
PublicationsArchive-ArchivesPublications@nrc-cnrc.gc.ca. If you wish to email the authors directly, please see the first page of the publication for their contact information.
NRC Publications Archive
Archives des publications du CNRC
This publication could be one of several versions: author’s original, accepted manuscript or the publisher’s version. / La version de cette publication peut être l’une des suivantes : la version prépublication de l’auteur, la version acceptée du manuscrit ou la version de l’éditeur.
For the publisher’s version, please access the DOI link below./ Pour consulter la version de l’éditeur, utilisez le lien DOI ci-dessous.
https://doi.org/10.1039/B926288A
Access and use of this website and the material on it are subject to the Terms and Conditions set forth at
Certification of natural isotopic abundance inorganic mercury reference
material NIMS-1 for absolute isotopic composition and atomic weight
Meija, Juris; Yang, Lu; Sturgeon, Ralph E.; Mester, Zoltán
https://publications-cnrc.canada.ca/fra/droits
L’accès à ce site Web et l’utilisation de son contenu sont assujettis aux conditions présentées dans le site
LISEZ CES CONDITIONS ATTENTIVEMENT AVANT D’UTILISER CE SITE WEB.
NRC Publications Record / Notice d'Archives des publications de CNRC:
https://nrc-publications.canada.ca/eng/view/object/?id=d93ba238-b22f-44d5-8002-f78affac43b3 https://publications-cnrc.canada.ca/fra/voir/objet/?id=d93ba238-b22f-44d5-8002-f78affac43b3
Certification of natural isotopic abundance inorganic mercury reference
material NIMS-1 for absolute isotopic composition and atomic weight
Juris Meija, Lu Yang, Ralph E. Sturgeon and Zoltán MesterInstitute for National Measurement Standards, National Research Council Canada, Ottawa, ON, Canada K1A 0R6
Email: juris.meija@nrc.ca
ABSTRACT
A candidate reference material of natural isotopic composition for inorganic mercury has been characterized by the Institute for National Measurement Standards of the National Research Council Canada. The material, derived from NIST SRM 3133 and designated NIMS-1 (natural inorganic mercury standard) is certified for isotope ratios, isotopic abundances and atomic weight of mercury. The certification was achieved using multi-collector ICP-MS based on a state-of-the-art regression model for calibration. The certified isotopic composition is x(196) = 0.001 55(4), x(198) = 0.100 38(10), x(199) = 0.169 38(9),
x(200) = 0.231 38(6), x(201) = 0.131 70(12), x(202) = 0.297 43(9) and x(204) = 0.068 18(6)
with the corresponding atomic weight of mercury Ar(Hg) = 200.5924(8). Values are
presented in a concise notation whereby the expanded uncertainty with a coverage factor of two is given in parenthesis next to the least significant digits to which it applies. A full disclosure of all supplementary material pertinent to certification is presented in order to afford a fully transparent process. Care was taken to ensure high metrological quality in the evaluation of the accuracy and the uncertainty of the certified results. In this regard, it is superior to the best measurement from a single terrestrial source as currently recognized by IUPAC. Considering the known natural variations of Hg isotopic composition, we propose 200.592(3) as a revised assessment of the standard atomic weight of mercury.
1. INTRODUCTION
With the advent of multi-collector ICP-MS in late 1990’s, chemists were able to gain access to the fine variations of isotopic composition of mercury at environmentally relevant concentrations for the first time.1However, obtaining absolute isotope ratios of mercury
remains a challenge in analytical chemistry. Lack of suitable absolute standards for isotopic composition of mercury forces analysts to perform mainly comparative isotope ratio measurements or rely on imperfect calibration strategies. For example, the traditional Hg isotope ratio correction model borrowed from classical thermal ionization mass spectrometry (TIMS) frequently uses a simultaneously measured 205Tl/203Tl ratio for exponential mass bias
correction and is known to produce erroneous Hg isotope ratios, even up to half a per cent [sic] for the most abundant pair, 202Hg/200Hg.2Hence, the 0.005% precision to which the 202Hg/200Hg ratio can be routinely measured is overwhelmed by a two-order of magnitude
larger instrumental bias. Hence, it is fair to say that the accuracy of the measurement results, not the precision, embodies the largest impediment towards consistent mercury isotope ratio measurement results. In this light, we have undertaken a certification of Hg isotope ratios using a mass-bias correction model determined to be superior to the conventional exponential model.
To date, no certified mercury reference material is available to the isotope fractionation community for the purpose of mass-bias calibration or interlaboratory comparison. Consequently, there is a need to establish an international standard for precise Hg isotope measurements.3, 4 The National Institute of Standards and Technology (NIST, USA)
reference material SRM 3133 has been widely adopted as the delta zero for comparative isotope ratio measurements and here we provide absolute isotope ratio values for this material. Moreover, in 2007 Blum and Bergquist recommended this reference material be adopted as the international comparator and made available a preliminary set of data characterizing the isotope ratios in this material.5
2. EXPERIMENTAL
2.1. Reagents
SRM 3133 (mercury standard solution) and SRM 997 (Thallium isotopic standard) were purchased from the National Institute for Standards and technology (Gaithersburg, MD, USA). High purity 18 MΩ cm deionized water was generated using a mixed bed ion-exchange system supplied with reverse osmosis feedstock (NanoPure, model D4744, Barstead/Thermoline, Dubuque, IA). High purity HCl and HNO3 were prepared by
sub-boiling distillation of reagent grade feedstocks in a quartz still. BrCl reagent, used as a preservative was prepared in accordance with US EPA recommendations.16
2.2. Preparation of materials
A two liter volume of candidate reference material having nominal inorganic mercury mass fraction of 5 μg g–1was prepared by dilution of NIST SRM 3133 with water and sufficient
high-purity BrCl was added as a stabilizer to result in a volume fraction of 0.5%. The resultant solution was aliquoted into carefully precleaned 2 mL amber glass ampoules which were subsequently flame-sealed. An approximate 1000 μg g–1solution of SRM 997 Tl was
prepared by dissolution of a nominal 0.25 g subsample in high-purity HNO3in a precleaned
polytetrafluoroethylene beaker, diluted to 250 g and stored in a precleaned screw-capped polypropylene bottle. Serial dilutions with 2% HNO3were undertaken prior to use.
2.3. Certification
Determination of Hg isotope ratios. Mercury isotope signal intensities were collected with a
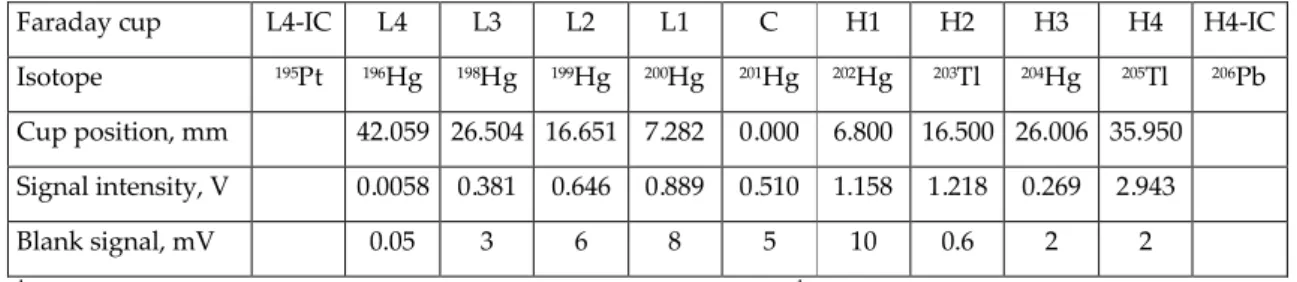
Thermo Fisher Scientific Neptune multi-collector inductively coupled plasma mass spectrometer (Bremen, Germany) equipped with nine Faraday cups and four ion counters. Table 1 summarizes the positions of the detectors used in this work. The gain on each Faraday cup was monitored daily to ensure correction for its efficiency. Detector cross-calibration between Faraday cups and ion counters was performed periodically in accordance with the manufacturer’s instructions.
A combination of cyclonic and Scott-type spray chambers with a self-aspirating nebulizer (MCN50 Elemental Scientific, Appleton WI, USA) operating at 50 µL min–1were used for
all measurements.
Intensities of Hg isotopes obtained from a blank solution containing 2% HCl and 2 mM BrCl were subtracted from those of all samples (see Table 1). Isotope ratio data were calculated following simultaneous collection of all Hg (seven isotopes) and Tl ion beams (two isotopes) in a static measurement sequence. The analyses utilized 5 blocks of 10 cycles of 33.5 s. The duration of each session of measurements was on the order of 10–15 h. Data sets evaluated here were collected between November 2007 and January 2008. The mass fraction of mercury in the solutions used for the measurements was 400 ng g–1.
Sample preparation. Sample preparation was conducted in a clean hood. Test samples were
prepared by serial dilution of the candidate reference material (NIMS-1) in 2% HCl containing 2 mM BrCl followed by spiking with thallium standard reference material (NIST SRM 997) to yield mercury and thallium mass fractions of 400 and 100 ng g–1, respectively.
3. DISCUSSION
3.1. Certification of candidate reference material NIMS-1
3.1.1. Characterization
Spectral interferences. Signal intensities were corrected for any minor isobaric interferences
arising from 196Pt (on 196Hg), 198Pt (on 198Hg), and 204Pb (on 204Hg) based on the
simultaneously measured 195Pt and 206Pb signals by the ion counters. Signal intensities for Pt
and Pb were less than 450 counts per second in diluted solutions of NIMS-1 and exerted no detectable influence on corrected Hg isotope ratios. Natural isotopic composition (IUPAC) was assumed for 195Pt/196Pt, 195Pt/198Pt and 206Pb/204Pb ratios. Ion counters and Faraday cups
were cross-calibrated in accordance with the manufacturer’s recommended procedures. No detectable formation of hydride ions was evident.
Mass-bias correction. A standard operating procedure for Hg isotope ratio mass-bias
the observed Hg isotope ratios according to the exponential fractionation law.5Such a model
assumes identical mass bias for mercury and thallium—an assumption known to generate inaccurate results.2-4, 6-8 To date, this bias cannot be properly accounted for; therefore,
measurements performed using this particular calibration approach can only provide isotope ratios that are procedurally defined and are thus not firmly linked to the Système
international d’unités (SI). We note here that the only reference material certified for Hg
isotope ratios and abundances (IRMM-AE639) falls into this category. For this reason, we utilized an alternative isotope ratio calibration approach first introduced by Maréchal et al. in 1999.9 According to this strategy, the mass-bias corrected isotope ratios of mercury are
obtained from the log-linear temporal drifts in the measured Hg and Tl isotope ratios.2, 4
Such drift can be described using the following equation:
/198 Tl
lnri ai bilnr , (1)
where aiand biare the least squares estimates of the log-linear drift. The characterization process for the isotope ratios of Hg can be described by the following model equation:6
/198 i Tli
a b
i
R e R , (2)
where Ri/198are the mass-bias corrected isotope ratios of mercury, n(iHg)/n(198Hg), and R Tlis
the 205Tl/203Tl isotope ratio used for calibration. The calculated regression parameters
provide unbiased estimates of the mercury isotope ratios traceable to the SI via the known isotope ratio for thallium—in our work RTl= 2.38714(102), as certified by NIST (U = ku, k =
2). A requisite of the regression model is that no deviations from the linear relationship between lnri/198and lnrTlare observed, which holds true for all Hg-Tl measurement results
with a typical relative uncertainty for the slope a200= 2%. Detailed analysis of this equation
has recently been given by Meija et al.6
A recent report by Yang and Sturgeon utilized a two-step hybrid calibration strategy for the characterization of Hg isotope ratios in NIST-3133 material: the Hg-Tl regression model was first implemented to obtain the 202Hg/200Hg ratio and then followed the exponential
correction of all other Hg isotope ratios.2Because deviations in the fractionation functions
isotopes6, this approach must be amended with full application of the Hg-Tl regression
model to calibrate each Hg isotope ratio. Such strategy was followed in this work.
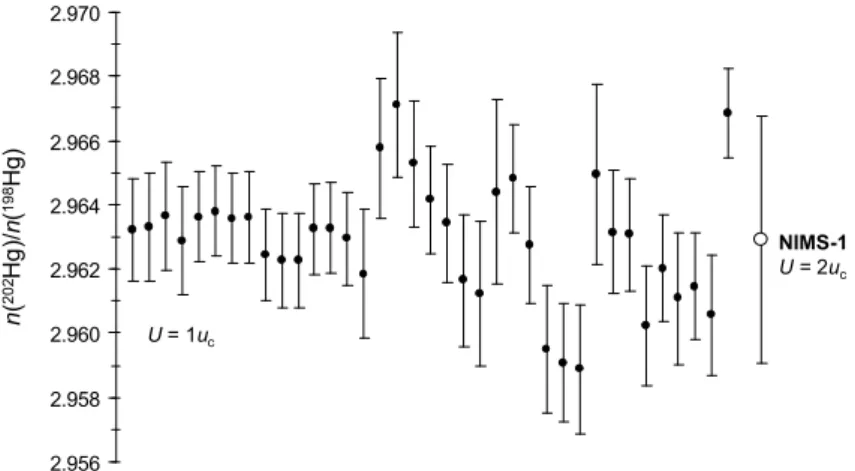
During the three-month period between November 2007 and January 2008, thirty-seven isotope ratio regressions were acquired for Hg isotope ratios 196Hg/198Hg…204Hg/198Hg vs. 205Tl/203Tl, each yielding the respective intercepts and slopes. These sets were then converted
into Hg isotope ratios, Ri/198, utilizing Eq. (2). The results for the 202Hg/198Hg ratio are
summarized in Figure 1. Isotope abundances and the atomic weight of mercury were calculated using the definitions of these variables10:
/198 /198 i i j j R x R
, (3) r(Hg) j j j A
m x . (4)The calibration approach chosen here departs from using gravimetrically prepared mixtures of enriched isotope of the element.11Rather, it is based on a detailed understanding of the
measurement process as described in detail elsewhere.6In particular, the regression model is
based on the observed temporal drift of the isotope ratio, thereby explicitly avoiding making the incorrect assumption regarding the equality of Hg and Tl fractionation functions—a requirement necessary for the application of the exponential mass-bias correction model.4, 12
In this vein, the values for the isotopic composition and atomic weight of mercury can be considered fully calibrated and traceable to the SI.
Linearity. Calibration non-linearity arises due to deviations from proportionality between the
ion current ratios and isotope amount ratios. Such effects have to be considered when calibration functions cover a significant range in the measured isotope ratios. The regression method, however, relies on the small drifts in signal, on the order of 10–3; therefore,
non-linearity effects are irrelevant, at least at the level of precision attained here.
3.1.2. Uncertainty evaluation
Overall characterization uncertainty. The uncertainty of the isotope ratio estimates as per
experiments. This is due to the fact that Eq. (2) is evaluated using the mean value of RTland
therefore the uncertainty due to RTlis omitted. While the uncertainty contribution from RTlis
frequently neglected in the literature,3-5, 13, 14 such practice is inappropriate. In principle,
simple heuristics can be used to estimate the lowest possible uncertainty of any Hg isotope ratio, Ri/j, due to the inherent uncertainty of the calibration ratio, Rc/d:
/
/ / / c d i j i j c d u R i j u R R R c d . (5)Here, i, j, c and d are the mass numbers of the nuclides. Thus, for example, the uncertainty of the ratio 200Hg/198Hg cannot be smaller than 0.0010 when using NIST SRM 933 thallium
standard for calibration. Likewise, the uncertainty in NIST RTl translates into a u(Ar) =
0.0006 (k = 2) for the (natural) atomic weight of mercury.
Inclusion of the u(RTl) can be achieved only by means of the random error propagation.
Note also that the regression parameters ai and bi cannot be considered independent variables. Instead, these are perfectly anti-correlated variables, i.e. ρ(ai, bi) = –1; therefore, the conventional variance propagation of the Eq. (2) leads to the following:
2 2 Tl 2 2 /198 /198 /198 Tl Tl ln i i i a b u R u R bR R u R u R . (6)Since the isotope ratios are correlated variables, uncertainty of the isotope abundances and atomic weight were evaluated using the uncertainty propagation approach as described by Meija and Mester.15, 16To wit, the Hg isotope ratio covariance matrix was evaluated from
Eq. (2) using the variance-covariance propagation, which leads to the following uncertainty of the mass-bias corrected mercury isotope ratio, Ri/198, for an individual Tl-Hg regression:
R JRuR Tl
2 J
R T J
regregJreg
T , (7) where 196 196/198 /198 Tl Tl 204 204/198 1 i R b R R R R b R J and (8)
204 204 /198 /198 /198 Tl /198 196 ln 196 i i reg i i i i i i R R R R R a b J . (9)
Here is a matrix direct sum operator. For example,
1 3 2 1 3 0 0 0 0 0 0 i i R R R R . (10)
The thallium isotope ratio, RTl, is treated as independent of ai and bi; therefore, the
covariance matrix of the regression variables takes the following form: 2 2
i i i i i i a a b i i reg a b b i iu
u u
u u
u
. (11)Combining Eqs. (8)–(11) into Eq. (7) yields the isotope ratio covariance matrix,R, whose diagonal entries are squared isotope ratio uncertainties. These values can be compared to Eq. (6). Similarly, the uncertainty of isotopic abundances is obtained from the isotope ratio covariance matrix: x JxRJxT, (12) where 196/198 198 204/198 204 x R x R x J . (13)
Details of this equation can be found elsewhere.16Finally, the uncertainty of atomic weight
was calculated as follows:15
r 2 (Hg) T T m x A u x x m m, (14)
where x = [x 196, …, x204]Tand m = [m 196, …, m204]T. Using this approach, each regression
plot yields a set of Hg isotope ratios, isotope abundances and atomic weight with the corresponding uncertainties for each estimate. The average of all regression experiment results is then obtained which serves as the property value for all measurands. The combined
uncertainty of the grand mean, uc, was obtained by combining the uncertainties of the
individual estimates and the variations between these means as per recent guidelines of NIST—the Type B model of the bias method.17The following equation was used:
uc sm2 1
p ui
2
, (15)where smis the standard deviation of the p means (p = 37) and uiis the uncertainty of the
individual measurand estimates, i = [1…p].
Heterogeneity contribution to uncertainty. The above uncertainty evaluation addresses only
two sources of uncertainties—those of the characterization and calibration (regression uncertainty and uncertainty of the 205Tl/203Tl ratio). In addition to this, it is useful to assess
the contributions due to the bottle-to-bottle inhomogeneity of the property values. This can be achieved by analyzing a selected number of bottles in conjunction with the mathematical decomposition of the obtained uncertainty estimates (analysis of variance, ANOVA). Fourteen bottles were randomly sampled for the analysis of relative variations in the isotopic composition of mercury. Of these, one bottle was randomly chosen as an internal standard and isotope ratios, 196Hg/198Hg…204Hg/198Hg were determined (in triplicate) with respect to
this standard bottle using a standard-sample-standard bracketing approach. Results were then interpreted using ANOVA. Details of the ANOVA approach for certified reference materials are described elsewhere.18, 19The contribution to combined uncertainty arising from
bottle-to-bottle inhomogeneity was found to be insignificant. Potential instabilities derived from effects relating to long-term storage and transport were not considered, as it is believed that such effects would not be isotope specific.
3.1.3. Summary
The certified property values of the isotope ratios, isotopic composition and atomic weight of mercury are given in Table 3. The values summarized here can be considered as a refinement of earlier work by Yang and Sturgeon2in light of the recent findings by Meija et al.6The
good agreement with the recent mass spectrometric measurements of Blum et al.5who report
200.5925 (no claimed uncertainty) for NIST SRM 3133. Table 3 summarizes several recently published Hg ratio measurements using MC-ICP-MS. For comparison purposes, we have also included our results derived with the exponential Hg-Tl calibration model. Note, however, that the systematic bias introduced by using the exponential correction law to commutate between the mass-bias of Hg and Tl is not constant. Rather, its magnitude depends on the concentration of Hg and Tl used for measurements, as recently shown by Yang and Sturgeon2and can account for the bias of up to 0.010 Da in the atomic weight of
mercury.
To achieve maximum transparency and traceability of the measurement results, this manuscript is accompanied by an electronic supplementary data file (Microsoft Excel format) containing all measurement results and calculations contributing to the certified property values.
3.2. Standard atomic weight of mercury
Since 1989, the standard atomic weight of mercury has been accepted as 200.59(2)—a value largely based on the (uncalibrated) measurements reported by Zadnik et al.10, 20Unlike lead,
mercury has no radiogenic sources, therefore any variations in the isotopic composition of mercury arise from natural fractionation processes. Such variations have been extensively studied using NIST SRM 3133 material as the comparative standard.2, 5, 21-23
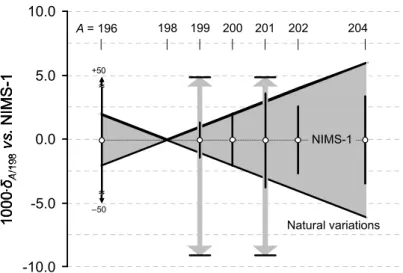
Mass-independent variations of 202Hg/198Hg ratio span –4…+4 per mill relative to SRM 3133 (and
now NIMS-1).22, 24, 25 For mercury isotopes having odd mass number (199Hg and 201Hg),
however, larger variations have been observed—both in the range of –9…+5 per mill relative to SRM 3133.21-23 Recent work of Jackson et al. 26 reports similar magnitude of
mass-dependent and -inmass-dependent Hg isotope variations in aquatic ecosystems, when converted to the scale as in Figure 2. Because our reference material is, in fact, derived from SRM 3133 without alteration, the observed relative variations can be readily incorporated into the certified atomic weight. A coverage factor of k = 4 to the expanded uncertainty of the certified Hg atomic weight in NIMS-1 effectively covers the observed mass-dependent and
mass-independent variations of Hg isotope ratios, as evident in Figure 2, which portrays the natural variations of Hg isotopic composition referenced against the certified isotope ratios in NIMS-1. This, in turn, provides a refined estimate of the standard atomic weight of mercury:
Ar(Hg) = 200.592(3). This value is also in good agreement with the ‘chemical values’ of the
Harvard method.10 We exclude from the consideration the discordant Hg atomic weight
estimate by the European Institute for Reference Materials and Measurements (IRMM)27,
200.604(3), since this value is, in our opinion, significantly biased, likely due to utilization of the linear mass Hg-Tl bias correction model for calibration.
ACKNOWLEDGEMENTS
The authors thank Scott Willie for invaluable assistance in the preparation of NIMS-1. We also acknowledge the significant contribution of the research teams of D. Baxter (Analytica AB, Sweden), L. Halicz (Geological Survey of Israel) and H. Hintelmann (Trent University, Canada) for their support during the early stages of the NIMS-1 characterization.
REFERENCES
1. L. Yang, Mass Spectrom. Rev., 2009, 28, 990-1011.
2. L. Yang and R. E. Sturgeon, Anal. Bioanal. Chem., 2009, 393, 377-385. 3. W. I. Ridley and S. J. Stetson, Appl. Geochem., 2006, 21, 1889-1899.
4. Q. Xie, S. Lu, D. Evans, P. Dillon and H. Hintelmann, J. Anal. At. Spectrom., 2005, 20, 515-522.
5. J. D. Blum and B. A. Bergquist, Anal. Bioanal. Chem., 2007, 388, 353-359. 6. J. Meija, L. Yang, R. Sturgeon and Z. Mester, Anal. Chem., 2009, 81, 6774-6778. 7. F. Albarede, P. Telouk, J. Blichert-Toft, M. Boyet, A. Agranier and B. Nelson,
Geochim. Cosmochim. Acta, 2004, 68, 2725-2744.
8. W. M. White, F. Albarede and P. Telouk, Chemical Geology, 2000, 167, 257-270. 9. C. N. Marechal, P. Telouk and F. Albarede, Chemical Geology, 1999, 156, 251-273. 10. J. R. De Laeter, J. K. Böhlke, P. De Bièvre, H. Hidaka, H. S. Peiser, K. J. R. Rosman
and P. D. P. Taylor, Pure Appl. Chem., 2003, 75, 683-800.
11. E. Ponzevera, C. R. Quétel, M. Berglund, P. D. P. Taylor, P. Evans, R. D. Loss and G. Fortunato, J. Am. Soc. Mass Spectrom., 2006, 17, 1413-1428.
12. M. Rehkämper and A. N. Halliday, Int. J. Mass Spectrom., 1998, 181, 123-133. 13. D. S. Lauretta, B. Klaue, J. D. Blum and P. R. Buseck, Geochim. Cosmochim. Acta,
2001, 65, 2807-2818.
14. D. R. Evans, H. Hintelmann and P. J. Dillon, J. Anal. At. Spectrom., 2001, 16, 1064-1069.
15. J. Meija and Z. Mester, Metrologia, 2008, 45, 459-463. 16. J. Meija and Z. Mester, Metrologia, 2008, 45, 53-62.
17. M. S. Levenson, D. L. Banks, K. R. Eberhardt, L. M. Gill, W. F. Guthrie, H. K. Liu, M. G. Vangel, J. H. Yen and N. F. Zhang, Journal of the Research of the national
Institute of Standards and Technology, 2000, 105, 571-579.
18. T. Linsinger, J. Pauwels, A. van der Veen, H. Schimmel and A. Lamberty, Accred.
Qual. Assur., 2001, 6, 20-25.
19. A. M. H. van der Veen, T. Linsinger and J. Pauwels, Accred. Qual. Assur., 2001, 6, 26-30.
20. M. G. Zadnik, S. Specht and F. Begemann, Intl. J. Mass Spectrom. Ion Proc., 1989, 89, 103-110.
21. W. Zheng and H. Hintelmann, Geochim. Cosmochim. Acta, 2009, 73, 6704-6715. 22. B. A. Bergquist and J. D. Blum, Science, 2007, 318, 417-420.
23. N. Ganther, H. Hintelmann, W. Zheng and D. C. Muir, Environ. Sci. Technol., 2009, advanced article.
24. D. Foucher and H. Hintelmann, Anal. Bioanal. Chem., 2006, 384, 1470-1478. 25. T. Zambardi, J. E. Sonke, J. P. Toutain, F. Sortino and H. Shinohara, Earth Planet.
Sci. Lett., 2009, 277, 236-243.
26. T. A. Jackson, M. D. Whittle, M. S. Evans and D. C. G. Muir, Appl. Geochem., 2008, 23, 547-571.
28. G. Audi, A. H. Wapstra and C. Thibault, Nuclear Physics A, 2003, 729, 337-676. 29. J. K. Böhlke, J. R. De Laeter, P. De Bièvre, H. Hidaka, H. S. Peiser, K. J. R. Rosman
Table 1
MC-ICP-MS Detector configuration and typical signal intensities obtained for sample1
and blank solutions
Faraday cup L4-IC L4 L3 L2 L1 C H1 H2 H3 H4 H4-IC
Isotope 195Pt 196Hg 198Hg 199Hg 200Hg 201Hg 202Hg 203Tl 204Hg 205Tl 206Pb
Cup position, mm 42.059 26.504 16.651 7.282 0.000 6.800 16.500 26.006 35.950
Signal intensity, V 0.0058 0.381 0.646 0.889 0.510 1.158 1.218 0.269 2.943
Blank signal, mV 0.05 3 6 8 5 10 0.6 2 2
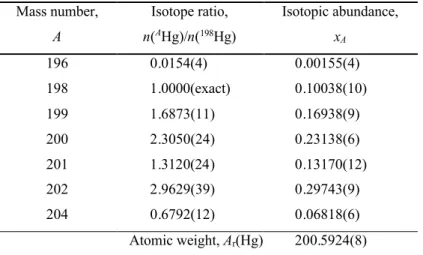
Table 2 Property values of the certified reference material NIMS-11
Mass number, A Isotope ratio, n(AHg)/n(198Hg) Isotopic abundance, xA 196 0.0154(4) 0.00155(4) 198 1.0000(exact) 0.10038(10) 199 1.6873(11) 0.16938(9) 200 2.3050(24) 0.23138(6) 201 1.3120(24) 0.13170(12) 202 2.9629(39) 0.29743(9) 204 0.6792(12) 0.06818(6) Atomic weight, Ar(Hg) 200.5924(8)
1Values are presented in a concise notation whereby the expanded uncertainty is given in parenthesis next
to the least significant digits to which it applies; for example, x204= 0.06818(6) is the concise form of the
expression x204 = 0.06818 ± 0.00006. It is intended that the expanded uncertainty encompasses every
aspect that reasonably contributes to the uncertainty of the property value. A coverage factor of two (2) was applied. Atomic masses used for calculation are from the 2003 Atomic mass evaluation.28
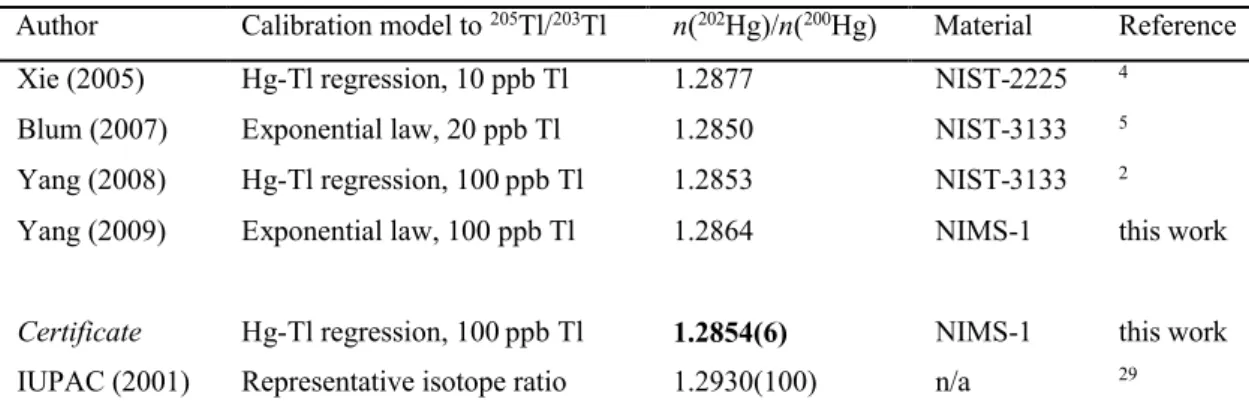
Table 3 Selected MC-ICP-MS 202Hg/200Hg isotope ratio measurement results1
Author Calibration model to 205Tl/203Tl n(202Hg)/n(200Hg) Material Reference
Xie (2005) Hg-Tl regression, 10 ppb Tl 1.2877 NIST-2225 4
Blum (2007) Exponential law, 20 ppb Tl 1.2850 NIST-3133 5
Yang (2008) Hg-Tl regression, 100 ppb Tl 1.2853 NIST-3133 2
Yang (2009) Exponential law, 100 ppb Tl 1.2864 NIMS-1 this work
Certificate Hg-Tl regression, 100 ppb Tl 1.2854(6) NIMS-1 this work
IUPAC (2001) Representative isotope ratio 1.2930(100) n/a 29 1Due to inappropriate and/or incomplete uncertainty evaluation, the original reported isotope ratio
2.956 2.958 2.960 2.962 2.964 2.966 2.968 2.970 n ( 2 0 2H g )/ n( 1 9 8H g) U = 1uc NIMS-1 U = 2uc
Figure 1. Individual measurement results for n(202Hg)/n(198Hg) in NIMS-1 candidate
-10.0 -5.0 0.0 5.0 10.0 A = 196 198 199 200 201 202 204 10 0 0 .δ A /1 98 vs . N IM S -1 ≈ ≈ –50 +50 NIMS-1 Natural variations -10.0 -5.0 0.0 5.0 10.0 A = 196 198 199 200 201 202 204 10 0 0 .δ A /1 98 vs . N IM S -1 -10.0 -5.0 0.0 5.0 10.0 A = 196 198 199 200 201 202 204 10 0 0 .δ A /1 98 vs . N IM S -1 ≈ ≈ –50 +50 NIMS-1 Natural variations
Figure 2. Natural variations of Hg isotopic composition and the certified isotope ratios in NIMS-1.
Range of natural variations, depicted as shaded bowtie, is compiled from Zheng and Hintelmann (2009)21, Bergquist and Blum (2007)22, Zambardi et al. (2009)25, Foucher and