HAL Id: hal-00012522
https://hal.archives-ouvertes.fr/hal-00012522
Preprint submitted on 24 Oct 2005
HAL is a multi-disciplinary open access
archive for the deposit and dissemination of
sci-entific research documents, whether they are
pub-lished or not. The documents may come from
teaching and research institutions in France or
abroad, or from public or private research centers.
L’archive ouverte pluridisciplinaire HAL, est
destinée au dépôt et à la diffusion de documents
scientifiques de niveau recherche, publiés ou non,
émanant des établissements d’enseignement et de
recherche français ou étrangers, des laboratoires
publics ou privés.
Olivier Chesneau, Thomas Rivinius
To cite this version:
ccsd-00012522, version 1 - 24 Oct 2005
Long Baseline Interferometry of Be Stars
A Basic Introduction and First Results from MIDI/VLTI
O. Chesneau1,2 , Th. Rivinius3
1 Max-Planck-Institut f¨ur Astronomie, K¨onigstuhl 17, 67117, Heidelberg, Germany;
2Observatoire de la Cˆote d’Azur, D´epartement Gemini UMR 6203, Avenue Copernic, F-06130 Grasse, France 3Landessternwarte K¨onigstuhl, 69117 Heidelberg, Germany;
We give an introduction to interferometrical concepts and their applicability to Be stars. The first part of the paper concentrates on a short historic overview and basic principles of two-beam interferometric observations. In the second part, the VLTI/MIDI instrument is introduced and its first results on Be stars, obtained on α Ara and δ Cen, are outlined.
Keywords: Optical interferometry – Be stars
1
Introduction
In the recent past, optical interferometry has made the greatest impact in the area stellar astrophysics, in particular the study of nearby single stars. Be stars are hot stars that exhibit, or have exhibited the so-called Be phenomenon, i.e. Balmer lines in emission and infrared excess, interpreted as an equatorial disk around these objects. Be stars are relatively frequent among the B-type objects, and therefore, many bright and close Be stars are known.
These stars have been preferred targets for long baseline interferometry since long, and the Be com-munity has followed the new developments of optical long baseline interferometry to study the circumstel-lar environments of Be stars with great interest (see also the recent review of Stee & Gies 2004).
The first environment resolved was the one of γ Cas. Thom et al. (1986) used the I2T for this, and Mourard et al. (1989) saw evidence for a rotating circumstel-lar environment by inspecting the visibility across the line itself using the GI2T.
These results clearly demonstrated the potential of observations that combine spectral and spatial res-olution, but also that extensive modeling is required to interpret measurements obtained with very limited sampling of the uv-plane. The first model specialized for this task was the one developed by Stee & de Araujo (1994) and Stee et al. (1995). Their model represents the environment of a Be star as an ax-isymmetric structure, based on a latitude-dependant radiatively driven wind. The model confirms that its free parameters can be constrained by comparison of predicted line profiles and visibilities.
With a good range of baselines, the Mark III instru-ment was able to determine the geometrical aspect of seven Be stars, i.e. the axial ratio of their elongated Hα circumstellar emission region (Quirrenbach et al., 1993a, 1994, 1997). The axial ratios r span a wide range, with r < 0.5 for φ Per, ψ Per and ζ Tau, an intermediate ellipticity (r = 0.7) for γ Cas, and r ∼ 1 for η Tau and 48 Per. In the disk model for Be stars, this can easily be understood as an inclination effect. The strong correlation of the minimum inclination de-rived in this way with polarimetric estimates supports the geometrically thin-disk hypothesis (Quirrenbach et al. 1997).
The Mark III was specifically designed to perform wide-angle astrometry, but a variable baseline that could be configured from 3m to 31.5m provided the flexibility needed for a variety of astronomical re-search programs. Mark III was the first interferome-ter having a full compuinterferome-ter control of the siderostats and delay lines which allowed almost autonomous ac-quisition of stars and data taking. This capability was an important factor for the calibration of instru-mental effects and for the scientific productivity of the instrument.
Among the stars investigated with Mark III were also γ Cas and ζ Tau. In their disks asymmetric Hα emission with respect to the central object was later uncovered with the GI2T instrument. Using spectral Differential Interferometry (DI) it has become possi-ble to monitor such structures of Be disks during a long time (several years) with great spatial resolution (Vakili et al. 1998, B´erio et al. 1999).
The field of optical and infrared (IR) interferom-etry has seen rapid technical and scientific progress
over the past decade and the interferometric efficiency improves now dramatically in the era of the Very Large Telescope Interferometer (VLTI). The design of ESO’s VLTI, which is the first large optical/IR tele-scope facility expressly designed with aperture syn-thesis in mind, is of a hybrid type: There are the four large 8.2 meter spatially fixed unit-telescopes, but ad-ditionally there will be four auxiliary telescopes of smaller, i.e. 1.8-meter aperture, which can be moved and set up at a large number of locations. Three re-combiners are attached to this structure: VINCI was foreseen to be a K band test instrument but has pro-vided such precise visibility measurements that nu-merous outstanding science results have been pub-lished from its observation. MIDI is the first direct recombiner operating in N band in the world, which is described extensively in the following. Finally, AM-BER, currently being in commissioning phase, is an impressive three-beam spectro-interferometer operat-ing in J, H and K bands with a spectral resolution reaching 10 000.
A challenge for the understanding of the Be star phenomenon is the rapid increase of our knowledge of the central star itself. Be stars are statistically rapid rotators and subject to a strong von Zeipel ef-fect (1924). In 2001, van Belle et al. (2001) observed Altair (HD 187642, A7V) using two baselines of the Palomar Testbed Interferometer (PTI). They calcu-lated the apparent stellar angular diameters from mea-sured squared visibility amplitudes using the uniform-disk model and found that the angular diameters change with position angle. This was the first measurement of stellar oblateness owing to rapid rotation. In par-allel, the observable consequences of this effect on the interferometric observation have been extensively studied by Domiciano de Souza et al. (2002) under the Roche approximation (uniform rotation and cen-trally condensed star). Two effects are competing affecting the interferometric signal: the geometrical distortion of the stellar photosphere and the latitudi-nal dependence of the flux related to the local gravity resulting from the von Zeipel theorem. The measure-ments from the PTI were not sufficient to disentan-gle between these two effects but recent observations using closure phases1 from the NPOI interferometer
reported in Ohishi et al. (2004) have confirmed the oblateness of the star and have evidenced a bright region attributed to the pole. The observations of Altair from PTI, NPOI and also from VLTI/VINCI cover now three spectral regions visible, H and K band and an extensive modeling of the star has been undertaken by A. Domiciano de Souza.
Altair is still a relatively cool and small star com-pared to the Be stars and its gravity surface remains
1
Closure phases are measured when at least three telescopes are operating simultaneously.
large, therefore larger effects of the rotation are ex-pected for Be stars. In 2003, the large oblateness of the Be star Achernar (α Eri) was measured with VLTI/VINCI (Domiciano de Souza et al. 2003). The measured oblateness of 1.56±0.05 based on equiva-lent Uniform Disk apparently exceeds the maximum distortion allowed in the Roche approximation and no models investigated by Domiciano de Souza et al. (2002) could be satisfactorily fitted to the ob-servations. These observations open a new area for the study of the Be phenomenon and VLTI/AMBER should take over this study and expand rapidly the number of target observed.
Recently, VLTI/MIDI observed two Be stars, α Ara (B3 Ve) and δ Cen (B2 IVne) from 8 to 13 µm with baselines reaching 100 m but their circumstellar en-vironment could not be resolved. These observations are also reported in this paper.
2
Basic Principles of Stellar
In-terferometry
This section will review the basic principles of stellar interferometry. More detailed discussions of optical interferometry issues can be found in the reviews by Monnier (2003) and by Quirrenbach (2001). In or-der to introduce the principles, we restrict ourselves to the case of a single interferometric baseline, i.e. with two telescopes only. We adopt the formalism of Domiciano de Souza et al. (2002) and reproduce here the equations necessary for an introduction to natural light interferometry.
2.1
Basic principles
Let us consider an astrophysical target located at the center of a Cartesian coordinate system (x, y, z). The system is oriented such that the y axis is defined as the North-South celestial orientation and the x axis points towards the observer.
Next, we define the sky-projected monochromatic brightness distribution Iλ(y, z), hereafter called
”in-tensity map”. Interferometers measure the complex visibility, which is proportional to the Fourier trans-form of Iλ(y, z), which shall be denoted eIλ(y, z). The
complex visibility in natural light can then be written as: V (fy, fz, λ) = |V (fy, fz, λ)| eiφ(fy,fz,λ) (1) = Ieλ(fy, fz) e Iλ(0, 0) (2)
where fyand fzare the Fourier spatial frequencies
as-sociated with the coordinates y and z. These spatial frequencies in long-baseline interferometry are given by ~Bproj/λeff, where λeff is the effective wavelength of
the spectral band considered and ~Bprojis a vector
rep-resenting the baseline of the interferometer projected onto the sky. The vector ~Bproj defines the direction
s, which forms an angle ξ with the y axis so that ~
Bproj= (Bprojcos ξ) by + (Bprojsin ξ) bz (3)
where by and bz are unit vectors. Note that large structure in image-space results in small structure in Fourier transformed, i.e. visibility-space.
We consider linear cuts along the Fourier plane corresponding to a given baseline direction bs. Then we can define the new spatial frequency coordinates (u, v) for which ~Bprojis parallel to the unit vector bu.
In that case the line integral (or strip intensity) of Iλ(s, p) over p for a given ξ can be written as:
e
Iλ,ξ(u) =
Z
Iλ,ξ(s)e−i2πsuds (4)
The complex visibility is given by:
Vξ(u, λ) = |Vξ(u, λ)| eiφξ(u,λ)=
eIλ,ξ(u)
eIλ,ξ(0)
(5)
By varying the spatial frequency (meaning the base-line length and/or wavelength), we obtain the so-called visibility curve. Eqs. 4 and 5 say that the in-terferometric information along ~Bproj is identical to
the one-dimensional Fourier transform of the curve resulting from the integration of the brightness dis-tribution in the direction perpendicular (bp) to this baseline. The interferometric observable, called visi-bility is directly related to the fringe contrast.
The visibility can be observed either as the fringe contrast in an image plane (as with AMBER) or by modulating the internal delay and detecting the re-sulting temporal variations of the intensity in a pupil plane (as done with VINCI or MIDI).
It should be stressed that the signal-to-noise ra-tio (SNR) of interferometric observables depends not only on the photon count N , but on N V2 for the
photon-noise limited regime (optical) and on N V for the background-limited regime (MIDI). Indeed, the interferometer is not sensitive to the total flux from the source but to the correlated one.
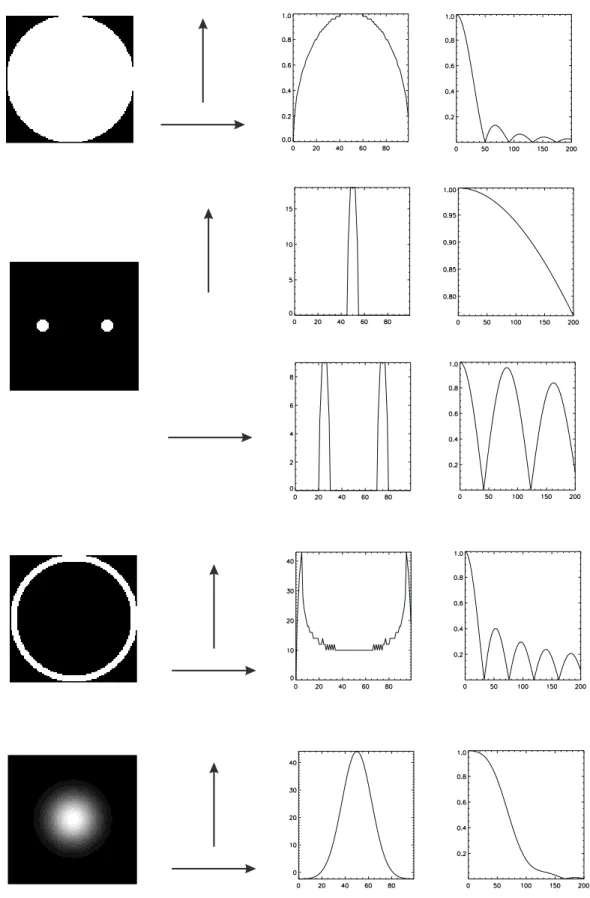
In Fig. 1 we show several examples of intensity maps and their corresponding visibility curves, de-pending on the baseline orientation. All models, ex-cept the binary, are symmetrical which means that the interferometer will provide the same visibility for a particular baseline length (projected onto the sky), whatever its direction. The second model shows the visibility curves from a binary system, consisting of two stars of the same diameter. In the case where the baseline is perpendicular to the binary’s position angle, the interferometer is unable to distinguish the two components and sees a visibility signal close to the one provided by a single uniform disk. When the
baseline is aligned with the binary’s PA, the binary signature is superimposed to the signature from the individual components.
The uniform ring structure is an interesting inter-mediate situation between the uniform disk and a bi-nary. The interferometer sees mainly a binary struc-ture and owing to the symmetry of the source, this signal is the same whatever the baseline direction. This example could appear quite artificial, yet it re-flects a geometry which can be encountered frequently in the inner rims of a Young Stellar Objects and even more evolved star’s disks.
Finally, we show the example of an object exhibit-ing a Gaussian distribution of light, like approximat-ing a circumstellar environment with outwards de-creasing emission. The Fourier transform of a Gaus-sian being a GausGaus-sian too, the visibility curve will not show the characteristic lobes which are seen in the other curves. It must be stressed out that these lobes are the consequence in the Fourier domain of a discontinuity of the light distribution in the image plane. For instance, a limb-darkened disk will exhibit a visibility curve with the lobes attenuated compared to the uniform disk case. One can, in fact, note a small lobe in the Gaussian visibility curve in Fig. 1. This is the consequence of the numerical truncation of the Gaussian, generating a discontinuity at the limit of the chosen Field-of-View.
Of course, for typical main sequence stars, this im-plies long baselines and it must be stressed that at this stage the contrast of the fringes is so low that this experiment is very demanding in terms of signal-to-noise ratio, i.e. in terms of target flux.
2.2
Differential Interferometry (DI)
Differential Interferometry (DI) uses the high angular resolution interferometric capabilities in a dispersed mode in order to compare the spatial properties of an object at different wavelengths (Vakili et al. 1994, 1997, 1998). This technique offers obvious advan-tages: over few nanometers, the (differential) atmo-spherical turbulence effects are negligible, and the dif-ferential sensitivity can be much better than expected by classical techniques. In interferometry, an unre-solved source is required for calibration, and such an object can be difficult to find. In particular cases, such as Be stars, the continuum can be regarded as unresolved, whereas emission lines emitted by an ex-tended circumstellar environment are angularly re-solved. Moreover, the continuum can be considered as a polarization reference in the Zeeman effect con-text.
The phase of the visibility is generally lost due to the blurring effect of the atmosphere, but DI can re-trieve a relative spectral phase. Some algorithms can compare the properties of the fringes studied in a
Visibility and phase as observational concepts Interference pattern of a monochromatic point-source
Polychromatic point-source
The interference patterns of the various colours add up to a spatial modulation of the pattern. Note that the amplitude at OPD=0, the “white-light
fringe” is still at maximum
Monochromatic extended source
The interference patterns from the local points add up to a pattern of reduced amplitude, independent
of the optical path difference (OPD), however.
Both principles combined give the fringe patterns as seen by interferometry. The “visibility”, holding the spatial extend of the investigated source is quantifying the amplitude, as in the right column. Suppose a source observed at two different wavelengths, one can obtain relative positional information by measuring whether the OPD for maximal positive interference has shifted. This concept is called “interferometric phase”
Figure 1: In this figure typical examples of intensity maps (left) are shown. From top to bottom these are a uniform disk, a resolved binary, a ring and a Gaussian distribution. The models are “observed” with a horizontal ad vertical baseline. The 1-D flux intensity along the baseline is shown in the middle and the corresponding visibility is displayed on the right. All units are arbitrary. A further description of visibility curves is given in the text.
(broad, i.e. continuum) reference spectral channel at wavelength λr with the ones in a (narrow, i.e.
spec-tral line) science channel at wavelength λs. This can
be performed by means of cross-correlation of a broad continuum channel with a series of narrow channels across the emission line as encountered in Be stars. These steps are then repeated with small wavelength shifts for both channels from the blue to the red wing of the line, starting and finishing in the continuum next to the line on both sides. Since the signal to noise ratio in the cross-correlations depends on the geometric mean of the number of photons in chan-nel r and chanchan-nel s, the interferometric signal can be safely estimated in the narrow channel even if the flux or the fringe visibility are very small in this channel. The accuracy of the phase determination, which allows to measure a position can be better than the actual resolution of the interferometer, but again the super-resolution power of cross-spectral density meth-ods apply, as long as the star is partially resolved (Chelli & Petrov 1995). For instance, a positive (neg-ative) relative phase indicates the position at the north (south) of the central star if the baseline is oriented North-South. The relative phase shift between to spectral channels is related to the photocenter of the object by the following first order equation:
φ(~u, λr, λs) = −2π~u.[~ǫ(λs) − ~ǫ(λr)]
Using the continuum fringes as reference for the phase one can, for instance, determine whether the light distribution in a spectral line is centered on this continuum, as any departure from symmetry, e.g. due to localized circumstellar emission or a magnetic field, causes a spectral phase effect. While the visibility is a quadratic estimator, the phase sensitivity depends linearly on the photon count.
Increasing theoretical predictions of photocenter po-sitions through emission or absorption lines are avail-able concerning the environment of stars (Stee et al. 1996, Dessart & Chesneau 2002) or the study of the underlying photosphere (Domiciano et al. 2002, 2004).
3
MIDI Interferometer
MIDI is the first 10 µm interferometric instrument worldwide using the full available atmospheric trans-mission window. Due to the MIR radiation of the environment and the optical setup itself, most of the instruments optics is inside a dewar and is cooled to cryogenic temperatures. The incoming afocal VLTI beams are combined on the surface of a 50:50 beam splitter, which is the heart of the instrument. Spec-tral information from 8 µm to 13.5 µm can be ob-tained by spectrally dispersing the image using a prism for low (R=30), or a grism for intermediate (R=270) spectral resolution. For source acquisition a field of
3” is available. This small area on the sky represents about 10 times the Airy disk of a single UT telescope. This field is useful especially in case of extended ob-jects like the S Doradus variable (also called LBV) η Car (Chesneau et al. 2004a) or some Herbig stars (like HD 100 546, Leinert et al. 2004).
MIDI measures the degree of coherence between the interfering beams (i.e. the object visibility) by artifi-cially stepping the optical path difference between the two input beams rapidly, using its internal delay lines. The result is an intensity signal modulated with time from which the fringe amplitude can be determined. The total (uncorrelated) flux is determined separately by chopping between the object and an empty region of the sky, and determining the source flux by sub-traction. In this mode MIDI is working like an usual mid-infrared camera. An example of a resulting im-age in case of the observation of η Carinae is shown in Chesneau et al. (2004a) which demonstrates the excellent imaging capabilities of the MIDI/VLTI in-frastructure, even if it sends the light via 31 mirrors and 5 transmissive elements until it reaches the de-tector.
Observing with an interferometer requires accurate preparation. Useful tools for that are simulation pro-grams like ASPRO (by the Jean-Mariotti Center, Fr.), SIMVLTI (by the MPIA Heidelberg, Ge.) or ESO’s VLTI visibility calculator. Those software packages make it possible to get an idea of the expected visi-bility values for given parameter setups. For further reference, the reader should also consult the MIDI web page at ESO2.
When planning observations with MIDI, a few con-straints have to be kept in mind. Of course, the object should be bright enough in the mid-IR to be mea-sured with MIDI. However, for self-fringe tracking, the source not only has to be bright enough in total, but there must be sufficient flux concentrated in a very compact (< 0.1′′) central region, to which then
the interferometric measurements will refer. Also, the visual brightness should be at least 16 mag, in order to allow the operation of the MACAO tip-tilt and adaptive optics system.
In addition, one has to consider that interferome-try with two telescopes of the VLTI in a reasonable time of several hours will provide only few measured points of visibility, i.e. only a few points where the Fourier transform of the object image is determined. The scientific programme has to be checked before whether its main questions can be answered on this basis (e.g. to determine the diameter of a star one does not need to construct an image of its surface).
2
4
Be stars observed by MIDI
4.1
α
Ara
The first VLTI/MIDI observations of the Be star α Ara show a nearly unresolved circumstellar disk in the N band (Chesneau et al. 2004b). α Ara (HD 158 427, B3 Ve) is one of the closest Be star with an estimated distance of 74pc±6pc, based on the Hipparcos par-allax, and color excesses E(V-L) and E(V-12 µm) among the highest of its class. The interferometric measurements made use of the UT1-UT3 projected baselines of 102 m and 74 m, at two position angles of 7◦ and 55◦, respectively. The object is mostly
un-resolved, putting an upper limit to the disk size in the N band of the order of φmax= 4 mas, i.e. 14 R⋆
at 74 pc and assuming R⋆ = 4.8R⊙, based on the
spectral type.
On the other hand, the density of the disk is large enough to produce strong Balmer emission lines. The SIMECA code developed by Stee (1995) and Stee & Bittar (2001) has been used for the interpreta-tion. Optical spectra from the Heros instrument, taken 1999, when the instrument was attached to the ESO-50cm telescope, and infrared ones from the 1.6m Brazilian telescope have been used together with the MIDI visibilities to constrain the system parameters. In fact, these two observations, spectroscopy vs. in-terferometry, put complementary constraints on the density and geometry of the α Ara circumstellar disk. It was not possible to find model parameters that at the same time are able to reproduce the observed spectral properties, both in the emission lines and in the continuum flux-excess, and the interferomet-ric null-result, meaning that the disk must be smaller than 4 mas.
However, the Hydrogen recombination line profiles of α Ara exhibit (quasi?)-periodic short-term vari-ations of the violet-to-red peak heights of the emis-sion profiles (V /R-variability, see Mennickent & Vogt, 1991 and this study). The radial velocity of the emis-sion component of the Balmer lines changes in a cyclic way as well in these lines. This may point to a pos-sible truncation of the disk by a putative companion, that could explain the interferometric observations.
Using the NPOI interferometer, Tycner et al. (2004) have recently studied the disk geometry of the Be star ζ Tau, which is also a well-investigated spectroscopic binary (P∼133d, K∼10 km s−1). They measured the
disk extension quite accurately to be well within the Roche radius. This suggests also that this disk may be truncated.
4.2
δ
Cen
δ Cen (HD 105 435, B2 IVe, F12µm=15.85 Jy), situated
at about 120 pc, is one of the very few Be stars which has been detected at centimeter wavelengths (Clark et al. 1998) and also the only star for which signifi-cant flux has been measured at 100µm (Dachs et al. 1988). These two measurements suggest an extended disk, contrary to the case of α Ara.
However, recent VLTI/MIDI observations of δ Cen during Science Demonstration Time (programme con-ducted by D. Baade) with a baseline of 91 m have not been able to resolve the disk of this object as well. It must be stressed out that these observations have been conducted under much better atmospheric ditions than those for α Ara, leading to a well con-strained upper limit of 4±0.5 mas for the equivalent Uniform Disk diameter.
This is roughly the same size as was determined for other Be stars using interferometry in the wavelength region of Hα. Note that for these Hα observations the baseline was much less than the one used here, about 40 m vs. 100 m. That both datasets still come up with the same angular resolution is due to the scaling of the spatial frequency with the effective wavelength introduced in Sect. 2.1.
Whether or not a Be star disc should be resolved in the near IR depends on the model one adopts for such a disk. Based on modelling of the Balmer-line emission, at least one model does predict a resolved disk, while others don’t (see Chesneau et al., 2005, for a detailed discussion). In this sense, even null-results provide important constraints to our understanding of Be star disks.
5
Conclusions
Although being null-results these observations, as oth-ers before, have shown the potential discriminating power of interferometric observations for the current open questions of Be star research.
Long baseline interferometry is now able to pro-vide a complete set of observations from the visible to the thermal infrared at high angular and spectral resolution, opening a new area for the study of the Be phenomenon. In particular, this technique is now able to study the complex interplay between fast rota-tor disrota-torted photospheres, affected by the von Zeipel effect and their direct surroundings by means of spec-trally resolved NIR observations and MIR ones. The Guaranteed Time Document of the VLTI/AMBER3 gives a good idea of the possibilities opened by this new instrument.
The first VLTI/MIDI observations of Be stars have demonstrated the need to use long baseline at these
3
wavelengths in order to resolve the disk of even the few closest (and brightest) Be stars. The VLTI 1.8 m Auxiliary Telescopes (ATs) AT1 and AT2 are cur-rently being commissioned at Paranal observatory and should be able to observe their first fringes in mid-2005. The ATs are movable telescopes which can project onto the sky a baseline from 8 to 200 m. Such long baselines should be perfectly suited for MIDI to study the inner disk of Be stars, and for AMBER to observe the star itself, whereas the shorter ones would allow AMBER to study the close environment from the photosphere to several stellar radii.
References
B´erio, P., Stee, Ph., Vakili, F., et al., 1999, A&A, 345, 203
Chelli, A., Petrov, R.G., 1995, A&A Sup. Ser. 109, 389 Chesneau, O., Min, M., Herbst, T. et al. 2004a, A&A,
submitted
Chesneau, O., Meilland, A., Stee, Ph et al. , 2004b, A&A, submitted
Clark J.S., Steele I.A., Fender R.P., 1998, MNRAS, 299, 1119
Dachs, J., Engels, D. and Kiehlin, R. 1988, A&A, 194, 167
Dessart, L. and Chesneau, O., 2002, A&A, 395, 209 Domiciano de Souza, A., Vakili, F., Jankov, S., 2002,
A&A, 393, 345
Domiciano de Souza, Kervella, P., Jankov, S. et al., 2003, A&A, 407, L47
Domiciano de Souza, A., Zorec, J., Jankov, S. et al. 2004, A&A, 418, 781
Leinert, Ch., van Boekel, R., Waters, L.B.F.M. 2004, A&A, 423, 537
Monnier, J. Reports on Progress in Physics, 2003, Vol. 66, 789-857
Mourard, D., Bosc, I., Labeyrie, A. et al. 1989, Nature, 342, 520
Ohishi, N., Nordgren, T.E. and Hutter, D.J. 2004, ApJ, 612, 463
Quirrenbach, A., Bjorkman, K.S., Bjorkman, J.E. et al., 1997, ApJ, 479, 477
Quirrenbach, A., 2001, Annual Review of Astronomy and Astrophysics, Vol. 39, 353-401.
Quirrenbach, A., Buscher, D.F., Mozurkewich, D. 1994, A&A, 283, L13
Quirrenbach, A., Hummel, C.A., Buscher, D.F. et al., 1993, ApJ, 416, L25
Stee, Ph., de Araujo, F.X., 1994, A&A, 292, 221
Stee, P., de Araujo, F. X., Vakili, F. 1995, A&A, 300, 219 Stee, P. 1996, A&A, 311, 945
Stee, P. & Gies, D. 2005, ASP Conf. Ser., in press Thom, C., Granes, P., Vakili, F., 1986, A&A, 165, L13 Tycner, Ch., Hajian, A.R., Armstrong, J.T. et al., 2004,
AJ, 127, 1194
Vakili, F., Mourard, D., Stee, Ph., et al. 1998, A&A, 335, 261
Vakili, F., Mourard, D., Bonneau, D., 1997, A&A, 323, 183
Vakili, F., Bonneau, D., Lawson, P.R., 1994, SPIE, 2200, 216
van Belle, G.T., Ciardi, D.R., Thompson, R.R. et al. 2001, ApJ, 559, 1155
![[DOC] UML Diagramme de classe | Télécharger PDF](data:image/gif;base64,R0lGODlhAQABAIAAAP///wAAACH5BAEAAAAALAAAAAABAAEAAAICRAEAOw==)