HAL Id: hal-01298089
https://hal.sorbonne-universite.fr/hal-01298089
Submitted on 5 Apr 2016
HAL is a multi-disciplinary open access
archive for the deposit and dissemination of
sci-entific research documents, whether they are
pub-lished or not. The documents may come from
teaching and research institutions in France or
abroad, or from public or private research centers.
L’archive ouverte pluridisciplinaire HAL, est
destinée au dépôt et à la diffusion de documents
scientifiques de niveau recherche, publiés ou non,
émanant des établissements d’enseignement et de
recherche français ou étrangers, des laboratoires
publics ou privés.
Distributed under a Creative Commons Attribution| 4.0 International License
αVβ3 integrin-targeted microSPECT/CT imaging of
inflamed atherosclerotic plaques in mice
David Vancraeynest, Véronique Roelants, Caroline Bouzin, François-Xavier
Hanin, Stephan Walrand, Vanesa Bol, Anne Bol, Anne-Catherine Pouleur,
Agnès Pasquet, Bernhard Gerber, et al.
To cite this version:
David Vancraeynest, Véronique Roelants, Caroline Bouzin, François-Xavier Hanin, Stephan Walrand,
et al.. αVβ3 integrin-targeted microSPECT/CT imaging of inflamed atherosclerotic plaques in mice.
EJNMMI Research, SpringerOpen, 2016, 6, pp.29. �10.1186/s13550-016-0184-9�. �hal-01298089�
O R I G I N A L R E S E A R C H
Open Access
α
V
β
3
integrin-targeted microSPECT/CT
imaging of inflamed atherosclerotic
plaques in mice
David Vancraeynest
1,5*, Véronique Roelants
2, Caroline Bouzin
3, François-Xavier Hanin
2, Stephan Walrand
2,
Vanesa Bol
2, Anne Bol
2, Anne-Catherine Pouleur
1,5, Agnès Pasquet
1,5, Bernhard Gerber
1,5, Philippe Lesnik
4,
Thierry Huby
4, François Jamar
2and Jean-Louis Vanoverschelde
1,5Abstract
Background:αVβ3-integrin is expressed by activated endothelial cells and macrophages in atherosclerotic plaques
and may represent a valuable marker of high-risk plaques. We evaluated99mTc-maraciclatide, an integrin-specific tracer, for imaging vascular inflammation in atherosclerotic lesions in mice.
Methods: Apolipoprotein E-negative (ApoE−/−) mice on a Western diet (n = 10) and normally fed adult C57BL/6 control mice (n = 4) were injected with99mTc-maraciclatide (51.8 ± 3.7 MBq). A blocking peptide was infused in three ApoE−/−mice; this condition served as another control. After 90 min, the animals were imaged via single-photon emission computed tomography (SPECT). While maintained in the same position, the mice were transferred to computed tomography (CT) to obtain contrast-enhanced images of the aortic arch. Images from both modalities were fused, and signal was quantified in the aortic arch and in the vena cava for subtraction of blood-pool activity. The aorta was carefully dissected after imaging for gamma counting, autoradiography, and histology.
Results: Tracer uptake was significantly higher in ApoE−/−mice than in both groups of control mice (1.56 ± 0.33 vs. 0.82 ± 0.24 vs. 0.98 ± 0.11, respectively; P = 0.006). Furthermore, higher tracer activity was detected via gamma counting in the aorta of hypercholesterolemic mice than in both groups of control mice (1.52 ± 0.43 vs. 0.78 ± 0.19 vs. 0.47 ± 0.3199mTc-maraciclatide %ID/g, respectively; P = 0.018). Autoradiography showed significantly higher tracer uptake in the atherosclerotic aorta than in the control aorta (P = 0.026). Finally, in the atherosclerotic aorta, immunostaining indicated that the integrin signal came predominantly from macrophages and was correlated with the macrophage CD68 immunomarker (r = 0.73).
Conclusions:99mTc-maraciclatide allows in vivo detection of inflamed atherosclerotic plaques in mice and may represent a non-invasive approach for identifying high-risk plaques in patients.
Keywords:αVβ3integrin, Maraciclatide, Vulnerable atherosclerotic plaque, SPECT imaging
Background
In the majority of cases, acute vascular events such as acute coronary syndrome or stroke are caused by the disruption of a vulnerable atherosclerotic lesion [1]. Compared to stable plaques,“rupture-prone” or “vulner-able” plaques regularly exhibit several features, such as
inflammation and neoangiogenesis [2]. Identifying ath-erosclerotic plaques before they rupture should therefore represent a major advance in the management of athero-sclerotic disease. Accordingly, invasive and non-invasive imaging techniques are under development for accur-ately detecting vulnerable plaques [3, 4].
The αVβ3 integrin is a ubiquitous receptor that is
expressed on a variety of cell types; it interacts with li-gands present in the extracellular matrix or expressed on the cell surface. This integrin plays a role in diverse biological processes. αVβ3integrin is detected in situ on
* Correspondence:david.vancraeynest@uclouvain.be
1Pôle de Recherche Cardiovasculaire (CARD), Institut de Recherche Expérimentale et Clinique (IREC), Université Catholique de Louvain, Brussels, Belgium 5Division of Cardiology, Cliniques Universitaires St-Luc, Avenue Hippocrate, 10-2881, B-1200 Brussels, Belgium
Full list of author information is available at the end of the article
© 2016 Vancraeynest et al. Open Access This article is distributed under the terms of the Creative Commons Attribution 4.0 International License (http://creativecommons.org/licenses/by/4.0/), which permits unrestricted use, distribution, and reproduction in any medium, provided you give appropriate credit to the original author(s) and the source, provide a link to the Creative Commons license, and indicate if changes were made.
macrophages in early and advanced atherosclerotic le-sions and could regulate macrophage functional mat-uration into foam cells [5]. In atherosclerotic plaques, both inflammatory cells (monocytes and macrophages) and activated endothelial cells associated with neoan-giogenesis can express αVβ3 integrin [6]. Therefore,
αVβ3 expression, which is a combined marker of both
inflammation and angiogenesis, may represent a use-ful imaging target for assessing plaque vulnerability. Several tracers for positron emission tomography (PET) and magnetic resonance imaging (MRI) that display highly specific binding to the αVβ3 integrin
have been successfully tested in animal models of vas-cular inflammation [7–9] and in human carotid ath-erosclerosis [10].
99m
Tc-maraciclatide (GE Healthcare, Amersham, UK) is a cyclic peptide that contains an arginine-glycine-aspartic acid (RGD) tripeptide sequence with a high af-finity for vitronectin αVβ3 integrin receptors [11]. This
single-photon emission computed tomography (SPECT) tracer has been shown to localize to inflammatory infil-trate associated with angiogenesis in a murine model of hindlimb ischemia-induced angiogenesis [12, 13] and in angiogenesis induced by local IGF-1 expression after myocardial infarction [14]. More recently, maraciclatide uptake was detectable by SPECT/computed tomography (CT) in chemically injured carotid arteries in mice [15]. The potential for imaging αVβ3 integrin expression in
atherosclerotic plaques with99mTc-maraciclatide in spon-taneous atherosclerotic mice remains unknown.
In the present study, we sought to evaluate99m Tc-mar-aciclatide for imaging vascular inflammation by studying
its in vivo uptake in the atherosclerotic mouse aorta. Uptake of the tracer in the vessel wall was validated via gamma counting and autoradiography. Specificity was confirmed with competition experiments.
Methods
Animal model and experimental design
The study group consisted of 4- to 8-week-old male apolipoprotein E (ApoE)−/− mice (n = 10) acquired from Taconic Europe (Lille Skensved, Denmark) and 4- to 8-week-old male C57BL/6 control mice (n = 4). ApoE−/−
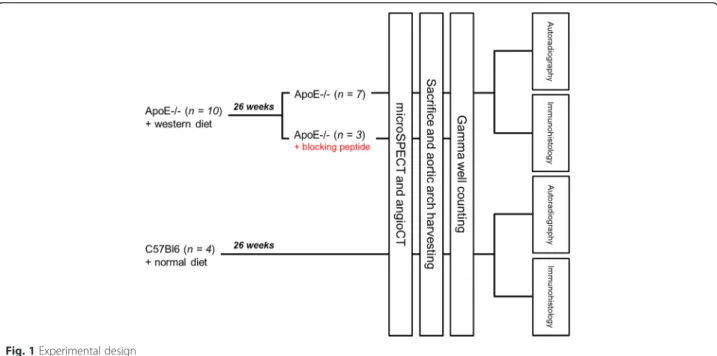
mice were kept on a Western diet (1.25 % cholesterol, 16 % cocoa butter, U8220 version 97, Safe, Augy, France) for 26 weeks preceding the examinations to induce ath-erosclerosis. C57BL/6 mice were fed normally for the same 26 weeks. Cholesterol-fed ApoE−/− mice were divided into two groups, each of which received either (1) 99mTc-maraciclatide (n = 7) or (2) pretreatment with blocking peptide (50μg of NC100717, unlabeled precur-sor, GE Healthcare, Amersham, UK) 2 min before deliv-ery of 99mTc-maraciclatide (n = 3). The latter group was designed to demonstrate imaging specificity. All control-diet C57BL/6 mice received 99mTc-maraciclatide (n = 4) (Fig. 1). The experimental protocol was approved by the Institutional Animal Studies Committee of the Uni-versité Catholique de Louvain.
MicroSPECT and CT imaging
Mice were anesthetized with 1–3 % isoflurane, and the right femoral vein was isolated for placement of a cath-eter (27-g butterfly needle with 12-cm polyurethane tubing, Visualsonics, Toronto, Canada) to facilitate the
Fig. 1 Experimental design
injection of radiotracers and contrast medium. All animals were injected intravenously with 51.8 ± 3.7 MBq of99mTc-maraciclatide, a99mTc-labeled chelated peptide conjugate containing an RGD motif targeting αV
integ-rin. Anesthesia was maintained, and each mouse was put into a sarcophagus especially designed to keep the ani-mal in the same position throughout the experiments. A tube containing free 99mTc was fixed around the sar-cophagus to allow perfect fusion between SPECT images and CT images. SPECT was performed 90 min after ra-diotracer injection using a high-resolution small-animal imaging microSPECT system [16] (Linoview SPECT system, The Netherlands) equipped with 0.4-mm-wide slit-slat collimators. The four detectors followed four lin-ear orbits surrounding the animal, providing linograms for a total acquisition time of 30 min with a 35 % energy window centered at 140 keV. The resulting linograms were reconstructed using the expectation maximization maximum likelihood algorithm without attenuation or resolution correction. The system spatial resolution was 0.6 mm resulting from the collimator slit width and the crystal pixel size. The sarcophagus was then transferred to a 16-detector CT system (Philips Medical System, The Netherlands). Animals were injected with a bolus infu-sion of CT contrast (150 μL iodinated CT contrast di-luted 1:2, Iomeron 400, Bracco, UK) over 5 s, and CT imaging was performed 2 s after the start of bolus injection to precisely identify arterial structures. The fol-lowing parameters were used: tube rotation speed, 420 ms; detector collimation, 16 × 0.75 mm; tube volt-age, 140 kV; and effective tube current, 400 mAs.
Images from both modalities were subsequently rigidly registered using PMOD version 2.65 (PMOD Technolo-gies, Ltd., Adliswil, Switzerland). The volume data were analyzed using the conventional transverse, coronal, and sagittal views. For quantitative analysis of tracer uptake into the plaque, a 3D region of interest (ROI) was drawn manually at the level of the aortic arch on the CT trans-verse images and copied to the co-registered SPECT im-ages The totality of the arch was included in the analysis. The size of the mice vena cava being sufficient to avoid partial volume effect, a ROI in the inferior vena cava was used to determine background activity accur-ately. Averaged counts in each ROI were used to calcu-late the target to background ratio (TBR) defined as the aortic arch activity (counts/voxel) divided by the vena cava activity (counts/voxel).
Gamma well counting
Mice were euthanized immediately after in vivo SPECT/ CT. The aortic arch and the descending aorta of each animal were carefully dissected and washed in saline solution. Tissue samples were weighed. Tissue 99mTc activity was measured using a gamma well counter
(Packard COBRA II gamma counter) with an appro-priate energy window (140 keV) and corrected for background, decay time, and tissue weight. Corrected counts were converted to μCi per milligram of tissue by using a previously determined counter efficiency. Activity was calculated as percentage of injected dose per weight (%ID/g).
Autoradiography
Aortic samples from ApoE−/− mice (n = 3) and from C57BL/6 control mice (n = 3) were exposed to an imaging plate (Fuji Imaging Plate, Fuji Photo Film Co. Ltd., Japan) immediately after gamma counting. After overnight exposure, the imaging plates were scanned with the Fuji Analyzer FLA-2000. The images were ana-lyzed for count densities (quantification level/mm2) with image analysis software (AIDA Image Analyzer, Raytest, Isotopenmessgeraete GmbH, Germany) by drawing re-gions of interest on the aortic arch.
Immunostaining
Aortic samples from three ApoE−/− mice and from one C57BL/6 control mouse were embedded in optimum cutting temperature compound, snap-frozen, and stored at−80 °C. Histology was performed on 5 μm-thick cryo-sections of the aortic arch. Macrophages and endothelial cells were identified with rat monoclonal IgG (respect-ively: rat anti-mouse CD68, product MCA1957GA, di-luted 1:50, AbD Serotec; rat anti-mouse CD31, product 550274, diluted 1:50, BD Biosciences). αV integrin was
identified with rabbit anti-mouse CD51 (product 210-537-R100, polyclonal, diluted 1:1000, Enzo Life Sci-ences). Biotinylated Alexa 568 (red) anti-rabbit or Alexa 488 (green) anti-rat IgG antibodies were used as second-ary reagents. Nuclei were stained with 4′,6-diamidino-2-phenylindole. Images were acquired and digitized under high power (×63 oil-immersion objective) with a Zeiss AxioImager.z1 microscope. Signals from CD68, CD51, and CD31 were quantified with ImageJ (open-source software developed by the National Institutes of Health) and expressed as the percent positive area out of the total tissue area.
Statistical analysis
All results are expressed as mean ± standard deviation. Continuous variables were compared among the three groups of mice using Kruskal-Wallis analysis of variance. Individual comparisons between groups were evaluated post hoc using the Mann-Whitney test with Bonferroni adjustment for multiple testing. Associations between any two variables were addressed using Pearson’s correl-ation. P < 0.05 was considered statistically significant. The statistical analyses were performed using SPSS ver-sion 1.5.0 statistical software (Chicago, IL).
Results
All ApoE−/−mice had atherosclerotic plaques predomin-antly located at the level of the aortic arch and the supra-aortic vessels (Fig. 2a). As expected, no aortic plaques were found in C57BL/6 control mice (Fig. 2b). MicroSPECT/CT in vivo imaging ofαVβ3integrin in the
aortic arch
ApoE−/−mice and control mice underwent 99m Tc-mara-ciclatide microSPECT at 30 ± 4 weeks. Increased tracer uptake was readily visible on the aortic arch of ApoE−/− mice that did not receive the blocking peptide (Fig. 3a). In contrast, no signal was detected in the aortic arch of C57BL/6 control mice (Fig. 3b). As expected, no signal was visible in the aortic arch of ApoE−/− mice that received the blocking peptide 2 min before99m Tc-mara-ciclatide injection (Fig. 3c).
Tracer uptake was quantified in the aortic arch of all animals. Although the signal-to-noise ratio of 99m Tc-maraciclatide was not very high, quantitative analysis from in vivo images indicated significantly higher up-take, expressed in TBR, in the aorta of ApoE−/−mice, as compared with C57BL/6 control mice and with ApoE−/− mice that received the blocking peptide 2 min before
99m
Tc-maraciclatide injection (1.56 ± 0.33 vs. 0.82 ± 0.24 vs. 0.98 ± 0.11, respectively; P = 0.006; Fig. 4). These data establish the specificity of tracer uptake. Validation of99mTc-maraciclatide in vivo uptake with gamma counting
The significant increase in 99mTc-maraciclatide uptake within the aortic arch of ApoE−/− mice that was ob-served with microSPECT imaging in vivo was confirmed with gamma counting.99mTc-maraciclatide microSPECT uptake significantly correlated with tracer activity mea-sured by gamma counting (r = 0.63, P = 0.038). Higher tracer activity was detected in the aortas from ApoE−/− mice than in the aortas from C57BL/6 control mice and
in those from ApoE−/− mice that received the blocking peptide (1.52 ± 0.43 vs. 0.78 ± 0.19 vs. 0.47 ± 0.3199m Tc-maraciclatide %ID/g, respectively;P = 0.018; Fig. 5). Validation of99mTc-maraciclatide in vivo uptake with autoradiography
To confirm the ability of 99mTc-maraciclatide to detect αVβ3 integrin expression in vivo, aortic arches from
ApoE−/− mice (n = 3) and from C57BL/6 control mice (n = 3) were harvested for autoradiography. Consistent with our microSPECT and gamma counting analyses, uptake in hyperlipidemic aortas was visibly higher than in control aortas (Fig. 6a, b). A region of interest was drawn around the entire aortic cross of the animals, and the relative autoradiographic intensity was measured. Again, the highest uptake (quantification level/mm2) was identified in the aortas from ApoE−/− mice (P = 0.026; Fig. 6c).
Immunohistology
Many types of cells in atherosclerotic plaques, including macrophages, endothelial cells, and vascular smooth muscle cells, may express αV integrin. However, in our
model, αV integrin was mostly expressed by
macro-phages. Indeed, we observed a significant correlation between the patterns of CD68 and CD51 expression (r = 0.73, P = 0.04; Fig. 7a). A representative micrograph of the co-labeling of macrophages expressing CD68 and CD51 is shown in Fig. 7b–e.
In contrast, cells expressing both CD31 and CD51 which were supposed to be neo-endothelial cells were very rarely identified in the thickness of the plaque (Fig. 8). We did not detect any correlation between per-cent staining for CD31 and CD51 (r = 0.31, P = 0.41).
Discussion
Integrins belong to a group of cell-adhesion molecules; they are heterodimeric transmembrane glycoproteins
Fig. 2 Representative images of the macroscopic appearance of the aorta of a cholesterol-fed ApoE−/−mouse (a) and a normally fed C57BL/6 control mouse (b). Note the presence of atherosclerotic plaques predominantly located at the level of the aortic arch and the supra-aortic vessels of the hyperlipidemic mouse (white arrows); no plaque is apparent in the aorta of the control mouse
Fig. 3 This figure shows coronal, axial, and sagittal views from CT (left), fused microSPECT/CT (middle), and SPECT (right) ofαVβ3integrin imaging,
respectively. MicroSPECT/CT allows imaging of99mTc-maraciclatide uptake (red arrow) into atherosclerotic plaques of ApoE−/−mouse. a CT images, SPECT/CT overlay images, and SPECT images obtained in an ApoE−/−mouse. b CT images, SPECT/CT overlay images, and SPECT images obtained in a C57BL/6 control mouse. c CT images, SPECT/CT overlay images, and SPECT images obtained in an ApoE−/−mouse who received the blocking peptide. Animals were kept under gas anesthesia (1–3 % isoflurane in O2at a flow rate of 2 L/min). SPECT was performed 90 min
after injection of about 52 MBq of99mTc-maraciclatide. Total acquisition time was 30 min. The focal thyroid free-99mTc uptake is marked by an asterisk. LV left ventricle, AA aortic arch, CPV counts per voxel
Fig. 4 MicroSPECT-derived quantification of99mTc-maraciclatide
uptake in the aortic arch of ApoE−/−mice (n = 7), C57BL/6 control mice (n = 4), and ApoE−/−mice who received the blocking peptide immediately before99mTc-maraciclatide injection (n = 3). P value on
top of the graph indicates the Kruskal-Wallis test result for the three experimental groups. Asterisks indicate significant difference, according to the Mann-Whitney test for independent samples with Bonferroni adjustment for multiple testing; *P < 0.05, **P < 0.01. Number sign indicates a P value >0.05. Ctrl control
Fig. 5 Counts obtained by gamma counting of the aortic samples of ApoE−/−mice (n = 7), C57BL/6 control mice (n = 4), and ApoE−/− mice who received the blocking peptide immediately before99m
Tc-maraciclatide injection (n = 3). Data are expressed as percentage of the injected dose of99mTc-maraciclatide per gram (%ID/g). P value
on top of the graph indicates the Kruskal-Wallis test result for the three experimental groups. Asterisks indicate significant difference, according to the Mann-Whitney test for independent samples with Bonferroni adjustment for multiple testing; *P < 0.05. Number sign indicates a P value >0.05. Ctrl control
that play a role in cell-cell and cell-matrix interactions [17]. Because both activated macrophages and endothe-lial cells can express high levels of integrin, especially αVβ3 integrin, αVβ3 expression represents a combined
marker of inflammation and angiogenesis, which are both implicated in plaque vulnerability. αVβ3 integrin
binds extracellular-matrix proteins via the RGD se-quence, which is present in the 99mTc-maraciclatide compound. 99mTc-maraciclatide has favorable kinetic properties for imaging, such as high affinity for integrin receptors, high metabolic stability in the circulation, and rapid renal excretion [11]. Our results demonstrate the potential for imaging αVβ3 integrin expression with 99m
Tc-maraciclatide and microSPECT/CT in inflamed plaques of atherosclerotic mice. We validated our results with gamma counting, autoradiography, and histology. Furthermore, competition experiments confirmed the specificity of the signal.
Atherosclerotic plaque angiogenesis has been imaged usingαVβ3integrin-targeted nanoparticles and MRI [9)],
and vascular inflammation has been successfully evalu-ated with αVβ3 integrin-targeted PET [8, 10]. Here, we
demonstrated that atherosclerotic lesions can be imaged with a99mTc tracer and a SPECT system, a strategy that confers several advantages. First, SPECT imaging is much more widely available and less expensive than PET or MRI. Second, the 99mTc radionuclide is easier to pre-pare and easier to use than many PET tracers that are usually labeled with short-lived radioisotopes. Finally, like other interesting tracers (mainly PET tracers) [18, 19],99mTc-maraciclatide could be used for coronary im-aging, a major area of interest. This is not the case for
18
F-fluoro-2-deoxy-D-glucose (FDG), which is currently the most validated PET tracer for arterial inflammation imaging in humans [20]. Indeed, coronary artery imaging with that tracer is more challenging than carotid im-aging, mainly due to intense FDG uptake in adjacent myocardium. Even if adequate preparation of patients allows minimal myocardial FDG uptake [21], FDG utilization in imaging of coronary wall inflammation re-mains to be validated; some data suggest that its utilization in coronary imaging is inappropriate [19]. Tracers like 99mTc-maraciclatide that could overcome this limitation would constitute a remarkable step for-ward for coronary artery imaging. However, given the relative low uptake of the tracer and the spatial reso-lution of clinical SPECT (6.7–15.3 mm) [22], the fact that99mTc-maraciclatide is a SPECT tracer could be per-ceived as a limitation for its widespread use in human arterial inflammation imaging, especially for coronary artery imaging. Nevertheless, it is unlikely that in the future, vulnerable plaque identification will be based on a single imaging modality. Multimodality imaging will be probably necessary. The combined assessment of anatomical markers of high-risk plaques (soft pla-ques, spotty calcifications, eccentric remodeling) which can be assessed by contrast-enhanced CT with functional markers like inflammation and neoangio-genesis which can be assessed by 99mTc-maraciclatide SPECT/CT could for instance represent an interesting dual approach for identifying vulnerable plaque. For this study, we used a preclinical animal scanner with a much higher spatial resolution than clinical SPECT systems [16]. Although this scanner enables sub-millimeter resolution, microscopic abdominal athero-sclerosis was not visualized in our animal model. Only macroscopic plaques, such as those visually identified in the aortic arch (Fig. 2), were imaged with 99m Tc-maraciclatide, suggesting that a “critical mass” is needed for plaque imaging. Whether the combined use of 99mTc-maraciclatide and clinical SPECT scan-ners will enable the detection of inflamed atheroscler-otic plaques in humans remains unknown. However, cooperation between researchers and manufacturers will ensure that SPECT/CT becomes a more accurate and reliable tool in the next decade.
Fig. 6 Autoradiographic analysis of99mTc-maraciclatide uptake. 99mTc-maraciclatide uptake is obvious in the aorta of the ApoE−/−
mouse (a) while a minimal tracer uptake corresponding to background activity is identified in the aorta of the C57BL/6 control mouse (b). Higher tracer uptake in the aortas of ApoE−/−mice was confirmed by drawing regions of interest around the aortic cross (c). P value on top of the graph indicates the Mann-Whitney test result between the two experimental groups. Ctrl control
Fig. 7 Immunostaining of inflammation andαVintegrin. a Significant correlation between percent area of CD68 staining and percent area of
CD51 staining (Pearson’s r = 0.73, P = 0.04). Histopathological characterization of the aortic tissue section from an atherosclerotic animal. b Merged image of CD68 (macrophages in green) and CD51 (αVintegrin in red) co-labeling. High-power views (corresponding to the box in b) showing
representative micrographs of co-labeling (c), macrophage (d), andαVintegrin (e). Arrows point to cells positive for both markers. Nuclei were
stained with 4′,6-diamidino-2-phenylindole (blue) (c). Scale bar = 20 μm in b. Scale bar = 10 μm in c–e
Fig. 8 Histopathological characterization of the aortic tissue section from an atherosclerotic animal. a Merged image of CD31 (microvessels in green) and CD51 (αVintegrin in red) co-labeling. High-power views (corresponding to the box in a) showing representative micrographs of
co-labeling (b), microvessels (c), andαVintegrin (d). Arrows point to cells positive for both markers. Nuclei were stained with 4
The plaques in our ApoE-deficient mice are “human-like,” as they are very similar to plaques observed in pa-tients [23]. Furthermore, in ApoE−/− mice like those we used in this work, plaques which are present at the ori-gin of the great vessels of the neck and on which we concentrated in this study (Fig. 2) demonstrate features likely to be the “murine parallel” of those in vulnerable human plaques [24]. We therefore believe that this tracer may be of interest for detecting high-risk plaques in humans and perhaps also in tracking the effect of ag-gressive pharmacological treatment, like high dose of statins. Furthermore, this tracer has been approved for human use; its safety and tolerance have already been successfully tested in patients with breast cancer [25]. Therefore, it would be interesting to move from preclin-ical animal studies to clinpreclin-ical studies in order to test this tracer in the field of human atherosclerosis.
We detected a strong correlation between immuno-staining for αV integrin (CD51) and for macrophages
(CD68); in contrast, co-staining forαVintegrin and
neo-vessels (CD31) identified very few cells that were positive for both immunomakers. This finding is similar to observations reported by previous studies [8, 15, 26]. It also suggests that the 99mTc-maraciclatide signal largely results from inflammatory infiltrate rather than from neoangiogenesis per se. Inflammation plays a key role in atherosclerosis and is linked to plaque vulnerability. The presence of inflammation in the arterial wall of large ar-teries measured by FDG-PET/CT has been shown to predict acute clinical events [27]. 99mTc-maraciclatide could thus help to refine the clinician’s ability to stratify patient risk for acute events such as stroke, sudden cardiac death, or acute coronary syndromes.
Some limitations must be acknowledged for this study. First, the number of animals is small. Since it was un-known whether reliable SPECT signal could be obtained from the atherosclerotic lesions of mice, this study was designed as a “feasibility study.” Nonetheless, tracer uptake was clearly detected in the aortic arch of athero-sclerotic mice in comparison with control animals. Furthermore, the imaging results were validated with several other techniques, including gamma counting and autoradiography, and blocking with excess unlabeled precursor confirmed the specificity of the SPECT signal. Finally, the number of animals used in this study is similar to that used in other comparable studies [8, 26]. As a second limitation, we did not measure mRNA expression of the genes encoding CD68, CD31, or CD51 in mouse aortas via quantitative reverse transcription polymerase chain reaction. Nevertheless, we obtained convincing images with immunohistology, and the quan-tification of the various markers revealed a clear rela-tionship between integrin expression and macrophages. The co-expression of integrin and CD31 was clearly
weaker. These results are consistent with those obtained by Yoo et al [26].
Conclusions
Here, we have demonstrated that 99mTc-maraciclatide SPECT/CT specifically detects αVβ3 integrin expression
in inflamed atherosclerotic plaques in ApoE−/− mice. This tracer may thus represent an interesting non-invasive approach for identifying high-risk plaques in human patients and for monitoring their global risk for presenting acute vascular events. Its clinical value must be defined by future prospective human studies.
Competing interests
The authors declare that they have no competing interests.
Authors’ contributions
All authors have contributed significantly to this work. DVC and VR conceived the study, performed the experiments, performed statistical analysis and drafted the manuscript. DVC and CB performed histology and analyzed histopathological samples. FXH, SW, VB, AB participated in the study design and performed experiments. ACP, AP, BG, PL, TH, FJ and JLVO analyzed and interpreted the data, revised the manuscript critically for significant intellectual content. All authors read, approved the final manuscript and agree with its submission.
Funding sources
This work was supported in part by the Fonds de la Recherche Scientifique Médicale– F.N.R.S. (n° 3.4592.09), Brussels, Belgium. DV is supported by the Fonds de Recherche Clinique of the Institut de Recherche Expérimentale et Clinique, Université Catholique de Louvain.
Author details
1Pôle de Recherche Cardiovasculaire (CARD), Institut de Recherche Expérimentale et Clinique (IREC), Université Catholique de Louvain, Brussels, Belgium.2Pôle d’Imagerie Médicale, Radiothérapie et Oncologie (MIRO), Institut de Recherche Expérimentale et Clinique (IREC), Université Catholique de Louvain, Brussels, Belgium.3IREC Imaging Platform, Institut de Recherche Expérimentale et Clinique (IREC), Université Catholique de Louvain, Brussels, Belgium.4INSERM UMR_S 1166, Integrative Biology of Atherosclerosis Team, Université Pierre et Marie Curie-Paris6 and institute of Cardiometabolism and Nutrition (ICAN), Pitié-Salpêtrière Hospital, 75013 Paris, France.5Division of Cardiology, Cliniques Universitaires St-Luc, Avenue Hippocrate, 10-2881, B-1200 Brussels, Belgium.
Received: 19 January 2016 Accepted: 15 March 2016
References
1. Falk E, Shah PK, Fuster V. Coronary plaque disruption. Circulation. 1995;92: 657–71.
2. Virmani R, Burke AP, Farb A, Kolodgie FD. Pathology of the vulnerable plaque. J Am Coll Cardiol. 2006;47:C13–8.
3. Narula J, Garg P, Achenbach S, Motoyama S, Virmani R, Strauss HW. Arithmetic of vulnerable plaques for noninvasive imaging. Nat Clin Pract Cardiovasc Med. 2008;5 Suppl 2:S2–10.
4. Vancraeynest D, Pasquet A, Roelants V, Gerber BL, Vanoverschelde JL. Imaging the vulnerable plaque. J Am Coll Cardiol. 2011;57:1961–79. 5. Antonov AS, Kolodgie FD, Munn DH, Gerrity RG. Regulation of macrophage
foam cell formation byαVβ3 integrin. Potential role in human atherosclerosis. Am J Pathol. 2004;165:247–58.
6. Hoshiga M, Alpers CE, Smith LL, Giachelli CM, Schwartz SM.αVβ3integrin
expression in normal and atherosclerotic artery. Circ Res. 1995;77:1129–35. 7. Burtea C, Laurent S, Murariu O, Rattat D, Toubeau G, Verbruggen A, et al.
Molecular imaging ofαVβ3integrin expression in atherosclerotic plaques
with a mimetic of RGD peptide grafted to Gd-DTPA. Cardiovasc Res. 2008; 78:148–57.
8. Laitinen I, Saraste A, Weidl E, Poethko T, Weber AW, Nekolla SG, et al. Evaluation ofαVβ3integrin-targeted positron emission tomography tracer
18F-galacto-RGD for imaging of vascular inflammation in atherosclerotic
mice. Circ Cardiovasc Imaging. 2009;2:331–8.
9. Winter PM, Morawski AM, Caruthers SD, Fuhrhop RW, Zhang H, Williams TA, et al. Molecular imaging of angiogenesis in early-stage atherosclerosis with αVβ3-integrin-targeted nanoparticles. Circulation. 2003;108:2270–4.
10. Beer AJ, Pelisek J, Heider P, Saraste A, Reeps C, Metz S, et al. PET/CT imaging of integrinαVβ3 expression in human carotid atherosclerosis. JACC Cardiovasc Imaging. 2014;7:178–87.
11. Edwards D, Jones P, Haramis H, Battle M, Lear R, Barnett DJ, et al.99m
Tc-NC100692—a tracer for imaging vitronectin receptors associated with angiogenesis: a preclinical investigation. Nucl Med and Biol. 2008;32:365–75. 12. Hua J, Dobrucki LW, Sadeghi MM, Zhang J, Bourke BN, Cavaliere P, et al.
Noninvasive imaging of angiogenesis with a99mTc-labeled peptide targeted at
αVβ3integrin after murine hindlimb ischemia. Circulation. 2005;111:3255–60.
13. Dobrucki LW, Dione DP, Kalinowski L, Dione D, Mendizabal M, Yu J, et al. Serial noninvasive targeted imaging of peripheral angiogenesis: validation and application of a semiautomated quantitative approach. J Nucl Med. 2009;50:1356–63.
14. Dobrucki LW, Tsutsumi Y, Kalinowski L, Dean J, Gavin M, Sen S, et al. Analysis of angiogenesis induced by local IGF-1 expression after myocardial infarction using microSPECT-CT imaging. J Mol Cell Cardiol. 2010;48:1071–9. 15. Razavian M, Marfatia R, Mongue-Din H, Tavakoli S, Sinusas AJ, Zjang J,
et al. Integrin-targeted imaging of inflammation in vascular remodelling. Arterioscler Thromb Vasc Biol. 2011;31:2820–6.
16. Walrand S, Jamar F, de Jong M, Pauwels S. Evaluation of novel whole-body high-resolution rodent SPECT (Linoview) based on direct acquisition of linogram projections. J Nucl Med. 2005;46:1872–80.
17. Beer AJ, Schwaiger M. Imaging of integrinαVβ3expression. Cancer
Metastasis Rev. 2008;27:631–44.
18. Gaemperli O, Shalhoub J, Owen DR, Lamare F, Johansson S, Fouladi N, et al. Imaging intraplaque inflammation in carotid atherosclerosis with
11
C-PK11195 positron emission tomography/computed tomography. Eur Heart J. 2012;33:1902–10.
19. Joshi NV, Vesey AT, Williams MC, Shah AS, Calvert PA, Craighead FH, et al. 18F-fluoride positron emission tomography for identification of ruptured and high-risk coronary atherosclerotic plaques: a prospective clinical trial. Lancet. 2014;383:705–13.
20. Figueroa AL, Abdelbaky A, Truong QA, Corsini E, MacNabb MH, Lavender ZR, et al. Measurement of arterial activity on routine FDG PET/CT images improves prediction of risk of future CV events. JACC Cardiovasc Imaging. 2013;6:1250–59.
21. Demeure F, Hanin FX, Bol A, Vincent MF, Pouleur AC, Gerber B, et al. A randomized trial on the optimization of 18F-FDG myocardial uptake suppression: implications for vulnerable coronary plaque imaging. J Nucl Med. 2014;55:1629–35.
22. Slomka PJ, Berman DS, Germano G. New cardiac cameras: single-photon emission CT and PET. Semin Nucl Med. 2014;44(4):232–51.
23. Pendse AA, Arbones-Mainar JM, Johnson LA, Altenburg MK, Maeda N. Apolipoprotein E knock-out and knock-in mice: atherosclerosis, metabolic syndrome, and beyond. J Lipid Res. 2009;50:S178–82.
24. Meir KS, Leitersdorf E. Atherosclerosis in the apolipoprotein E-deficient mouse. A decade of progress. Arterioscler Thromb Vasc Biol. 2004;24:1006–14. 25. Bach-Gansmo T, Danielsson R, Saracco A, Wilczek B, Bogsrud TV, Fangberget
A, et al. Integrin receptor imaging of breast cancer: a proof-of-concept study to evaluate 99m Tc-NC100692. J Nucl Med. 2006;47:1434–9. 26. Yoo JS, Lee J, Jung JH, Moon BS, Kim S, Lee BC, Kim SE. SPECT/CT imaging
of high-risk atherosclerotic plaques using integrin-binding RGD dimer peptides. Sci Rep. 2015;5:11752.
27. Rominger A, Saam T, Wolpers S, Cyran CC, Schmidt M, Foerster S, et al. 18F-FDG PET/CT identifies patients at risk for future vascular events in an otherwise asymptomatic cohort with neoplastic disease. J Nucl Med. 2009; 50:1611–20.
Submit your manuscript to a
journal and benefi t from:
7 Convenient online submission 7 Rigorous peer review
7 Immediate publication on acceptance 7 Open access: articles freely available online 7 High visibility within the fi eld
7 Retaining the copyright to your article