HAL Id: hal-01753870
https://hal-amu.archives-ouvertes.fr/hal-01753870
Submitted on 11 Apr 2018HAL is a multi-disciplinary open access archive for the deposit and dissemination of sci-entific research documents, whether they are pub-lished or not. The documents may come from teaching and research institutions in France or abroad, or from public or private research centers.
L’archive ouverte pluridisciplinaire HAL, est destinée au dépôt et à la diffusion de documents scientifiques de niveau recherche, publiés ou non, émanant des établissements d’enseignement et de recherche français ou étrangers, des laboratoires publics ou privés.
Homocysteine levels associate with subtle changes in
leukocyte DNA methylation: an epigenome-wide
analysis
Pooja Mandaviya, Dylan Aïssi, Koen Dekkers, Roby Joehanes, Silva Kasela,
Vinh Truong, Lisette Stolk, Diana Van Heemst, M Arfan Ikram, Jan
Lindemans, et al.
To cite this version:
Pooja Mandaviya, Dylan Aïssi, Koen Dekkers, Roby Joehanes, Silva Kasela, et al.. Homocysteine levels associate with subtle changes in leukocyte DNA methylation: an epigenome-wide analysis. Epigenomics, Future Medicine, 2017, 9 (11), pp.1403-1422. �10.2217/epi-2017-0038�. �hal-01753870�
Homocysteine levels associate with subtle changes in leukocyte
DNA methylation: an epigenome-wide analysis
Pooja R Mandaviya, Dylan Aïssi, Koen F Dekkers, Roby Joehanes, Silva Kasela, Vinh Truong‡, Lisette Stolk, Diana van Heemst, M Arfan Ikram, Jan Lindemans, P Eline
Slagboom,David-Alexandre Trégouët, André G Uitterlinden,Chen Wei,Phi,l Wells,France Gagnon Marleen MJ van Greevenbroek, Bastiaan T Heijmans, Lili Milani, Pierre-Emmanuel Morange, Joyce BJ van Meurs, Sandra G Heil & BIOS Consortium
Aim: Homocysteine (Hcy) is a sensitive marker of one-carbon metabolism. Higher Hcy levels have been associated with global DNA hypomethylation. We investigated the association between plasma Hcy and epigenome-wide DNA methylation in leukocytes. Methods: Methylation was measured using Illumina 450 k arrays in 2035 individuals from six cohorts. Hcy-associated differentially methylated positions and regions were identified using meta-analysis. Results: Three differentially methylated positions cg21607669 (SLC27A1), cg26382848 (AJUBA) and cg10701000 (KCNMA1) at chromosome 19, 14 and 10, respectively, were significantly associated with Hcy. In addition, we identified 68 Hcy-associated differentially methylated regions, the most significant of which was a 1.8-kb spanning domain (TNXB/ATF6B) at chromosome 6. Conclusion: We identified novel epigenetic loci associated with Hcy levels, of which specific role needs to be further validated.
Homocysteine (Hcy), an intermediate of the one-carbon metabolism, is an independent risk factor of diseases like osteoporotic fractures [1] and cardiovascular disorders [2]. In addition, Hcy is often used as sensitive marker of folate- and vitamin B12 deficiency. Recent
intervention trials were not able to show that lowering of plasma Hcy by B-vitamin intervention led to a reduction in disease risk such as myocardial infarction [3–5] and osteoporotic fractures [6]. Identification of the underlying pathophysiological mechanism of Hcy is warranted to understand its role as biomarker of several disease states.
Hcy is formed by a demethylation reaction from methionine. In the methionine cycle, adenosylmethionine donates its methyl group to the DNA resulting in
s-adenosylhomocysteine (SAH) as a by-product and a potent inhibitor of this methyltransferase reaction. SAH is hydrolyzed to Hcy in a reversible manner. Elevated Hcy in a condition known as hyperhomocysteinemia (HHcy) is associated to and increased SAH level, which is linked to alterations in DNA methylation [7–9]. This is one of the possible mechanisms in Hcy-related pathologies and the rational to study the effect of Hcy on genome-wide DNA methylation.
Hcy is a sensitive marker of one-carbon metabolism and will increase when remethylation or trans-sulfuration is impaired. Shortage of folate, vitamin B12 or B6 results in elevated Hcy levels. Although folate levels are important, we believe that it is not necessary to correct for folate in our analysis as Hcy is strongly correlated to folate and belongs to the same pathway. This would have canceled out the effect of Hcy itself on DNA methylation. The general hypothesis of this study was that Hcy is associated with changes in DNA methylation irrespective of the cause.
Normal circulating Hcy levels range from 8 to 10 μmol/l for women and 10 to 12 μmol/l for men [10]. Mild or moderate HHcy is referred to Hcy concentrations between 15 and
30 μmol/l, whereas intermediate and severe HHcy is referred to Hcy concentrations between 30–100 and >100 μmol/l, respectively [10–12]. HHcy has been shown to be associated with both global- and gene-specific DNA hypomethylation, which was recently reviewed by us [14]. In candidate gene studies of animal models, genes whose methylation have shown association with Hcy are the hypomethylation of imprinted genes (e.g., IGF2/H19 locus) [19,20], cardiac Trp53 [21], leukocytic mTERT promoter [22], brain Nr3c1 exon region [17], brain Ppp2r1a [23] and liver 5′-portion of Soat2 [24] and hypermethylation of the aortic
Nr3c1 promoter [25] and liver Fads2 promoter [26]. In human studies, HHcy has been shown
to be associated with altered methylation of the RFC1 gene [27]. For patients with vascular disorders, HHcy has shown association with hypomethylation of the leukocytic hTERT promoter [22], leukocytic SHC1 promoter [28], punch aortic NOS2 proximal promoter [29] and hypermethylation of the blood ESR1 promoter [30] and internal mammary artery NOS2 proximal promoter [29]. For patients with colorectal, esophageal and breast cancer, HHcy has shown association with hypermethylation of ESR1 promoter [31] and exon 1 [32], MLH1 promoter [33], RARB promoter exon [32], BRCA1 and RASSF1 promoter [34].
In animal models, HHcy was also shown to associate with global hypomethylation [15–18]. Human studies included mostly small-scale studies in renal or vascular patients with HHcy in which global DNA hypomethylation was observed [10,13,35]. Most studies showed
significant associations of Hcy with DNA methylation, however, also null associations have been found [36,37]. Hence, the association between Hcy and DNA methylation is complex, contradictory and remains to be fully understood. Mild HHcy can occur due to either genetic or environmental factors such as low intake of B vitamins. Regardless of the cause, Hcy itself is thought to be the most prominent key player in altering DNA methylation patterns and associated disease risks.
In the current manuscript, we explored the association of Hcy in relation to genome-wide CpG site level in leukocytes to assess its role in DNA methylation. In this study, we performed a meta-analysis in 2035 individuals of six individual cohorts using the high-resolution Infinium Illumina 450 k BeadChip arrays.
Materials & methods
Cohorts
Six cohorts participated in the analysis, Rotterdam study [38] (n = 700), Leiden Longevity study [39] (n = 550), Cohort on Diabetes and Atherosclerosis Maastricht [40] (n = 186), MARseille THrombosis Association study [41] (n = 293), Estonian Biobank [42] (n = 96) and French-Canadian family study on Factor V Leiden thrombophilia [41] (n = 210). This added up to a total sample size of 2035 for the meta-analysis. The ethics review committees
approved each study at their relevant organizations. Characteristics of each study are provided in Table 1 and Supplementary Text 1.
Table 1. Characteristics of cohorts included in the homocysteine meta-analysis. Cohort N Coun try Type (pathoph ysiology) Wo me n (%) Hcy ‡ (me dia n [ra nge ]) H Hc y ( % ) Metho d Tot al prec isio n (C. V.% ) Tim e betw een bloo d colle ctin g and free zing Age (mean ± SD) Gran (mean ± SD) Lym (mean ± SD) Mono (mean ± SD) Rotterd am Study (RS) 7 0 0 The Nethe rlands Prospecti ve, populatio n-based (mainly healthy) 54. 7 11.5 (5.9 – 35.4 ) 19. 4 LC– MS/M S 5.5 As soon as possi ble 59.8 ± 8.0 4.2 ± 1.5 2.4 ± 0.7 0.4 ± 0.4 Leiden Longev ity Study (LLS) 5 5 0 The Nethe rlands Prospecti ve, family-based (mainly healthy) 51. 8 12.2 (5.3 – 31.6 )† 18. 2 Comp etitive immu noassa y NA As soon as possi ble 58.7 ± 6.6 4.4 ± 1.3 2.0 ± 0.6 0.4 ± 0.1 Cohort on Diabete s and Atheros clerosis Maastri cht (CODA M) 1 8 6 The Nethe rlands Prospecti ve, observati onal (mildly increased DM2/CV D risk factors) 54. 8 10.5 (5.6 – 29.9 ) 11. 3 LC– MS/M S Less than 4.0 Less than 2 h 65.3 ± 7.0 0.3 ± 0.1 0.1 ± 0.1W 0.3 ± 0.1X 0.2 ± 0.1Y 0.1 ± 0. 0Z 0.1 ± 0.1 MARse ille Throm bosis Associa tion Study (MAR THA) 2 9 3 Franc e Retrospe ctive (patients with venous thromboe mbolism) 80. 3 10.3 (3.4 – 33.8 ) 10. 2 Comp etitive immu noassa y 5.0 Less than 2 h 43.5 ± 14.3 4.4 ± 1.6 1.9 ± 0.6 0.3 ± 0.1 Estonia n Bioban k (EGCU T) 9 6 Eston ia Populatio n-based (mainly healthy) 50. 0 13.3 (6.3 – 34.0 ) † 32. 3 LC with photo metric detecti on NA No freez ing 52.4 ± 23.7 3.8 ± 1.3 2.0 ± 0.7 0.5 ± 0.2 French-Canadi an family study on F5L thromb ophilia 2 1 0 Cana da Pedigree-based (mainly healthy; probands with VTE) 52. 4 8.3 (3.7 – 28.2 ) 3.3 Fluore scence polariz ation immu noassa y 5.2 1– 3 h 39.8 ± 16.8 0.6 ± 0.1 0.0 ± 0.0W 0.2 ± 0.1X 0.1 ± 0.1Y 0.1 ± 0. 0Z 0.1 ± 0.0
Gran, Lym, Mono (measured cell counts in 109/l).
WCD8T.XCD4T.YNK.ZB-cell (Houseman-estimated percentage cell counts). †Nonfasting.‡Hcy concentrations in μmol/l. C.V.: Coefficient of Variation;
CVD: Cardiovascular disease; DM2: Diabetes mellitus type 2; F5L: Factor V Leiden; Hcy: Homocysteine; HHcy: Hyperhomocysteinemia (Hcy concentrations >15 μmol/l); NA: Not available; NK: Natural killer cells; SD: Standard deviation; VTE: Venous thromboembolism.
Hcy measurements
Total Hcy was measured in ethylenediaminetetraacetic acid plasma. Measurements in nonfasting state were performed in the Leiden Longevity study and Estonian Biobank study, while rest of the studies measured Hcy in fasting state. Details of each method are depicted in Table 1. Since the absolute values of Hcy in all studies were skewed to the right, logarithmic transformation of base 10 was used to achieve normal distribution. For a sample to be considered as an outlier, an outlier detection strategy [43] was used with four parameters of the Hcy log10 transformed data: quartile 1 (Q1), quartile 3 (Q3), interquartile range (IQR) and a multiplying factor (M). The lower end outliers (LO) were detected by the formula, LO = Q1 - (M*IQR), and upper end outliers (UO) were detected using UO = Q3 + (M*IQR). Any value less than or equal to LO and greater than or equal to UO was considered as an extreme outlier, using the M 3. A logarithmic transformation of base 10 and removal of outliers showed a clear improvement toward normal distribution (Supplementary Figure 1).
DNA methylation assessment
Genomic DNA was extracted from whole blood and was bisulfite converted. Infinium Illumina HumanMethylation 450k BeadChip arrays (Illumina, Inc., CA, USA) were used to perform DNA methylation profiling according to the manufacturers’ protocol. This assay covers methylation status of a wide range of CpGs at more than 450,000 sites at regions of CpG islands, shores and shelves. The sites annotate to various gene regions like promoters, enhancers, gene bodies, exons and UTRs [44]. Standard β-values were considered for the methylation analysis in all studies. These contain values ranging from 0 to 1, representing the percentage of methylation. β-values are calculated from the methylated (m) and unmethylated (u) probe intensities using the formula of β = m/(m + u + α), with the default alpha (α) of 100. These values were normalized using methods, such as DASEN [45] or SWAN [46]. Details of DNA methylation assessment, preprocessing methods and sample and probe quality control used by each cohort are provided in Supplementary Text 1 and Supplementary Table 1. Differentially methylated positions
Statistical analysis to identify differentially methylated positions (DMPs) was performed using R programming scripts, which were send around to each cohort and run by each cohort separately with log10 transformed Hcy as the exposure variable and DNA methylation as an outcome. This association analysis was performed using linear-mixed models of the lme4 package in R. The association model was adjusted for technical covariates and biological covariates like age, sex and differential white blood cell counts. Array number and position on array were used as technical covariates, and were treated as random effects. For cohorts that
did not contain measured white blood cell counts, the counts were inferred using the Houseman method as implemented in the minfi package [47] (Table 1).
Association analyses provided summary statistics from each study. A fixed effect meta-analysis was performed in 2035 individuals of six cohorts using the classical approach of the METAL software [48] that combines effect size estimates and standard errors of each study summary statistics. Probes with SNPs at single-base extension site were removed to avoid confounding and spurious signals. Probes with improper binding were also removed to avoid cohybridization with alternate homologous sequences [49]. In addition, we removed probes that were present in less than four studies since each cohort had different probe exclusions. This resulted in 468,108 probes remaining. The Benjamini–Hochberg (BH) method was used to define statistical significance for a false discovery rate (FDR) less than 0.05. The genomic inflation factor (λ) was calculated [50] and cohort heterogeneity was considered by taking into account the heterogeneity I2 parameter [48]. CpGs for nearby genes were annotated using the Genomic Regions Enrichment of Annotations Tool [51]. This assigns extension up to 5-kb upstream and 1-kb downstream to a basal regulatory region from its transcription start site and a maximum up to 1-Mb extension distance, as defined by UCSC [52].
IGF2/H19 locus
We also looked up for the three differentially methylated regions (DMRs) of IGF2/H19 locus at chromosome 11, which were previously related with Hcy [19,20]. The seven 450 k array CpGs underlying the three DMRs of this locus were identified using the literature [36,53,54]. Multiple testing using the Bonferroni method was applied on these seven CpGs to test for their significance with Hcy.
Enrichment of previously found folate-associated CpGs
Because Hcy is associated with folate, we additionally focused our analysis on the previously found 443 CpGs in cord blood of newborns associated with maternal plasma folate during pregnancy [55]. In order to check for their significant enrichment, we compared their p-values with the p-values of randomly selected 443 CpGs from the array, using the Fisher’s exact test. Differentially methylated regions
DMRs were identified using the python library of the comb-p software [56]. Absolute p-values from the meta-analysis of DMP analysis were given as input to combine them [57] adjacently at varying distance lags of 50 base pairs (bp) in a sliding-window of 500 bp, in order to calculate autocorrelation between them. As weighted according to this
autocorrelation, each p-value is adjusted according to its adjacent p-values. An FDR
correction using the BH method is then calculated on these adjusted p-values. A peak-finding algorithm then finds enrichment regions on these FDR-corrected adjusted p-values, and using Stouffer–Liptak correction as implemented in comb-p [56,58,59], it then assigns new p-values to the identified regions using the original absolute p-values from the meta-analysis. Finally, these assigned new p-values of the identified regions are multiple tested using the Sidak correction [60], where the defined statistical significance for the identified regions was Sidak-corrected P less than 0.05. The number of tests for a region in the Sidak correction is the total bases covered by input probes divided by the region size [56].
For the pathway analysis, we annotated the regions for genes using the Genomic Regions Enrichment of Annotations Tool [51]. We used WEB-based GEne SeT AnaLysis Toolkit (WebGestalt) [61] online resource for pathway analysis. KEGG database were used for enrichment. The BH method in WebGestalt was used to define statistical significance for an FDR less than 0.05.
Results
Cohort characteristics
Meta-analysis comprised of six cohorts with a total of 2035 individuals. All individuals were of European ancestry. The study design was mainly population based but also included cohorts with increased risk of diabetes, cardiovascular disorders and venous
thromboembolism. Study characteristics for all the participating cohorts are given in Table 1. Differentially methylated positions
Meta-analysis on 468,108 CpGs was done on the summary statistic of the six cohorts (Supplementary Figure 2) comprising of 2035 individuals. The p-values of this analysis showed a genomic inflation factor of 1.2 (Supplementary Figure 3). Three DMPs (Table 2 & Figure 1) were significantly associated with Hcy (FDR < 0.05). All three DMPs showed 1% increase in methylation with each unit increase in the 10 logarithmic Hcy value. The DMP cg21607669 located near the gene SLC27A1 at chromosome 19 had the lowest p-value of 7.71 × 10⁻⁸ (FDR = 0.04). The two other DMPs were cg26382848 (nearest gene AJUBA) located at chromosome 14 with p-value 1.67 × 10⁻⁷ (FDR = 0.04) and cg10701000 (nearest gene
KCNMA1) located at chromosome 10 with p-value 2.38 × 10⁻⁷ (FDR = 0.04). These three DMPs showed no substantial cohort heterogeneity I2 (I2 < 35). The direction of effects were mostly similar between all studies (Figure 2A–C).
Table 2. Homocysteine-associated differentially methylated positions. Rank CpG N Effect Std
Err p-value
FDR HetISq Nearby gene (±bp) Chr Bp Location
1 cg21607669 2035 0.01 0.001 7.71 × 10⁻⁸ 0.036 0 SLC27A1 (+40) 19 17581292 Promoter 2 cg26382848 2035 0.01 0.001 1.67 × 10⁻⁷ 0.037 31.1 AJUBA (-39) 14 23451889 Promoter 3 cg10701000 1346 0.01 0.003 2.38 × 10⁻⁷ 0.037 0 KCNMA1 (-143,626), DLG5 (+145,258) 10 79541025 -
Effect: β-coefficients based on log-transformed Hcy. HetISq: Heterogeneity Iˆ2 parameter. Bp: Base pair location based on Illumina annotation. Location: Based on Illumina annotation, derived from UCSC. FDR threshold = 0.05.
bp: Base pair; Chr: Chromosome; FDR: False discovery rate; Hcy: Homocysteine; Std Err: Standard error; UCSC: University of California, Santa Cruz.
Figure 1. Manhattan plot showing the association between homocysteine and genome-wide DNA methylation in 2035 samples, with three significant differentially methylated positions at chromosomes 10, 14 and 19, at false discovery rate less than 0.05 (red line). Nearest genes for these three DMPs are reported.
DMP: Differentially methylated position.
Figure 2. Forest plots showing the association between homocysteine and the significant DMPs across cohorts.
(A) Forest plot showing the association between homocysteine and the first significant DMP cg21607669 across the six cohorts. (B) Forest plot showing the association between
homocysteine and the second significant DMP cg26382848 across the six cohorts. (C) Forest plot showing the association between homocysteine and the third significant DMP
cg10701000 across the three cohorts. DMP: Differentially methylated position.
IGF2/H19 locus
We did a lookup for CpGs at the three DMRs of the IGF2/H19 gene (DMR0, DMR2, H19-DMR3) that have been previously studied in humans [36,53,54]. Data from our 450 k arrays contained seven CpGs at these DMRs: two at DMR0, four at DMR2 and one at H19-DMR3. However, none of the seven CpGs showed an association with Hcy with a Bonferroni cutoff of 7.14 × 10⁻³ (Table 3 & Supplementary Figure 5).
Table 3. Homocysteine-associated differentially methylated positions at the three IGF2/H19 differentially methylated regions at chromosome 11.
DMR CpG N Effect Std Err p-value Bonferroni HetISq Bp H19-DMR3 cg22259242 1532 0.0032 0.0048 0.5014 No 8.6 2021243 DMR2 cg13165070 1849 0.0041 0.011 0.713 No 0 2154113 DMR2 cg11717189 1753 -0.0079 0.0143 0.5824 No 0 2154132 DMR2 cg07096953 2035 -0.002 0.0106 0.847 No 0 2154255 DMR2 cg02613624 2035 0.0084 0.0072 0.2421 No 32.9 2154386 DMR0 cg00273464 2035 0.024 0.0094 0.0107 No 54.2 2170412 DMR0 cg17665927 2035 0.0054 0.0098 0.584 No 30.3 2170443
Effect: β-coefficients based on log transformed Hcy. HetISq: Heterogeneity Iˆ2 parameter. Bp: Base pair location based on Illumina annotation. Bonferroni threshold = 7.14 × 10⁻³. bp: Base pair; DMR: Differentially methylated region; Hcy: Homocysteine; Std Err: Standard error.
Enrichment of previously found folate-associated CpGs
For the previously found 443 CpGs in cord blood of newborns associated with maternal plasma folate during pregnancy [55], we compared their nominal p-values with 443 randomly selected CpGs in the array using 100 permutations. Based on our significant threshold (p < 0.05), 20 of the 443 folate-related CpGs met the threshold as compared with the 32 of the 443 randomly selected CpGs in the array. Using the Fisher’s exact test, we found no significant enrichment (p-value = 0.97) in the folate-related CpGs.
Differentially methylated regions
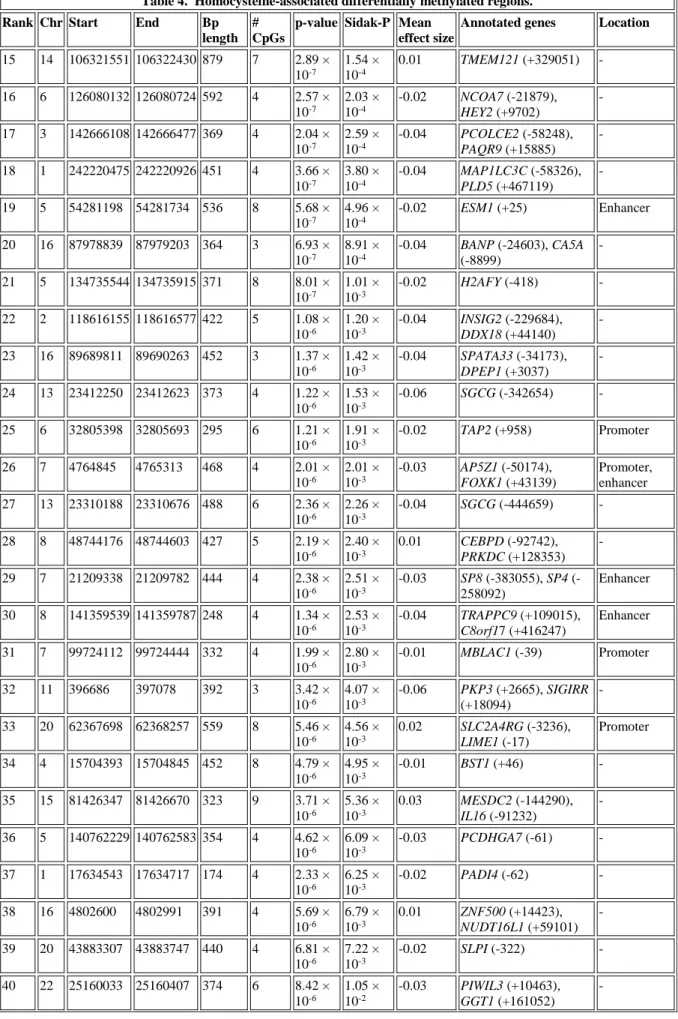
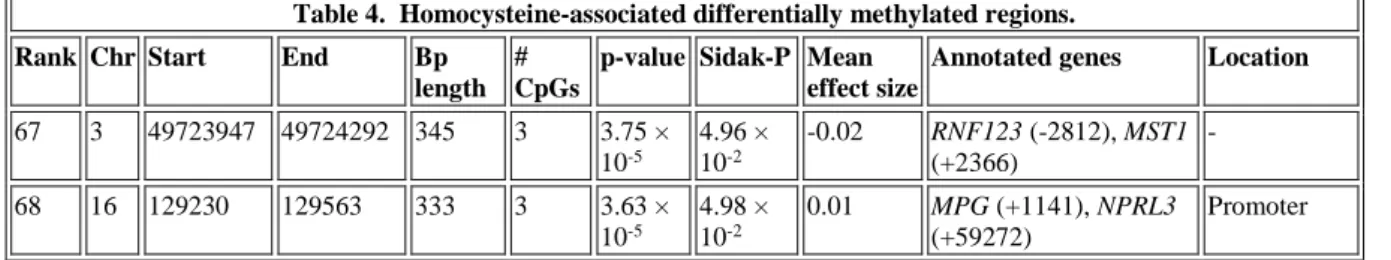
We identified 68 DMRs significant at Sidak P less than 0.05 (Table 4, Figure 3 &
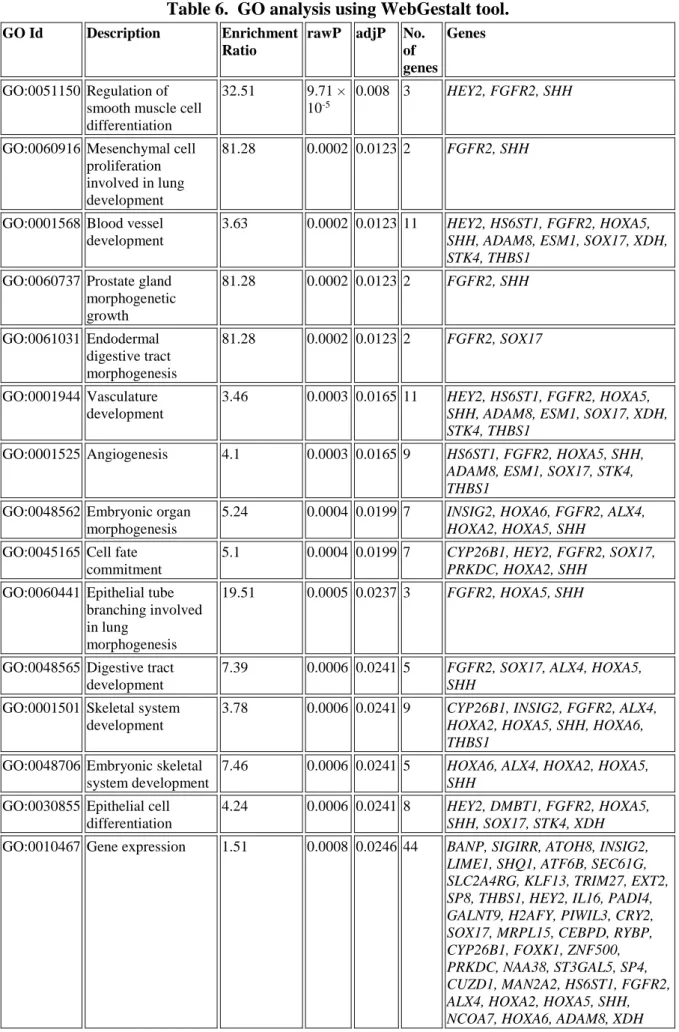
Supplementary Figure 4). The most significant was the DMR at chromosome 6 (spanning a region of 1.8 kb) with a p-value of 4.34 × 10⁻²⁴ (Sidak-P = 1.12 × 10⁻²¹) containing 55 CpGs. CpGs within this region were annotated to gene TNXB and ATF6B. Pathway analysis on the 114 genes annotated to the 68 DMRs showed 14 significant pathways (Table 5). Top five pathways were metabolic pathways, folate biosynthesis, glycosaminoglycan biosynthesis – heparan sulfate, phagosome and MAPK signaling pathway. Furthermore, results of the GO enrichment analysis showed that many biological processes are related to embryogenesis and development (Table 6).
Table 4. Homocysteine-associated differentially methylated regions. Rank Chr Start End Bp
length # CpGs
p-value Sidak-P Mean effect size
Annotated genes Location
1 6 32063394 32065212 1818 55 4.34 × 10⁻²⁴ 1.12 × 10⁻²¹ -0.04 TNXB (-50398), ATF6B (+31714) - 2 22 31317764 31318547 783 12 1.28 × 10⁻¹¹ 7.67 × 10⁻⁹ -0.04 MORC2 (+46031), OSBP2 (+227363) Enhancer 3 6 32145146 32146780 1634 29 6.53 × 10⁻¹⁰ 1.87 × 10⁻⁷ -0.01 AGPAT1 (-1106), RNF5 (-168) Promoter 4 7 27142100 27142811 711 15 2.70 × 10⁻⁹ 1.78 × 10⁻⁶ -0.02 HOXA2 (-26) - 5 15 91473059 91473570 511 9 2.59 × 10⁻⁹ 2.37 × 10⁻⁶ -0.02 HDDC3 (+2461), MAN2A2 (+25895) Promoter 6 22 32598479 32598717 238 4 5.87 × 10⁻⁹ 1.16 × 10⁻⁵ -0.03 RFPL2 (+866) - 7 17 48473757 48474100 343 4 1.16 × 10⁻⁸ 1.59 × 10⁻⁵ -0.02 LRRC59 (+985) - 8 2 31806352 31806899 547 6 1.94 × 10⁻⁸ 1.66 × 10⁻⁵ -0.03 XDH (-169045), MEMO1 (+429000) - 9 11 45827260 45827696 436 6 1.61 × 10⁻⁸ 1.73 × 10⁻⁵ -0.01 CRY2 (-41479), SLC35C1 (+1521) - 10 2 129659316 129659947 631 6 5.12 × 10⁻⁸ 3.80 × 10⁻⁵ -0.04 HS6ST1 (-583481) - 11 15 31515750 31516482 732 9 1.34 × 10⁻⁷ 8.55 × 10⁻⁵ -0.03 KLF13 (-102942), TRPM1 (-62640) Enhancer 12 10 123355268 123356042 774 5 1.62 × 10⁻⁷ 9.81 × 10⁻⁵ -0.06 FGFR2 (+2262), WDR11 (+744968) - 13 2 72079276 72079610 334 6 7.86 × 10⁻⁸ 1.10 × 10⁻⁴ -0.04 CYP26B1 (+295724), DYSF (+385611) - 14 20 3643863 3644193 330 5 8.80 × 10⁻⁸ 1.25 × 10⁻⁴ -0.02 GFRA4 (+18) -
Table 4. Homocysteine-associated differentially methylated regions. Rank Chr Start End Bp
length # CpGs
p-value Sidak-P Mean effect size
Annotated genes Location
15 14 106321551 106322430 879 7 2.89 × 10⁻⁷ 1.54 × 10⁻⁴ 0.01 TMEM121 (+329051) - 16 6 126080132 126080724 592 4 2.57 × 10⁻⁷ 2.03 × 10⁻⁴ -0.02 NCOA7 (-21879), HEY2 (+9702) - 17 3 142666108 142666477 369 4 2.04 × 10⁻⁷ 2.59 × 10⁻⁴ -0.04 PCOLCE2 (-58248), PAQR9 (+15885) - 18 1 242220475 242220926 451 4 3.66 × 10⁻⁷ 3.80 × 10⁻⁴ -0.04 MAP1LC3C (-58326), PLD5 (+467119) - 19 5 54281198 54281734 536 8 5.68 × 10⁻⁷ 4.96 × 10⁻⁴ -0.02 ESM1 (+25) Enhancer 20 16 87978839 87979203 364 3 6.93 × 10⁻⁷ 8.91 × 10⁻⁴ -0.04 BANP (-24603), CA5A (-8899) - 21 5 134735544 134735915 371 8 8.01 × 10⁻⁷ 1.01 × 10⁻³ -0.02 H2AFY (-418) - 22 2 118616155 118616577 422 5 1.08 × 10⁻⁶ 1.20 × 10⁻³ -0.04 INSIG2 (-229684), DDX18 (+44140) - 23 16 89689811 89690263 452 3 1.37 × 10⁻⁶ 1.42 × 10⁻³ -0.04 SPATA33 (-34173), DPEP1 (+3037) - 24 13 23412250 23412623 373 4 1.22 × 10⁻⁶ 1.53 × 10⁻³ -0.06 SGCG (-342654) - 25 6 32805398 32805693 295 6 1.21 × 10⁻⁶ 1.91 × 10⁻³ -0.02 TAP2 (+958) Promoter 26 7 4764845 4765313 468 4 2.01 × 10⁻⁶ 2.01 × 10⁻³ -0.03 AP5Z1 (-50174), FOXK1 (+43139) Promoter, enhancer 27 13 23310188 23310676 488 6 2.36 × 10⁻⁶ 2.26 × 10⁻³ -0.04 SGCG (-444659) - 28 8 48744176 48744603 427 5 2.19 × 10⁻⁶ 2.40 × 10⁻³ 0.01 CEBPD (-92742), PRKDC (+128353) - 29 7 21209338 21209782 444 4 2.38 × 10⁻⁶ 2.51 × 10⁻³ -0.03 SP8 383055), SP4 (-258092) Enhancer 30 8 141359539 141359787 248 4 1.34 × 10⁻⁶ 2.53 × 10⁻³ -0.04 TRAPPC9 (+109015), C8orf17 (+416247) Enhancer 31 7 99724112 99724444 332 4 1.99 × 10⁻⁶ 2.80 × 10⁻³ -0.01 MBLAC1 (-39) Promoter 32 11 396686 397078 392 3 3.42 × 10⁻⁶ 4.07 × 10⁻³ -0.06 PKP3 (+2665), SIGIRR (+18094) - 33 20 62367698 62368257 559 8 5.46 × 10⁻⁶ 4.56 × 10⁻³ 0.02 SLC2A4RG (-3236), LIME1 (-17) Promoter 34 4 15704393 15704845 452 8 4.79 × 10⁻⁶ 4.95 × 10⁻³ -0.01 BST1 (+46) - 35 15 81426347 81426670 323 9 3.71 × 10⁻⁶ 5.36 × 10⁻³ 0.03 MESDC2 (-144290), IL16 (-91232) - 36 5 140762229 140762583 354 4 4.62 × 10⁻⁶ 6.09 × 10⁻³ -0.03 PCDHGA7 (-61) - 37 1 17634543 17634717 174 4 2.33 × 10⁻⁶ 6.25 × 10⁻³ -0.02 PADI4 (-62) - 38 16 4802600 4802991 391 4 5.69 × 10⁻⁶ 6.79 × 10⁻³ 0.01 ZNF500 (+14423), NUDT16L1 (+59101) - 39 20 43883307 43883747 440 4 6.81 × 10⁻⁶ 7.22 × 10⁻³ -0.02 SLPI (-322) - 40 22 25160033 25160407 374 6 8.42 × 10⁻⁶ 1.05 × 10⁻² -0.03 PIWIL3 (+10463), GGT1 (+161052) -
Table 4. Homocysteine-associated differentially methylated regions. Rank Chr Start End Bp
length # CpGs
p-value Sidak-P Mean effect size
Annotated genes Location
41 7 54732478 54732752 274 2 6.94 × 10⁻⁶ 1.18 × 10⁻² -0.03 SEC61G (+95052), VSTM2A (+122597) - 42 7 27187269 27187692 423 9 1.23 × 10⁻⁵ 1.35 × 10⁻² -0.01 HOXA5 (-4194), HOXA6 (-88) - 43 15 42371511 42371968 457 7 1.49 × 10⁻⁵ 1.51 × 10⁻² -0.02 PLA2G4E (-28352), PLA2G4D (+15012) Enhancer 44 2 1480789 1481098 309 3 1.02 × 10⁻⁵ 1.54 × 10⁻² -0.04 TPO (+63711), PXDN (+267334) - 45 2 86038423 86038803 380 4 1.38 × 10⁻⁵ 1.69 × 10⁻² -0.02 ATOH8 (+57596), ST3GAL5 (+77524) Enhancer 46 15 38988533 38988861 328 4 1.23 × 10⁻⁵ 1.74 × 10⁻² -0.02 THBS1 (-884597), RASGRP1 (-131690) - 47 8 55294536 55294883 347 6 1.34 × 10⁻⁵ 1.79 × 10⁻² -0.01 SOX17 (-75785), MRPL15 (+246940) Enhancer 48 22 20009063 20009276 213 2 8.62 × 10⁻⁶ 1.88 × 10⁻² -0.01 ARVCF (-4839), TANGO2 (+539) Promoter 49 11 44327869 44328155 286 2 1.26 × 10⁻⁵ 2.04 × 10⁻² -0.02 ALX4 (+3704), EXT2 (+210265) - 50 3 72704324 72704702 378 4 1.71 × 10⁻⁵ 2.09 × 10⁻² -0.03 RYBP (-208444), SHQ1 (+193118) Enhancer 51 10 124578209 124578545 336 4 1.60 × 10⁻⁵ 2.21 × 10⁻² -0.04 CUZD1 (+31932), DMBT1 (+258196) - 52 5 66462293 66462663 370 3 1.78 × 10⁻⁵ 2.23 × 10⁻² -0.03 CD180 (+30149), MAST4 (+570289) Promoter, enhancer 53 20 43726431 43726766 335 3 1.64 × 10⁻⁵ 2.27 × 10⁻² -0.03 KCNS1 (+3154), STK4 (+131484) Promoter 54 10 135092104 135092242 138 2 8.19 × 10⁻⁶ 2.74 × 10⁻² -0.02 ADAM8 (-1801) - 55 2 233251770 233252171 401 4 2.72 × 10⁻⁵ 3.13 × 10⁻² 0.02 ALPPL2 (-19582), ALPP (+8727) Enhancer 56 7 156400711 156400991 280 4 2.02 × 10⁻⁵ 3.32 × 10⁻² -0.04 SHH (-795884), C7orf13 (+32497) - 57 10 104196206 104196542 336 5 2.44 × 10⁻⁵ 3.34 × 10⁻² -0.02 CUEDC2 (-3956) - 58 4 8126221 8126659 438 4 3.31 × 10⁻⁵ 3.47 × 10⁻² 0 AFAP1 (-184787), ABLIM2 (+33996) - 59 20 42955472 42955782 310 3 2.47 × 10⁻⁵ 3.66 × 10⁻² -0.02 FITM2 (-15818), R3HDML (-9999) - 60 22 32599511 32599649 138 5 1.13 × 10⁻⁵ 3.77 × 10⁻² -0.05 RFPL2 (-116) - 61 6 27185676 27186077 401 4 3.54 × 10⁻⁵ 4.04 × 10⁻² -0.05 PRSS16 (-29625), HIST1H2AH (+71016) - 62 12 133000383 133000831 448 4 4.13 × 10⁻⁵ 4.23 × 10⁻² 0.02 GALNT9 (-310034), MUC8 (+50119) - 63 1 146551565 146551745 180 2 1.68 × 10⁻⁵ 4.27 × 10⁻² -0.02 PRKAB2 (+92468), NBPF12 (+177599) - 64 6 28601269 28601520 251 14 2.43 × 10⁻⁵ 4.44 × 10⁻² -0.03 SCAND3 (-46283), TRIM27 (+290371) - 65 7 117854304 117854635 331 3 3.48 × 10⁻⁵ 4.81 × 10⁻² -0.02 ANKRD7 (-10260), NAA38 (+30384) Promoter 66 6 30656499 30656693 194 7 2.06 × 10⁻⁵ 4.86 × 10⁻² 0.01 PPP1R18 (-924) -
Table 4. Homocysteine-associated differentially methylated regions. Rank Chr Start End Bp
length # CpGs
p-value Sidak-P Mean effect size
Annotated genes Location
67 3 49723947 49724292 345 3 3.75 × 10⁻⁵ 4.96 × 10⁻² -0.02 RNF123 (-2812), MST1 (+2366) - 68 16 129230 129563 333 3 3.63 × 10⁻⁵ 4.98 × 10⁻² 0.01 MPG (+1141), NPRL3 (+59272) Promoter
bp: Base pair; Chr: Chromosome.
Figure 3. Manhattan plot showing the association between homocysteine and genome-wide DNA methylation in 2035 samples, with 68 significant differentially methylated regions, at false discovery rate less than 0.05 (red line) of autocorrelation adjusted p-values in comb-p.
Nearest genes for the top five DMRs are reported. DMR: Differentially methylated region.
Table 5. KEGG pathway analysis using WebGestalt tool.
Pathways Enrichment
ratio
rawP adjP Number of genes Genes Metabolism Metabolic pathways 4.13 3.60 × 10⁻⁵ 0.0006 12 MAN2A2, GGT1, ALPPL2, GALNT9, ALPP, AGPAT1, TPO, BST1, ST3GAL5, EXT2, XDH, PLA2G4E
Folate biosynthesis 70.64 0.0004 0.0034 2 ALPPL2, ALPP
Glycosaminoglycan biosynthesis - heparan sulfate 29.89 0.002 0.0113 2 HS6ST1, EXT2 Arachidonic acid metabolism 13.17 0.0102 0.0217 2 GGT1, PLA2G4E Glycerophospholipid metabolism 9.71 0.0182 0.0314 2 PLA2G4E, AGPAT1 Cellular processes
Phagosome 7.62 0.0073 0.0207 3 TAP2, SEC61G, THBS1 Environmental information processing
MAPK signaling pathway 5.80 0.0052 0.0207 4 FGFR2, RASGRP1, STK4, PLA2G4E
ECM-receptor interaction 9.14 0.0204 0.0314 2 THBS1, TNXB Organismal systems
Fat digestion and absorption 16.89 0.0063 0.0207 2 PLA2G4E, AGPAT1
Salivary secretion 8.73 0.0222 0.0314 2 DMBT1, BST1
Fc gamma R-mediated phagocytosis
8.27 0.0246 0.0322 2 PLA2G4D, PLA2G4E
Pancreatic secretion 7.69 0.0281 0.0341 2 BST1, PLA2G4E Genetic information processing
Table 5. KEGG pathway analysis using WebGestalt tool.
Pathways Enrichment
ratio
rawP adjP Number of genes Genes Protein processing in endoplasmic reticulum 7.06 0.009 0.0217 3 ATF6B, SEC61G, RNF5 Human diseases HCM 9.36 0.0195 0.0314 2 SGCG, PRKAB2
ECM: Extracellular matrix; HCM: Hypertrophic cardiomyopathy.
Table 6. GO analysis using WebGestalt tool. GO Id Description Enrichment
Ratio
rawP adjP No. of genes
Genes
Biological process
GO:0048568 Embryonic organ development
5.89 8.31 × 10⁻⁷
0.0009 12 HEY2, HS6ST1, INSIG2, FGFR2, ALX4, HOXA2, HOXA5, SHH, TPO, HOXA6, SOX17, STK4
GO:0003002 Regionalization 5.79 2.95 × 10⁻⁶
0.001 11 CYP26B1, HEY2, FGFR2, ALX4, PRKDC, HOXA2, HOXA5, SHH, HOXA6, SOX17, SP8
GO:0007389 Pattern specification process
4.89 2.25 × 10⁻⁶
0.001 13 CYP26B1, HEY2, FOXK1, FGFR2, ALX4, PRKDC, HOXA2, HOXA5, SHH, HOXA6, SOX17, SP8, STK4
GO:0009790 Embryo development
3.25 7.56 × 10⁻⁶
0.002 18 CYP26B1, INSIG2, FOXK1, PRKDC, TPO, EXT2, SP8, HEY2, DMBT1, HS6ST1, ALX4, FGFR2, HOXA2, HOXA5, SHH, HOXA6, SOX17, STK4
GO:0048705 Skeletal system morphogenesis
7.27 1.42 × 10⁻⁵
0.003 8 CYP26B1, INSIG2, FGFR2, ALX4, HOXA2, HOXA5, HOXA6, THBS1
GO:0060484 Lung-associated mesenchyme development 48.77 2.62 × 10⁻⁵ 0.0046 3 FGFR2, HOXA5, SHH GO:0009952 Anterior/posterior pattern specification 6.25 4.17 × 10⁻⁵
0.0062 8 HEY2, ALX4, PRKDC, HOXA2, HOXA5, SHH, HOXA6, SOX17
GO:0048598 Embryonic morphogenesis
3.94 4.90 × 10⁻⁵
0.0064 12 CYP26B1, INSIG2, FGFR2, ALX4, HOXA2, HOXA5, SHH, HOXA6, SOX17, EXT2, SP8, STK4
GO:0048514 Blood vessel morphogenesis
4.13 6.83 × 10⁻⁵
0.0076 11 HEY2, HS6ST1, FGFR2, HOXA5, SHH, ADAM8, ESM1, SOX17, XDH, STK4, THBS1
GO:0043009 Chordate embryonic development
3.78 7.30 × 10⁻⁵
0.0076 12 HEY2, HS6ST1, DMBT1, FGFR2, ALX4, PRKDC, HOXA2, HOXA5, SHH, HOXA6, SOX17, STK4 GO:0009792 Embryo development ending in birth or egg hatching 3.74 8.15 × 10⁻⁵ 0.0077 12 HEY2, HS6ST1, DMBT1, FGFR2, ALX4, PRKDC, HOXA2, HOXA5, SHH, HOXA6, SOX17, STK4
GO:0060523 Prostate epithelial cord elongation
Table 6. GO analysis using WebGestalt tool. GO Id Description Enrichment
Ratio
rawP adjP No. of genes
Genes
GO:0051150 Regulation of smooth muscle cell differentiation
32.51 9.71 × 10⁻⁵
0.008 3 HEY2, FGFR2, SHH
GO:0060916 Mesenchymal cell proliferation involved in lung development
81.28 0.0002 0.0123 2 FGFR2, SHH
GO:0001568 Blood vessel development
3.63 0.0002 0.0123 11 HEY2, HS6ST1, FGFR2, HOXA5, SHH, ADAM8, ESM1, SOX17, XDH, STK4, THBS1
GO:0060737 Prostate gland morphogenetic growth 81.28 0.0002 0.0123 2 FGFR2, SHH GO:0061031 Endodermal digestive tract morphogenesis 81.28 0.0002 0.0123 2 FGFR2, SOX17 GO:0001944 Vasculature development 3.46 0.0003 0.0165 11 HEY2, HS6ST1, FGFR2, HOXA5, SHH, ADAM8, ESM1, SOX17, XDH, STK4, THBS1
GO:0001525 Angiogenesis 4.1 0.0003 0.0165 9 HS6ST1, FGFR2, HOXA5, SHH, ADAM8, ESM1, SOX17, STK4, THBS1
GO:0048562 Embryonic organ morphogenesis
5.24 0.0004 0.0199 7 INSIG2, HOXA6, FGFR2, ALX4, HOXA2, HOXA5, SHH
GO:0045165 Cell fate commitment
5.1 0.0004 0.0199 7 CYP26B1, HEY2, FGFR2, SOX17, PRKDC, HOXA2, SHH
GO:0060441 Epithelial tube branching involved in lung
morphogenesis
19.51 0.0005 0.0237 3 FGFR2, HOXA5, SHH
GO:0048565 Digestive tract development
7.39 0.0006 0.0241 5 FGFR2, SOX17, ALX4, HOXA5, SHH
GO:0001501 Skeletal system development
3.78 0.0006 0.0241 9 CYP26B1, INSIG2, FGFR2, ALX4, HOXA2, HOXA5, SHH, HOXA6, THBS1
GO:0048706 Embryonic skeletal system development
7.46 0.0006 0.0241 5 HOXA6, ALX4, HOXA2, HOXA5, SHH
GO:0030855 Epithelial cell differentiation
4.24 0.0006 0.0241 8 HEY2, DMBT1, FGFR2, HOXA5, SHH, SOX17, STK4, XDH
GO:0010467 Gene expression 1.51 0.0008 0.0246 44 BANP, SIGIRR, ATOH8, INSIG2, LIME1, SHQ1, ATF6B, SEC61G, SLC2A4RG, KLF13, TRIM27, EXT2, SP8, THBS1, HEY2, IL16, PADI4, GALNT9, H2AFY, PIWIL3, CRY2, SOX17, MRPL15, CEBPD, RYBP, CYP26B1, FOXK1, ZNF500, PRKDC, NAA38, ST3GAL5, SP4, CUZD1, MAN2A2, HS6ST1, FGFR2, ALX4, HOXA2, HOXA5, SHH, NCOA7, HOXA6, ADAM8, XDH
Table 6. GO analysis using WebGestalt tool. GO Id Description Enrichment
Ratio
rawP adjP No. of genes
Genes
GO:0060462 Lung lobe development
46.44 0.0008 0.0246 2 FGFR2, SHH
GO:0060463 Lung lobe morphogenesis
46.44 0.0008 0.0246 2 FGFR2, SHH
GO:0034766 Negative regulation of ion
transmembrane transport
46.44 0.0008 0.0246 2 TRIM27, THBS1
GO:0060664 Epithelial cell proliferation involved in salivary gland morphogenesis
46.44 0.0008 0.0246 2 FGFR2, SHH
GO:0060349 Bone morphogenesis 9.7 0.0008 0.0246 4 CYP26B1, INSIG2, FGFR2, THBS1
GO:0055123 Digestive system development
6.89 0.0008 0.0246 5 FGFR2, SOX17, ALX4, HOXA5, SHH
GO:0001570 Vasculogenesis 9.56 0.0008 0.0246 4 HEY2, SOX17, XDH, SHH
GO:0060439 Trachea morphogenesis 40.64 0.001 0.0268 2 HOXA5, SHH GO:2001212 Regulation of vasculogenesis 40.64 0.001 0.0268 2 HEY2, XDH
GO:0051151 Negative regulation of smooth muscle cell differentiation
40.64 0.001 0.0268 2 HEY2, SHH
GO:0033089 Positive regulation of T-cell differentiation in thymus
40.64 0.001 0.0268 2 ADAM8, SHH
GO:0045647 Negative regulation of erythrocyte differentiation
40.64 0.001 0.0268 2 KLF13, HOXA5
GO:0035108 Limb morphogenesis 6.25 0.0012 0.0291 5 CYP26B1, FGFR2, ALX4, SP8, SHH Cellular component
GO:0031225 Anchored to membrane
6.64 0.0003 0.0158 6 GGT1, DPEP1, ALPPL2, ALPP, BST1, GFRA4
GO:0012505 Endomembrane system
2.16 0.0002 0.0158 24 CYP26B1, MAP1LC3C, INSIG2, ATF6B, SEC61G, AGPAT1, SLC35C1, TRIM27, ST3GAL5, EXT2, CUZD1, PLA2G4D, MAN2A2, DMBT1, HS6ST1, GALNT9, FITM2, DYSF, TAP2, C8orf17, LRRC59, ADAM8, RNF5, RASGRP1
GO:0042589 Zymogen granule membrane
39.84 0.0011 0.0385 2 CUZD1, DMBT1
Discussion
This is the first large-scale epigenome-wide site-specific collaborative meta-analysis studying the relationship between plasma Hcy levels and methylation at a genome-wide level. Our results show that plasma Hcy concentrations were associated with three DMPs and 68 DMRs. Identification of this relatively low number of DMPs is surprising, given the central role of Hcy in the methylation cycle.
The most significant of the three DMPs, cg21607669 is located at chromosome 19 near the promoter region of the gene SLC27A1 (+40 bp downstream). SLC27A1 assists in the transport of fatty acids across cell membrane, and its highest levels are found in muscle and adipose tissue [62]. Results from a recent meta-analysis demonstrated that omega-3 polyunsaturated fatty acid supplementation was associated with Hcy lowering [63]. It was hypothesized that the omega-3 fatty acid, docosahexaenoic acid upregulates metabolic enzymes of the one-carbon pathway like MAT resulting in increased s-adenosylmethionine bioavailability [63]. The exact role of hypermethylation of SLC27A1 should be further investigated to understand its possible role in the relation between polyunsaturated fatty acids and HHcy.
The second significant DMP, cg26382848 is located at chromosome 14 near the promoter region of the gene AJUBA (-39 bp upstream). AJUBA plays a role in cellular processes such as cell migration, proliferation and differentiation [64,65]. It functions as a negative regulator of the retinoic signaling [66] and Hippo signaling pathway [67], and is involved in tumors [68]. However, the precise role of this gene is less clear and future replication studies are necessary to establish the role of this gene in relation to Hcy.
The third significant DMP, cg10701000 at chromosome 10 annotated to the nearby gene
KCNMA1 (-143,626 bp upstream). KCNMA1 is a potassium calcium-activated channel and
has its prominent role in many physiological processes of smooth muscles, hair cells and diseases of nervous system and cancer [69]. A recent study has shown that elevated cellular Hcy increases the activity of potassium calcium-activated channel in GH3 pituitary cells [70], while two other previous studies have reported that Hcy inhibits these channels of artery smooth muscle cells [71,72]. Our finding of hypermethylation near the KCNMA1 gene supports the involvement of Hcy in potassium calcium-activated channel.
We specifically studied the IGF2/H19 locus, the most frequently studied locus in relation to Hcy levels, and found that none of the CpGs on the array that were annotated to this locus showed an association with Hcy. We could therefore not corroborate results from two earlier studies that did find a relationship between Hcy levels and methylation at the IGF2/H19 locus [19,20]. The reason could be that these studies were performed in HHcy mice models with heterogeneous knockout of the CBS gene, fed with high methionine and low folate diet. CBS deficiency is an inborn error of metabolism that leads to Hcy concentrations much higher at intermediate to severe levels, as compared with the ones present in our study. Furthermore, in human studies of patients with HHcy and uremia, the influence of Hcy on H19 methylation is also observed at a concentration of Hcy much higher at intermediate levels, as compared with the mild levels present in our study, and the monoallelic expression of H19 is shown to be reversed by folate supplementation [10]. Therefore, our results cannot be directly extrapolated in other populations where Hcy is higher especially in chronic renal failure and rare diseases of metabolism. However, our results are in line with another human study which did not find differences in intermediate HHcy patients with CBS deficiency and controls [36]. These patients were under Hcy-lowering therapy, which would have prevented the association with
H19 DMR. Therefore, mildly elevated Hcy levels do not seem to be related to differences in
methylation of the IGF2/H19 region in circulating leukocytes. Furthermore, focusing our analysis on the previously found CpGs in newborns in relation to maternal plasma folate during pregnancy, we did not find significant enrichment. We expected some enrichment because of the strong association of Hcy with folate. The reason for not finding enrichment could be related to the different study design of mother-offspring relationship compared with population-based cohorts.
Regional analysis using the comb-p software identified 68 DMRs significant at Sidak-P less than 0.05. The most significant was 1.8-kb DMR located at chromosome 6 spanning 55 CpGs. This DMR was annotated to the genes TNXB and ATF6B. TNXB is located within the class III region of the major histocompatibility complex [73] that had multiple CpG sites previously shown to be hypermethylated in anorexia nervosa patients compared with controls [74,75]. Another gene located near this DMR is the ATF6B gene. This gene is involved in the unfolded protein response during endoplasmic reticulum stress and has been shown to be activated upon Hcy treatment to human endothelial cells [76]. More specifically a putative ATF6-binding motif was identified, which was shown to be demethylated upon treatment with Hcy, which supports our findings of possible involvement of altered methylation of ATF6B in relation to HHcy.
Among the other DMRs, there were a number of interesting regions that had prior studies connecting Hcy to the genes annotated near the CpGs. For example, the DMR
Chr.6:32,145,146–32,146,780 is annotated to the genes AGPAT1 and RNP5. This region was previously found associated to serum vitamin B12 in elderly subjects with elevated Hcy in our previous study of B-vitamins for the PRevention Of Osteoporotic Fractures (B-PROOF) [77]. Other DMRs, Chr.7:27,142,100–27,142,811 and Chr.7:27,187,269–27,187,692 were
annotated to the HOX genes, which were previously shown to be differentially methylated after a 2-year intervention with folic acid and vitamin B12 [77]. Another gene DPEP1 annotated to the DMR Chr.16:89,689,811–89,690,263, is involved in renal function and contains SNPs previously shown to be associated with Hcy [78–80]. Furthermore, gene
PADI4 of DMR Chr.1:17,634,543–17,634,717 previously showed to citrullinate DNMT3A,
and therefore interacting with it to control DNA methylation [81]. And lastly, two out of eight CpGs of DMR Chr.5:54,281,198–54,281,734 were significantly shown associated with maternal plasma folate levels during pregnancy in cord blood [55]. These regions are promising to be replicated in future studies.
DMR analysis is recommended as a part of the analysis pipeline in addition to CpG site analysis [82,83]. It has been shown that methylation is regulated in genomic regions, which merits the identification of DMRs in addition to single CpGs. Several software packages are available to perform DMR analysis, with their own strengths and weaknesses
(i.e., Bumphunter, DMRcate) [84]. In this paper, we applied comb-p that constructs regions based on the autocorrelation between the p-values at varying lags in a sliding window, which is a good approach for the unevenly spaced CpGs in the 450 k array [56]. A recent paper has shown that comb-p has good sensitivity. However, if the data signal is weak, comb-p has the tendency to return false-positives particularly in presence of low effect size [85]. We,
therefore, decided to check the DMR results of comb-p in the Rotterdam study subset of 700 individuals, and compare them with the DMR results of another package, DMRcate [84]. Of the 49 significant DMRs within the subset of 700 individuals we found using comb-p
Results of comp-b seem valid but further studies are also necessary to validate these findings further.
Pathway analysis on the 114 genes annotated to the 68 DMRs identified pathways related to metabolism such as folate biosynthesis, glycosaminoglycan biosynthesis, arachidonic acid metabolism and glycerophospholipid metabolism. This could suggest how elevated Hcy can affect other important pathways via DNA methylation impairment. Folate pathways contained two genes: ALPPL2 and ALPP. An important paralog of these genes, which is ALPL,
previously showed polymorphisms that were associated with vitamin B6 that suggests its possible role in vitamin B6 catabolism [86]. However, these genes need to be further
replicated because of its low number in the pathway. Results of the GO enrichment analysis showed many biological processes related to embryogenesis and development, where Hcy has most variedly shown to play a role by previous studies.
Most of the studies until now investigated this association by measuring DNA methylation at a global level. The strength of our study is that the association of mild HHcy with genome-wide DNA methylation using 450 k arrays was studied. Second, this is the largest epigenome-wide association study on Hcy including 2035 individuals.
Limitations of our study are that clinical heterogeneity between cohorts may have prevented us of finding additional true significant associations. Cohorts were either population based, or cases with venous thromboembolism, or have a mildly increased risk to develop Type 2 diabetes and/or cardiovascular disease. Hcy concentrations and related mechanisms may vary with such different pathophysiologies [87]. Furthermore, Hcy median concentrations were generally low in each cohort, with only 10.2–32.3% of individuals in the mild HHcy range more than 15 μmol/l (Table 1), which could explain the subtle findings. Second, we
acknowledge that Hcy levels were measured using different techniques in each study, either in fasting or nonfasting state, as well as there were differences in sample collections per cohort. However, the methylation analyses were done in each cohort separately, and the results of each separate study were then meta-analyzed. Our results are therefore not biased by the differences in Hcy measurement methods, state of fasting or sample collection. Nevertheless, this heterogeneity across cohorts could have resulted in null findings. Third, we did not account for differences in nutritional folate and/or vitamin B12 intake and B-vitamin
supplementation, or Hcy-related diseases like renal insufficiency that could have confounded the results of our study [87]. We also did not account for the genetic background of
individuals, especially methylenetetrahydrofolate reductase (MTHFR) 677C >T that is associated with Hcy [88]. We could have accounted for these confounding factors, but not all of these data were available to us. In addition, these confounding factors like folate, vitamin B12 and MTHFR 677C >T belong to the same pathway and are highly correlated with Hcy. This would have cancelled out the effect of Hcy itself on DNA methylation. We had
hypothesized that Hcy is associated with DNA methylation regardless of the cause. However, adjusting for MTHFR 677C >T in the linear-mixed model analysis in Rotterdam study-III and Cohort on Diabetes and Atherosclerosis Maastricht did not change the findings (data not shown). Fourth, we did not account for population stratification in the methylation analysis of each cohort because all individuals were of European ancestry. But in order to check the influence of this, we reran the analysis only in the Rotterdam study by additionally adjusting for four genetic principal components (PCs). The results still showed no significant DMPs (FDR < 0.05). In addition, the three significant DMPs of meta-analysis showed same direction of effects with and without the four genetic PCs correction (Supplementary Figure 6).
would reduce statistical power. Fifth, Hcy effect could be exclusive to certain other tissues like heart, liver and brain. Future studies still need to explore such findings. And lastly, even though we included 2035 individuals from all the possible studies to our knowledge who had Hcy and DNA methylation data measured at the same time point, statistical power might still be low to identify significant DMP signals. As such, replication was not easily tractable, a main limitation of our results.
Conclusion
Our meta-analysis showed three DMPs at chromosome 19, 14 and 10 with nearby genes of
SLC27A1 and AJUBA, and 68 DMRs associated with Hcy concentrations. Knowing the
prominent role of Hcy in donation of methyl groups, we expected to find more DMPs. However, DMR analysis does show promising findings, but their role in relation to one-carbon metabolism needs to be further investigated.
Summary points
• Plasma homocysteine is significantly associated with a modest number of differentially methylated positions in leukocyte DNA.
• Sixty-eight differentially methylated regions related to 114 genes were significantly associated with plasma homocysteine. These genes were involved in folate
biosynthesis, glycosaminoglycan biosynthesis, arachidonic acid metabolism and glycerophospholipid metabolism.
Acknowledgements
The authors thank Michael Verbiest, Mila Jhamai, Sarah Higgins and Marijn Verkerk for their help in creating the methylation database. The authors also thank Wilma Verbree and Wim Schilleman for measuring homocysteine. The authors are grateful to the study participants, the staff from the Rotterdam Study and the participating general practitioners and pharmacists. The authors thank all participants of the Leiden Longevity Study. The authors also thank V Soo for his assistance with laboratory work. EGCUT data analyses were carried out in part in the High Performance Computing Center of University of Tartu.
The Rotterdam Study (RS)
The generation and management of the Illumina 450 K methylation array data (EWAS data) for the Rotterdam Study was executed by the Human Genotyping Facility of the Genetic Laboratory of the Department of Internal Medicine, Erasmus MC, the Netherlands. The EWAS data was funded by the Genetic Laboratory of the Department of Internal Medicine, Erasmus MC, and by the Netherlands Organization for Scientific Research (NWO; project number 184021007) and made available as a Rainbow Project (RP3; BIOS) of the Biobanking and Biomolecular Research Infrastructure Netherlands (BBMRI-NL). Homocysteine analysis was funded by the Department of Clinical Chemistry.
The Rotterdam Study is funded by Erasmus Medical Center and Erasmus University, Rotterdam, Netherlands Organization for the Health Research and Development (ZonMw), the Research Institute for Diseases in the Elderly (RIDE), the Ministry of Education, Culture and Science, the Ministry for Health, Welfare and Sports, the European Commission (DG XII) and the Municipality of Rotterdam.
The Leiden Longevity Study (LLS)
This study received funding from the European Union’s Seventh Framework Programme (FP7/2007–2011) under grant agreement no. 259679, from the Innovation-Oriented Research Program on Genomics (SenterNovem IGE05007), the Centre for Medical Systems Biology, from the Netherlands Consortium for Healthy Ageing (grant 050–060–810), and from the Biobank-Based Integrative Omics Studies (BIOS) Consortium funded by BBMRI-NL, a research infrastructure financed by the Dutch government (NWO 184.021.007), all in the framework of the Netherlands Genomics Initiative, Netherlands Organization for Scientific Research (NWO).
The MARseille THrombosis Association Study (MARTHA)
The MARTHA project was supported by grants from the Program Hospitalier de Recherche Clinique. The methylation array typing was funded by the Canadian Institutes of Health Research (grant MOP 86466) and the Heart and Stroke Foundation of Canada (grant T6484). Statistical analyses of the MARTHA dataset were performed using the C2BIG computing cluster funded by the Region Ile de France, Pierre and Marie Curie University and the ICAN Institute for Cardiometabolism and Nutrition (ANR-10-IAHU-05). D Aïssi was financially supported by grants from the Region Ile de France (CORDDIM) and La Nouvelle Société Française d’Athérosclérose.
Estonian Genome Center of the University of Tartu (EGCUT)
This research was supported by the European Union through the European Regional Development Fund in the framework of the Centre of Excellence for Genomics and
Translational Medicine (Project No. 2014–2020.4.01.15–0012), ePerMed - EU 2020 (grant no. 692145), and the Estonian Research Council (grant IUT20–60).
French-Canadian Family Study on Factor V Leiden (F5L) thrombophilia
The French-Canadian Family Study on Factor V Leiden (F5L) Thrombophilia (F5L Family Study) was supported by the Canadian Institutes of Health Research (Grant MOP 86466) and by the Heart and Stroke Foundation of Canada (Grant T6484). F Gagnon is recipient of a Canada Research Chair.
The authors have no other relevant affiliations or financial involvement with any organization or entity with a financial interest in or financial conflict with the subject matter or materials discussed in the manuscript apart from those disclosed.
No writing assistance was utilized in the production of this manuscript. Ethical conduct of research
All participants provided a written informed consent, and each study was approved at the relevant organizations by their respective ethics review committees (RS, Institutional review board [Medical Ethics Committee] of the Erasmus Medical Center; LLS, Ethical committee of the Leiden University Medical Center; CODAM, Medical Ethical Committee of the
Maastricht University; MARTHA, ‘Departement santé de la direction générale de la recherche et de l’innovation du ministère’ [Projects DC: 2008–880 & 09.576]; EGCUT;
Research Ethics Committee of the University of Tartu; F5L, Research ethics boards of the University of Toronto and the Ottawa Hospital Research Institute).
References
1 van Meurs JB, Dhonukshe-Rutten RA, Pluijm SM et al.Homocysteine levels and the risk of osteoporotic fracture.N.Engl.J.Med.350,2033–2041 (2004).
2 Boushey CJ, Beresford SA, Omenn GS, Motulsky AG. A quantitative assessment of plasma homocysteine as a risk factor for vasculardisease. Probable benefits of increasing folic acid intakes.JAMA274, 1049–1057 (1995).
3 Toole JF, Malinow MR, Chambless LEet al.Lowering homocysteine in patients with ischemic stroke to prevent recurrent stroke,myocardial infarction, and death: the Vitamin Intervention for Stroke Prevention (VISP) randomized controlled trial.JAMA291,565–575 (2004).
4 Lonn E, Yusuf S, Arnold MJet al.Homocysteine lowering with folic acid and B vitamins in vascular disease.N. Engl. J. Med.354,1567–1577 (2006).
5 Bonaa KH, Njolstad I, Ueland PMet al.Homocysteine lowering and cardiovascular events after acute myocardial infarction.N. Engl. J.Med.354, 1578–1588 (2006).
6 van Wijngaarden JP, Swart KM, Enneman AWet al.Effect of daily vitamin B-12 and folic acid supplementation on fracture incidence inelderly individuals with an elevated plasma homocysteine concentration: B-PROOF, a randomized controlled trial.Am. J. Clin. Nutr.100, 1578–1586 (2014). 7 Fu W, Dudman NP, Perry MA, Young K, Wang XL. Interrelations between plasma homocysteine and intracellularS-adenosylhomocysteine.Biochem. Biophys. Res. Commun.271, 47–53 (2000). 8 James SJ, Melnyk S, Pogribna M, Pogribny IP, Caudill MA. Elevation in S-adenosylhomocysteine and DNA hypomethylation: potentialepigenetic mechanism for homocysteine-related pathology.J. Nutr.132, S2361–S2366 (2002).
9 Yi P, Melnyk S, Pogribna M, Pogribny IP, Hine RJ, James SJ. Increase in plasma homocysteine associated with parallel increases inplasma S-adenosylhomocysteine and lymphocyte DNA hypomethylation.J. Biol. Chem.275, 29318–29323 (2000).future science group
10 Ingrosso D, Cimmino A, Perna AFet al.Folate treatment and unbalanced methylation and changes of allelic expression induced byhyperhomocysteinaemia in patients with uraemia.Lancet.361, 1693– 1699 (2003).
11 Kang SS, Wong PW, Malinow MR. Hyperhomocyst(e)inemia as a risk factor for occlusive vascular disease.Annu. Rev. Nutr.12,279–298 (1992).
12 Weiss N, Keller C, Hoffmann U, Loscalzo J. Endothelial dysfunction and atherothrombosis in mild hyperhomocysteinemia.Vasc. Med.7, 227–239 (2002).
13 Castro R, Rivera I, Struys EAet al.Increased homocysteine and S-adenosylhomocysteine concentrations and DNA hypomethylation invascular disease.Clin. Chem.49, 1292–1296 (2003). 14 Mandaviya PR, Stolk L, Heil SG. Homocysteine and DNA methylation: a review of animal and human literature.Mol. Genet. Metab.113, 243–252 (2014).
15 Jiang Y, Zhang H, Sun Tet al.The comprehensive effects of hyperlipidemia and
hyperhomocysteinemia on pathogenesis ofatherosclerosis and DNA hypomethylation in ApoE mice.Acta Biochim. Biophys. Sin. (Shanghai)44, 866–875 (2012).
16 Chen Z, Karaplis AC, Ackerman SLet al.Mice deficient in methylenetetrahydrofolate reductase exhibit hyperhomocysteinemia anddecreased methylation capacity, with neuropathology and aortic lipid deposition.Hum. Mol. Genet.10, 433–443 (2001).
17 Jadavji NM, Deng L, Leclerc Det al.Severe methylenetetrahydrofolate reductase deficiency in mice results in behavioral anomalies withmorphological and biochemical changes in hippocampus.Mol. Genet. Metab.106, 149–159 (2012).
18 Choumenkovitch SF, Selhub J, Bagley PJet al.In the cystathionine beta-synthase knockout mouse, elevations in total plasmahomocysteine increase tissue adenosylhomocysteine, but responses of S-adenosylmethionine and DNA methylation are tissue specific.J. Nutr.132, 2157–2160 (2002).
19 Devlin AM, Bottiglieri T, Domann FE, Lentz SR. Tissue-specific changes in H19 methylation and expression in mice withhyperhomocysteinemia.J. Biol. Chem.280, 25506–25511 (2005).
20 Glier MB, Ngai YF, Sulistyoningrum DC, Aleliunas RE, Bottiglieri T, Devlin AM. Tissue-specific relationship ofS-adenosylhomocysteine with allele-specific H19/Igf2 methylation and imprinting in mice with hyperhomocysteinemia.Epigenetics 8,44–53 (2013).
21 Ma S, Zhang H, Sun Wet al.Hyperhomocysteinemia induces cardiac injury by up-regulation of p53-dependent Noxa and Baxexpression through the p53 DNA methylation in ApoE(-/-))mice.Acta Biochim. Biophys. Sin. (Shanghai)45, 391–400 (2013).
22 Zhang D, Wen X, Wu W, Xu E, Zhang Y, Cui W. Homocysteine-related hTERT DNA demethylation contributes to shortenedleukocyte telomere length in
atherosclerosis.Atherosclerosis231, 173–179 (2013).
23 Sontag E, Nunbhakdi-Craig V, Sontag JMet al.Protein phosphatase 2A methyltransferase links homocysteine metabolism with tau andamyloid precursor protein regulation.J. Neurosci.27, 2751– 2759 (2007).
24 Devlin AM, Singh R, Bottiglieri T, Innis SM, Green TJ. Hepatic acyl-coenzyme a:cholesterol acyltransferase-2 expression is decreased inmice with hyperhomocysteinemia.J. Nutr.140, 231–237. (2010).
25 Sulistyoningrum DC, Singh R, Devlin AM. Epigenetic regulation of glucocorticoid receptor expression in aorta from mice with hyperhomocysteinemia.Epigenetics7, 514–521 (2012).
26 Devlin AM, Singh R, Wade RE, Innis SM, Bottiglieri T, Lentz SR. Hypermethylation of Fads2 and altered hepatic fatty acid andphospholipid metabolism in mice with hyperhomocysteinemia.J. Biol. Chem.282, 37082–37090 (2007).
27 Farkas SA, Bottiger AK, Isaksson HS, Finnell RH, Ren A, Nilsson TK. Epigenetic alterations in folate transport genes in placental tissuefrom fetuses with neural tube defects and in leukocytes from subjects with hyperhomocysteinemia.Epigenetics8, 303–316 (2013).
28 Kim CS, Kim YR, Naqvi Aet al.Homocysteine promotes human endothelial cell dysfunction via site-specific epigenetic regulation ofp66shc.Cardiovasc. Res.92, 466–475 (2011).
29 Rodriguez-Esparragon F, Serna-Gomez JA, Hernandez-Velazquez Eet al.Homocysteinylated protein levels in internal mammary artery(IMA) fragments and its genotype-dependence. S-homocysteine-induced methylation modifications in IMA and aortic fragments.Mol.Cell. Biochem.369, 235–246 (2012).
30 Huang YS, Zhi YF, Wang SR. Hypermethylation of estrogen receptor-alpha gene in atheromatosis patients and its correlation withhomocysteine.Pathophysiology16, 259–265 (2009).
31 Al-Ghnaniem R, Peters J, Foresti R, Heaton N, Pufulete M. Methylation of estrogen receptor alpha and mutL homolog 1 in normalcolonic mucosa: association with folate and vitamin B-12 status in subjects with and without colorectal neoplasia.Am. J. Clin. Nutr.86,1064–1072 (2007).
32 Pirouzpanah S, Taleban FA, Atri M, Abadi AR, Mehdipour P. The effect of modifiable potentials on hypermethylation status of retinoicacid receptor-beta2 and estrogen receptor-alpha genes in primary breast cancer.Cancer Causes Control21, 2101–2111 (2010).
33 Vasavi M, Ponnala S, Gujjari Ket al.DNA methylation in esophageal diseases including cancer: special reference to hMLH1 genepromoter status.Tumori.92, 155–162 (2006).
34 Naushad SM, Reddy CA, Kumaraswami Ket al.Impact of hyperhomocysteinemia on breast cancer initiation and progression: epigeneticperspective.Cell Biochem. Biophys.68, 397–406 (2014).
35 Baccarelli A, Wright R, Bollati Vet al.Ischemic heart disease and stroke in relation to blood DNA methylation.Epidemiology21,819–828 (2010).
36 Heil SG, Riksen NP, Boers GH, Smulders Y, Blom HJ. DNA methylation status is not impaired in treated cystathionine beta-synthase(CBS) deficient patients.Mol. Genet. Metab.91, 55–60 (2007). 37 Hsu CY, Sun CY, Lee CC, Wu IW, Hsu HJ, Wu MS. Global DNA methylation not increased in chronic hemodialysis patients: acase-control study.Ren. Fail34, 1195–1199 (2012).
38 Hofman A, Brusselle GG, Darwish Murad Set al.The Rotterdam Study: 2016 objectives and design update.Eur. J. Epidemiol.30,661–708 (2015).
39 Westendorp RG, van Heemst D, Rozing MPet al.Nonagenarian siblings and their offspring display lower risk of mortality andmorbidity than sporadic nonagenarians: The Leiden Longevity Study.J. Am. Geriatr. Soc.57, 1634–1637 (2009).
40 van Greevenbroek MM, Jacobs M, van der Kallen CJet al.Human plasma complement C3 is independently associated with coronaryheart disease, but only in heavy smokers (the CODAM study).Int. J. Cardiol.154, 158–162 (2012).
41 Antoni G, Morange PE, Luo Yet al.A multi-stage multi-design strategy provides strong evidence that the BAI3 locus is associated withearly-onset venous thromboembolism.J. Thromb. Haemost.8, 2671–2679 (2010).
42 Leitsalu L, Haller T, Esko Tet al.Cohort profile: Estonian biobank of the Estonian Genome Center, University of Tartu.Int. J.Epidemiol.44, 1137–1147 (2015).
43 Graham Upton, Ian C.Understanding Statistics.Oxford University Press, UK (1996).44Bibikova M, Barnes B, Tsan Cet al.High density DNA methylation array with single CpG site resolution.Genomics 98, 288–295 (2011).
45 Pidsley R, Y Wong CC, Volta M, Lunnon K, Mill J, Schalkwyk LC. A data-driven approach to preprocessing Illumina 450 K methylation array data.BMC Genomics14, 293 (2013).
46 Maksimovic J, Gordon L, Oshlack A. SWAN: subset-quantile within array normalization for illumina infinium HumanMethylation450 BeadChips.Genome Biol.13, R44 (2012).
47 Aryee MJ, Jaffe AE, Corrada-Bravo H et al. Minfi: a flexible and comprehensive bioconductor package for the analysis of infinium DNA methylation microarrays. Bioinformatics 30, 1363–1369 (2014).
48 Willer CJ, Li Y, Abecasis GR. METAL: fast and efficient meta-analysis of genomewide association scans. Bioinformatics 26, 2190–2191(2010).
49 Marc Jan Bonder RL, Zhernakova D, Moed M et al. Disease variants alter transcription factor levels and methylation of their binding sites. bioRxiv 49(1), 131–138 (2015).
50 Devlin B, Roeder K. Genomic control for association studies. Biometrics 55, 997–1004 (1999). 51 McLean CY, Bristor D, Hiller M et al. GREAT improves functional interpretation of cis-regulatory regions. Nat. Biotechnol. 28, 495–501 (2010).
52 Speir ML, Zweig AS, Rosenbloom KR et al. The UCSC Genome Browser database: 2016 update.Nucleic Acids Res. 44, D717–D725 (2016).
53 Koukoura O, Sifakis S, Soufla G et al. Loss of imprinting and aberrant methylation of IGF2 in placentas from pregnancies complicated with fetal growth restriction. Int. J. Mol. Med.28, 481–487 (2011).
54 GuoL,ChoufaniS,FerreiraJ et al. Altered gene expression and methylation of the human
chromosome 11 imprinted region in small for gestational age (SGA) placentae. Dev. Biol. 320, 79–91 (2008).
55 Joubert BR, den Dekker HT, Felix JF et al. Maternal plasma folate impacts differential DNA methylation in an epigenome-wide meta-analysis of newborns. Nat. Commun. 7, 10577 (2016). 56 Pedersen BS, Schwartz DA, Yang IV, Kechris KJ. Comb-p: software for combining, analyzing, grouping and correcting spatially correlated P-values. Bioinformatics 28, 2986–2988 (2012).
57 Dai H, Leeder JS, Cui Y. A modified generalized Fisher method for combining probabilities from dependent tests. Front. Genet. 5, 32 (2014).
58 Stouffer SA et al.(Eds). The American Soldier: Adjustment During Army Life (Volume I).Princeton University Press, NJ, USA (1949).
59 Liptak P. On the combination of independent tests. Magyar Tudomanyos. Akademia Matematikai Kutato Intezetenek Kozlemenyei 3, 171–197 (1958).
60 Sidak Z. Rectangular confidence region for the means of multivariate normal distributions.J. Am. Stat. Assoc. 62(318), 626–633 (1967).
61 Wang J, Duncan D, Shi Z, Zhang B. WEB-based GEne SeT AnaLysis Toolkit (WebGestalt): update 2013.Nucleic Acids Res.41,W77–W83 (2013).
62 Martin G, Nemoto M, Gelman Let al.The human fatty acid transport protein-1 (SLC27A1; FATP-1) cDNA and gene: organization,chromosomal localization, and expression.Genomics66, 296–304 (2000).
63 Dawson SL, Bowe SJ, Crowe TC. A combination of omega-3 fatty acids, folic acid and B-group vitamins is superior at lowering homocysteine than omega-3 alone: a meta-analysis.Nutr. Res.36, 499– 508 (2016).future science group
64 Goyal RK, Lin P, Kanungo J, Payne AS, Muslin AJ, Longmore GD. Ajuba, a novel LIM protein, interacts with Grb2, augments mitogen-activated protein kinase activity in fibroblasts, and promotes meiotic maturation of Xenopus oocytes in a Grb2- and Ras-dependent manner. Mol. Cell Biol. 19, 4379–4389 (1999).
65 Kanungo J, Pratt SJ, Marie H, Longmore GD. Ajuba, a cytosolic LIM protein, shuttles into the nucleus and affects embryonal cell proliferation and fate decisions. Mol. Biol. Cell 11, 3299–3313 (2000).
![Table 1. Characteristics of cohorts included in the homocysteine meta-analysis. Cohort N Coun try Type (pathoph ysiology) Women (%) Hcy‡(media n [ra nge ]) H Hcy (%) Method Total precision (C](https://thumb-eu.123doks.com/thumbv2/123doknet/14632433.548302/4.892.109.788.119.1162/characteristics-cohorts-included-homocysteine-analysis-cohort-ysiology-precision.webp)