HAL Id: hal-03221235
https://hal.archives-ouvertes.fr/hal-03221235
Submitted on 7 May 2021
HAL is a multi-disciplinary open access
archive for the deposit and dissemination of sci-entific research documents, whether they are pub-lished or not. The documents may come from teaching and research institutions in France or abroad, or from public or private research centers.
L’archive ouverte pluridisciplinaire HAL, est destinée au dépôt et à la diffusion de documents scientifiques de niveau recherche, publiés ou non, émanant des établissements d’enseignement et de recherche français ou étrangers, des laboratoires publics ou privés.
What can gross alpha/beta activities tell about 210Po
and 210Pb in the atmosphere?
Luca Terray, Donato D Amico, Olivier Masson, Jean-Christophe Sabroux
To cite this version:
Luca Terray, Donato D Amico, Olivier Masson, Jean-Christophe Sabroux. What can gross alpha/beta activities tell about 210Po and 210Pb in the atmosphere?. Journal of Environmental Radioactivity, Elsevier, 2020, 255, pp.106437. �10.1016/j.jenvrad.2020.106437�. �hal-03221235�
1
Journal of Environmental Radioactivity
2
What can gross alpha/beta activities tell about 210Po and 210Pb in
3
the atmosphere?
4
Luca Terray
: Laboratoire Magmas et Volcans, Université Clermont Auvergne,5 Aubière, France Et Laboratoire de Physique de Clermont, Université Clermont
6 Auvergne, Aubière, France
7 Donato D'Amico, Olivier Masson et Jean-Christophe Sabroux : Institut de
8 Radioprotection et de Sûreté Nucléaire (IRSN), Fontenay-aux-Roses, France
10 11 12 13 14 15 16 17 18 19 20 21 22 23 24 25 26 27 28 29 30 31 01 O 01 O
What can gross alpha/beta activities tell about Po and Pb in the atmosphère?
210 210
Abstract: Po and Pb represent the most abundant part of atmospheric aérosol long-lived natural radioactivity. Moreover, Pb- Po monitoring in the atmosphere can be of interest for tracking extreme natural events that can enhance the level of alpha/beta radioactivity in air. In this paper, we question the possibility to use routine gross alpha/beta measurements in order to monitor 210Po, 210Pb and 210Po/210Pb ratio in the atmosphere.
Based on joint gross alpha/beta measurement and 210Pb-210Po specific determination on 16
atmosphere samples, we show that (i) gross beta activity systematically overestimates 210Pb
activity due to the presence of interfering beta emitters and (ii) gross alpha activity mostly reflects Po activity even if an underestimation is always observed due to alpha particle attenuation. In order to determine Po/ Pb ratio, we discuss the advantages of using gross alpha activity time variation compared to specific 210Po measurements. Finally, the
gross alpha/beta ratio appear to be a good proxy of the Po/ Pb ratio when large-scale variations are to be monitored. We report a first reference level for the activity level of airborne 210Po in France of 13 ± 6 pBq/m3.
32 33 34 35 36 37 38 39 40 41 42 43 44 45 46 47 48 49 50 51 52 53 1. Introduction 210 210 210
Long-lived radon daughters (namely Pb, Bi and Po) are widely used in
atmospheric studies (see recent reviews by Baskaran, 2011, 2016). These radionuclides can be considered as tracers, as well as chronometers of air mass circulation. They are also useful to determine the residence time and the removal rate of aerosols in the atmosphere. In addition, they play a major role in the monitoring of atmospheric radioactivity because they are responsible for the most part of long-lived (> 5 days) natural radioactivity of atmospheric aerosols (see figure 1 and compilation in "Sources and effects of ionizing
radiation", UNSCEAR 2008 Report, 2010). Therefore, the levels of long-lived radon daughters and their natural variability mostly influence reference levels and alert thresholds in the atmospheric radioactivity monitoring and early warning context.
Extreme natural events such as volcanic eruptions, forest fires or dust resuspension events are known to release important quantities of radioactive 210Po into the atmosphere (e.g.
Lambert et al., 1982; Le Cloarec et al., 1995; Nho et al., 1996). For instance, Allard et al. (2016) recently reported that Ambrym volcano (Vanuatu) is continuously emitting 210Po into
the atmosphere at a rate of 210 TBq/year. In comparison, the estimated amount of polonium released during the October, 1957 Windscale accident is 42 TBq (Garland and Wakeford, 2007), which is to say only a fifth of the Ambrym cumulative emission in one year. Moreover, such natural discharge episodes are likely to happen regularly and in many places worldwide due to the important number of sources (either active volcanoes, burning
biomass or deserts), thus potentially increasing the exposure of local population to ionizing radiations (210Po is highly toxic when inhaled or ingested due to its very high specific activity
54 55 56 57 58 59 60 61 62 63 64 65 66 67 68 69 70 71 72 73 74 75 76
and émission of energetic alpha particles inside the body) and triggering anomalies of long-lived alpha radioactivity in the atmosphere.
Consequently, it appears important for atmospheric radioactivity monitoring purposes (including nuclear forensics) to be able to detect such events, which implies to discriminate between natural and anthropogenic sources, and to assessthe average background
concentration of airborne 210Po.
In this article, we investigate the possibility of determining atmospheric Po/ Pb ratio using gross alpha-beta activity measurements. Actually, both volcanic and forest fire plumes are traced at long-distance by an increase in the Po/ Pb ratio compared to background atmospheric values (Nho et al., 1997; Paatero et al., 2009). Indeed, high temperature
natural processes favour the release of the more volatile element, polonium, as compared to lead. Thus, Po/ Pb ratio is a relevant clue to attribute an increase of atmospheric
radioactivity to an extreme natural event such as a volcanic eruption or a forest fire. However, the specific measurement of Po and Pb at environmental levels requires either a long analysis on a very sensitive Germanium detector (210Pb) or a long and destructive chemical process (210Po) priorto radioactive counting. Therefore, a routine
"710 "710
monitoring of Pb and Po of atmospheric aerosols requires an important technical support and is not easy to set up and maintain from the operational point of view.
Contrastingly, gross alpha/beta activity measurements are easier to perform on a regular basis. Even if alpha/beta counting instruments are only able to discriminate beta and alpha particles and do not allow to infer the nature of the radionuclide, the technique has strong advantages: first, it does not need any sample preparation (the filter can be directly placed inside the counter) and second, alpha/beta counting devices can generally host many
77 78 79 80 81 82 83 84 85 86 87 88 89 90 91 92 93 94 95 96 97 98 99
samples. For these two reasons, this technique is widely used in the field of aérosol radioactivity monitoring. As far as France is concerned, there is a very dense network of nuclear power plants and other nuclear installations in France monitoring gross alpha/beta air indices on a daily basis (this network is referred to as Réseau National de Mesures de la
radioactivité de l'environnement, see the RNM website in the references). Therefore, if
alpha/beta gross activity ratio is found to be well representative of the Po/ Pb ratio it would then be possible to track the signature of extreme or at least unusual natural events with a simple (and already widely operational) routine procedure.
On one hand, the correlation between 210Pb and beta long-lived (>5 days) activities in
atmospheric aerosol samples has already been evidenced (Mattsson et al., 1996) suggesting that 210Pb is responsible for most of the beta long-lived activity. Nevertheless, the presence
of other beta emitters (like K, P or P) in the atmosphere is well known (Lal and Suess, 1968; Lujanien et al., 1997; Schery, 2001; Hernandez et al., 2005) and can occasionally reach significant levels. Occurrence of positive anomalies of these beta emitters could depend on several factors (such as the locality of the sampling point and the history of the air mass) and we still have to understand precisely the conditions leading to significant gaps between 210Pb and beta activity. On the other hand, the correlation between 210Po and alpha activity has
never been clearly established (as far as we know) on an important series of samples. Even if many individual measurements of the most naturally abundant alpha-emitters ( U, Th,
Ra) systematically point negligible activities compared to Po, the outstanding
contributor of the alpha atmospheric radioactivity (see figure 1 and table 14 in "Sources and effects of ionizing radiation", UNSCEAR 2008 Report,"2010), the validity of the
100 101 102 103 104 105 106 107 108 109 110 111 112 113 114 115 116 117 118 119 120 121 122
In this study we collected a series of atmospheric aérosol samples and measured on the
210 210
same aliquot (see methods hereafter) Pb, Po and gross alpha/beta activities in order to examine jointly the two aforementioned correlations. This allows us to finally assess the constraints on 210Po/210Pb ratio provided by gross alpha/beta activity ratio.
2. Methods
2.1 Atmospheric sampling
Atmospheric aerosols have been sampled on the top of the building of the
Observatoire de Physique du Globe de Clermont-Ferrand (OPGC) located in the Campus des Cézeaux (Aubière city, France) in the neighbourhood of Clermont-Ferrand city at an
elevation of about 400 m. We used a MegaVol-3000 particulate air sampler from Ecotech that was operated at a flow rate of 150 m3/h. Air was pumped through a polypropylene filter (3M) similar to the filters of OPERA-AIR network (see OPERA network website in the
references) with a minimum collection efficiency of about 95% for particles with an
aerodynamic diameter of 30 nm. The impacted area on the filter is a rectangle of 18 by 23 cm (414 cm2).
Eleven samples were collected on a weekly basis between March and June 2017. Five more samples were collected between February and June 2018. Sampling durations range
between 45 and 87 hours with a mean of 56 h, which is equivalent to a filtered air volume of 8,400 m3. Starting time and sampling duration were decided in order to avoid important precipitation events and shifts of meteorological regimes during sampling.
Each filter was dried and weighted before and after sampling in order to measure the sampled mass of dry particulate matter. Sample details are provided in table 1.
123 124 125 126 127 128 129 130 131 132 133 134 135 136 137 138 139 140 141 142 143 144 145 2.2 Radioactivity analysis
Immediately after drying and weighting operations, a circular aliquot of 125 mm diameter was cut in the centre of the filter and sent to IRSN-SAME laboratories in Le Vésinet, France, for a set of analyses. SAME (Service d'Analyses et de Métrologie de l'Environnement) is the service of IRSN in charge of environmental radioactivity measurements. The following 3-steps protocol was applied to the first eleven samples (collected in 2017):
- Step 1: gross alpha/beta counting of the aliquot and 210Pb measurement by
gamma spectrometry (with a germanium detector) as soon as it was received, approximately 5-10 days after sampling in order to get rid of the short-lived radon and thoron daughters (see figure 1). These analyses will be referred to as the 5-day analyses hereafter for convenience, even if some of them were not exactly performed 5 days after sampling (see table 1). 5-day gross alpha/beta counting is a typical measurement for most of atmospheric radioactivity monitoring systems and such measurements are commonly available in many places in France through a common sharing platform (see RNM website in the references).
- Step 2: Repetition of step 1 (gross alpha/beta counting and gamma spectrometry of the aliquot) 50 days after sampling, in order to reach the radioactive
equilibrium between 210Bi and 210Pb (210Bi is the daughter of 210Pb and has a half-
life of 5.2 days as compared to the 22.2-year half-life of its parent). These
analyses will be referred to as the 50-day analyses in the following. Such delayed analyses are rarely performed in the context of aerosol radioactivity monitoring but they present a significant interest when performed in addition to the 5-day
146 147 148 149 150 151 152 153 154 155 156 157 158 159 160 161 162 163 164 165 166 167 168
analyses. Indeed, this second set of measurements allows to make a direct
210 210
comparison between Pb and gross beta activity. Actually, Pb can only be indirectly measured by the alpha/beta counter through the decay of its daughter
Bi because the beta end-point energies of Pb are too low (i.e. Emax=17 and 63
keV) to produce detectable electrons, while 210Bi has a much higher beta end-
point energy (Emax = 1162 keV). After 50 days, 210Bi activity is equal to 210Pb
activity and then any difference between gross beta activity and 210Pb activity is
necessarily due to other radionuclides present in the filter.
- Step 3: specific measurement of 210Po by alpha spectrometry after mineralization
of the aliquot, chemical separation of polonium and plating of polonium onto silver plates.
The same aliquot was systematically used for all analyses in order to avoid potential biases due to sample heterogeneity. For the five samples collected in 2018, the protocol was composed of steps 1 and 3, and step 3 started just after step 1 was completed in order to minimize 210Po build-up in the sample before the measurement by alpha spectrometry.
2.3 Meaning of gross alpha/beta activities
Detection yields of gross alpha/beta counting detectors have been determined using
90Sr-90Y sources for beta and 239Pu for alpha. These sources have been produced by droplet
deposition of radioactive standard liquid solutions on blank filters. The type and geometry of these filters were similar to those of samples in order to minimize calibration biases due to different geometries and matrices between calibration sources and measured filters. Accordingly, gross beta activity is expressed as equivalent 90Sr activity and gross alpha
169 170 171 172 173 174 175 176 177 178 179 180 181 182 183 184 185 186 187 188 189 190 191
However, since different radionuclides emit particles (either beta électrons or alpha
particles) with different energies, the detection yield obtained with some radionuclides (90Sr-
Y and Pu in our case) might not be representative of the detection yield for any other radionuclide. In order to better interpret the results, some qualitative considerations can be made. As far as gross alpha activity is concerned, it should be noted that 239Pu alpha particle energies (5,105-5,156 keV) are close to 210Po alpha particle energy (5,304 keV). Therefore,
the <4% relative difference of initial alpha particle energy might have a negligible effect on the detection yield since it is similar or even lower compared to typical alpha energy resolution measured above air filters (full width at half maximum from a few hundred keV up to 1 MeV according to Moore et al., 1993). However, mechanisms affecting alpha activity measurements of air filters are numerous and complex to assess (e.g. Geryes et al., 2009) and a bias on the yield could still arise from external factors such as the depth of
radionuclide entrapment in the filter, or alpha energy absorption by aerosol particles accumulated in and on the filter.
Contrastingly, gross beta activity might rather underestimate the activity of most beta natural emitters such as 210Bi, 40K, 33P, or 35S. This is because beta electrons from a 90Sr-90Y
mix have higher energies (561.4 keV on average) compared to beta electrons coming from 210Bi, 40K, 33P, or 35S (317, 508.32, 76.4, and 48.79 keV on average, respectively). On the contrary, 32P emits beta electron with a mean energy of 695.5 keV and its activity could be
overestimated by the gross beta activity. However, this approach based on average beta electron energy cannot be used for making quantitative bias assessments since it does not take into account the geometry of the sample-detector ensemble and the shapes of energy spectra at low energy where most of yield differences are rooted.
192 193 194 195 196 197 198 199 200 201 202 203 204 205 206 207 208 209 210 211 212 213 214
2.4 Correction of 210Po build-up in the filter
Since 210Pb has a 22.2 years half-life, it can be considered as stable during the whole
sampling and analysis periods. This is not the case for 210Po due to its much shorter half-life
of only 138.4 days. Because the time lag between sampling and 210Po analysis (typically 50
70 days) is not negligible compared to Po half-life, and because of the presence of Pb and 210Bi in the filter, 210Po can be regenerated (or eventually decay in the case of initial
210Po/210Pb activity ratio greater than 1) in between the sampling time and the
measurement time . Thus, a correction has to be applied in order to infer the activity of the filter at a given initial time prior to 210Po measurement (either sampling time, 5-day or 50-
day analyses times). Since 210Po can be regenerated in the filter by the decay of his parent
210Bi, itself sustained by the decay of 210Pb, the correction depends on 210Pb, 210Bi and 210Po
initial activities. The correction formula is given in appendix A. If necessary, the unknown
210Bi activity can be neglected (see appendix A).
2.5 Volume normalisation.
Atmospheric activities are finally calculated from the activities measured on the aliquot (and subsequently corrected for 210Po build-up), dividing by the volume of filtered air and
the aliquot to filter surface ratio (this ratio is similar for all samples and is equal to 0.3). It is assumed that the analysed aliquot is representative of the whole filter.
210 210
2.6 Determination of Po/ Pb activity ratio from gross alpha activity time variation
210 210
Two different approaches can be used to determine the Po/ Pb activity ratio. The first method simply consists in dividing Po activity by Pb activity. It is independent from gross alpha/beta measurements but it implies a correction for 210Po (see section 2.4). Since
this correction relies on the value of 210Pb activity determined by gamma spectrometry with
215 216 217 218 219 220 221 222 223 224 225 226 227 228 229 230 231 232 233 234 235 236 237
high uncertainty owing to low counting statistics, the corrected 210Po activity value at
sampling time can be affected by important errors. An alternative method relies on the relative variation of gross alpha activity between 5-day and 50-day analyses and is based on the hypothesis that this variation is only related to 210Po variation inside the sample. This
assumption will be discussed later in the light of obtained results. The correction formula is detailed in Appendix B.
3. Results
All measured atmospheric activities are reported in table 1 and plotted in figure 2. The uncertainty is given at a significance level of 2 sigma (95%) and only includes the uncertainty of the radioactivity measurements. Uncertainties on air volume and aliquot to filter ratio are small compared to the uncertainty due to counting statistics and calibration, and are thus neglected. What is more, errors related to the filtered volume or the aliquot to whole filter ratio do not propagate an error on activity ratios.
3.1 Gross alpha/beta and 210Pb activity levels
Gross alpha activity at 5 days was found at a level of 0.016 ± 0.008 mBq/m3 (mean and standard deviation), and gross beta activity at 5 days was found at a level of 0.4 ± 0.2 mBq/m3 (mean and standard deviation). These levels are consistent with the values usually reported in the RNM. 210Pb activity was found at a level of 0.3 ± 0.2 mBq/m3, which is in
good agreement with monthly averages previously recorded at sites located nearby our sampling site by Bourcier et al. (2011), i.e., from 0.33 ± 0.10 mBq/m3 to 1.13 ± 0.34 mBq/m3 at the Opme station (5.7 km SSW from our sampling site), and from 0.34 ± 0.04 mBq/m3 to 1.35 ± 0.14 mBq/m3 at the Puy-de-Dôme observatory.
238 239 240 241 242 243 244 245 246 247 248 249 250 251 252 253 254 255 256 257 258 259 260 261
3.2 Gross beta activity versus 210Pb activity at 5 and 50 days and the excess of gross beta
activity
Figure 3 displays 5-day beta activities as a function of 210Pb activities. A marked
correlation between these two activities is found (R2=0.98), but 210Pb activity is significantly lower than beta activity (P = 1.27 x 210Pb + 0.05 mBq/m3, best fit). At 50 days, a marked correlation between gross beta and Pb activities is also found (P = 1.44 x Pb - 0.02 mBq/m3, R2 = 0.97). These excellent correlations at 5 and 50 days mean that 210Bi coming from 210Pb decay is the main source of long-lived beta radioactivity of atmospheric aerosols
(i.e., still present in the filter 5 days after sampling), in good agreement with previous studies
(e.g., Mattsson et al., 1996). However, obtained linear coefficients are significantly higher
than 1 meaning that gross beta activity is in excess compared to 210Pb activity. As stated previously, gross beta activity might underestimate 210Bi activity and therefore this excess cannot be due to a calibration bias (if such a bias exists). At 5 days, 210Bi activity could be higher than Pb activity but this possibility can likely be discarded since Bi/ Pb activity ratio is generally < 1 in tropospheric air with a typical value of 0.5 (Poet et al., 1972). Moreover, at 50 days, when Pb and Bi are in radioactive equilibrium, the clear discrepancy observed between gross beta and 210Pb activities proves that long-lived
radionuclides different from 210Pb contribute to gross beta activity. Assuming that calibration biases can be neglected, it is thus possible to calculate the amount of beta radioactivity coming from those other sources. We find that the mean excess beta activity compared to 210Pb-210Bi equilibrium activity is 0.1 mBq/m3 (with a standard deviation of ± 0.1 mBq/m3).
Could such an excess be explained by the presence of other beta emitters like K, P, P, or 35S ? 40K activity was not detected by gamma spectrometry for any sample in this study and detection thresholds were typically higher than 0.1 mBq/m3 (1.4 ± 0.7 mBq/m3, mean and
262 263 264 265 266 267 268 269 270 271 272 273 274 275 276 277 278 279 280 281 282 283 284 285
standard déviation of détection thresholds). However, 40K activity levels measured at the nearby Opme station (5.7 km SSW from our sampling site) (OPERA-AIR network) in the period March 2017-June 2018 are significantly lower than 0.1 mBq/m3 with an average value of 6.2 ± 3.2 pBq/m3 (Olivier Masson, unpublished data). Even if some episodic events with high 40K atmospheric activities (Hernandez et al., 2005) cannot be ruled out, these low-level measurements suggest that 40K cannot be the main beta emitter contributing to the
observed excess. 32P, 33P, and 35S are pure beta emitters and therefore they cannot be measured by gamma spectrometry. However, the order of magnitude of airborne activity levels reported in the literature for 32P, 33P and 35S (Lal and Suess, 1968; Lujanien et al., 1997) is about 0.1 mBq/m3. When summed up, the activities of cosmogenic radionuclides might exceed the observed excess of beta activity (~0.1 mBq/m3). Nevertheless, the beta detection yield of 33P and 35S with a gross alpha/beta counting device might be very small due the low energy of electrons emitted by these nuclides (see section 2.3) and therefore only a minor part of their activity is accounted for in the measured gross beta activity. Thus, we suggest that the observed beta excess is compatible with a contribution of cosmogenic
radionuclides.
3.3 Inferences on the gross beta activity excess from comparison between 5 and 50 days
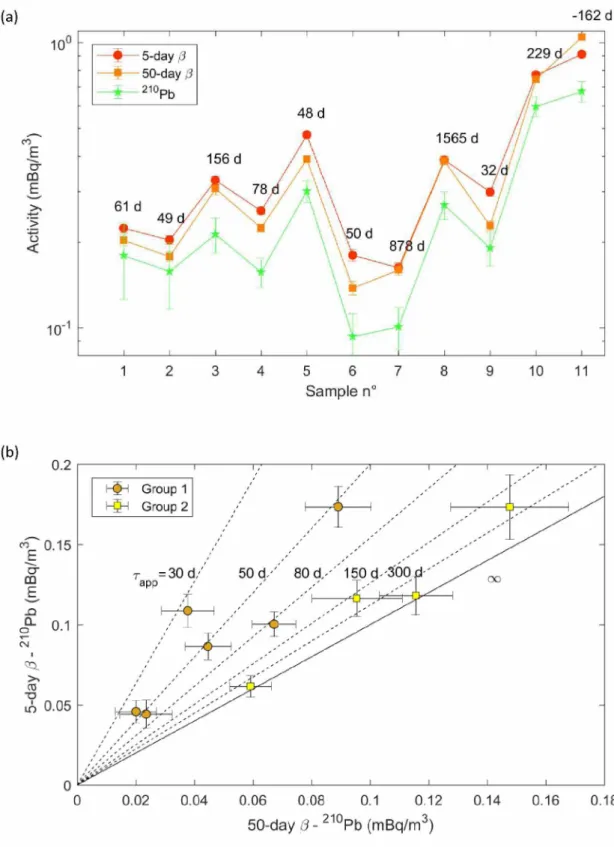
Figure 4a represents gross beta activity at 5 and 50 days, as well as 210Pb activity, for each of the 2017 samples. It can be observed that gross beta activity at 5 days is
systematically higher than or similar to gross beta activity at 50 days. This observation is a further argument in favour of the contribution of cosmogenic radionuclides to the gross beta activity. Indeed, all the above-cited radionuclides have half-lives of a few tens of days: 14.3 days (32P), 25.4 days (33P) and 87.3 days (35S). Therefore, their activity in the filter
286 287 288 289 290 291 292 293 294 295 296 297 298 299 300 301 302 303 304 305 306 32 33 35
In order to check whether the decrease of P, P and S is compatible with the observed decrease of gross beta activity, it is possible to calculate the apparent half-life of the gross beta activity excess (relative to 210Pb) using the following equation:
—Afin 2 ^app inP 50 210 Pb P5 — 210Pb (eq. 1)
where Af corresponds to the interval between 5-day and 50-day analyses and P and 210Pb correspond to gross beta activity and Pb activity, respectively. This calculation is
illustrated on figure 4b. Values of Tapp calculated for the ten samples acquired in 2017 range from 30 to 1500 days with a median value of 80 days and mean value of 271 days (one sample with lower gross beta activity at 5 days as compared to 50 days was excluded). Half of the computed values are higher than the expected half-lives. However, Tapp must be considered as a maximum estimate of the beta excess half-life since the increase in 210Bi activity between 5 and 50 days could partially counter-balance the activity decrease of short- lived cosmogenic radionuclides. Indeed, Bi activity is generally lower than Pb in the troposphere (see above), therefore the activity of 210Bi in the filter gradually increases until radioactive equilibrium is reached with 210Pb after about one month.
Actually, two groups of samples can tentatively be separated: a six-sample group with a low apparent half-life (from 30 to 80 days, mean 50 days) associated to a significant gross beta activity decrease and a four-sample group with a high apparent half-life (from 160 to 1560 days, mean 680 days) corresponding with a barely significant decrease or lack of significant decrease. The first group might be composed of samples with higher P- P- S/ Pb activity
210 210 210
307 308 309 310 311 312 313 314 315 316 317 318 319 320 321 322 323 324 325 326 327 328 329 32 33 35 210
Alternatively, the second group 2 can be composed of samples with lower P- P- S/ Pb
210 210 210
activity ratios and/or lower Bi/ Pb initial activity ratio (higher Bi build-up).
3.4 Gross alpha activity versus 210Po activity at 50 days
Figure 5 compares 50-day gross alpha activity and Po activity. Reported polonium activities are corrected for the build-up taking place between the gross alpha/beta counting at 50 days and 210Po measurement 10 to 20 days after (see methods for more details). Uncertainties are calculated by quadratic propagation of 210Po measurement uncertainty and 210Pb activity uncertainty (used for the correction, see appendix A). An excellent linear correlation between the two activities is found (R2= 0.99) and gross alpha activity at 50 days is lower than 210Po activity (best fit: a = 0.83 x 210Po mBq/m3, mean ratio of 0.72). Linear correlation between the two activities strongly suggests that 210Po is the main source of
alpha activity at 50 days. This is in agreement with previously reported activity levels of only 0.5-1 pBq/m3 for long-lived alpha emitters in the atmosphere (238U, 230Th, 226Ra, 232Th, 228Ra, 228Th) ("Sources and effects of ionizing radiation", UNSCEAR 2008 Report, 2010 and
references therein). The fact that alpha gross alpha activity is smaller than 210Po activity can
be explained by the measurement process and alpha particles self-absorption in the filter (see discussion).
3.5 Gross alpha activity at 5 days versus build-up corrected 210Po activity
Figure 6a represents gross alpha activity measured at 5 days as a function of build-up corrected 5-day 210Po activity (see methods). In marked contrast with the situation at 50 days, gross alpha and 210Po activities are poorly correlated (R2 = 0.77 for 2017 samples and R2 = 0.78 for 2018 samples), even though positive correlation trends are still observed.
330 331 332 333 334 335 336 337 338 339 340 341 342 343 344 345 346 347 348 349 350 351 352
Interestingly, even if corrélation coefficients are similarly low for 2017 and 2018, the 2018 samples group (characterized by a shorter time lag before 210Po measurement) present a
mean alpha/210Po ratio closer to the mean ratio found for 50-day activities (5-day ratios of
0.66 for 2018 samples and 0.4 for 2017 samples, to be compared to the 50-day ratio of 0.72). Moreover, the uncertainty on build-up corrected 210Po activity is much higher for the 2017
sample group than for the 2018 sample group (see figure 6a). Since the 5-day alpha/210Po
ratio has no obvious reason to change between 2017 and 2018 and since 210Po is the
outstanding contributor of long-lived alpha radioactivity (see figure 1), these observations suggest that the correction applied to 210Po activity in order to recalculate its value backward
in time introduces an important dispersion and bias in the corrected values, especially when the correction lag is long (2017 sample group). Therefore, obtained 210Po corrected activities
cannot be trusted as representative of 210Po atmospheric level for 2017 samples.
Contrastingly, the good agreement between 5-day alpha/210Po ratio of 2018 samples and the
50-day ratio suggests that corrected 210Po activities are not significantly biased.
210 210
3.6 Atmospheric Po/ Pb activity ratio inferred from gross alpha activity variation (2017 samples)
Due to large uncertainty propagation on corrected Po activity using the Pb- based approach (see section 3.5), we attempted to determine Po/ Pb activity ratio using the gross alpha activity variation method described in section 2.6. Resultsare presented in figure 7. This method relies on the assumption that the relative increase of gross alpha activity between 5 and 50 days is equal to the relative increase of 210Po activity in the filter.
Conclusions drawn from section 3.4 confirm that long-lived alpha-emitting radionuclides found in the atmosphere (U, Th and Ra isotopes) are not active enough to invalid this
353 354 355 356 357 358 359 360 361 362 363 364 365 366 367 368 369 370 371 372 373 374 375
assumption (see also figure 1). Another source of uncertainty behind this method is the lack of constraints on Bi/ Pb activity ratio in the filter. In order to evaluate the effect the unknown 210Bi/210Pb activity ratio on this method, 210Po/210Pb activity ratio is calculated for
three different values of this parameter in equation B.4 (appendix B), i.e. 0, 0.5 and 1.
It is clear on figure 7 that the value of 210Bi/210Pb initial activity ratio has an effect on the value of 210Po/210Pb activity ratio obtained from gross alpha activity variation (the higher the assumed 210Bi/210Pb ratio, the lowerthe obtained initial 210Po/210Pb ratio). However, taking
into account uncertainties of gross alpha activity measurements, the results obtained with different values of the 210Bi/210Pb ratio are not significantly different. Therefore, the effect of 210Bi can be neglected and we will consider afterward a mean value of 0.5 for 210Bi/210Pb
ratio (Poet et al., 1972).
First, the obtained Po/ Pb ratio (0.07 ± 0.01, mean and standard deviation) is very close to the 5-day gross alpha/210Pb activity ratio (0.06 ± 0.02). In comparison, the 210Po/210Pb mean ratio obtained from build-up corrected 210Po activity is 0.18 ± 0.07. This shows that the gross alpha activity variation method causes lower biases as compared to the 210Po build-up correction. Moreover, 210Po/210Pb activity ratios obtained with this method are in good
agreement with the mean atmospheric value of 0.06 previously reported by Daish et al. (2005).
Using the same method, we computed the 5-day Po/ Pb ratio for each sample (taking into account the exact time lag between sampling and 5-days analysis) and derived the 5-day
Po activity (multiplying by Pb activity) that we compared to 5-day gross alpha activity (figure 6b). A much better correlation is found as compared to that of the other method (R2= 0.95 versus 0.77). Moreover, the 5-day alpha/210Po ratio obtained with the gross alpha
376 377 378 379 380 381 382 383 384 385 386 387 388 389 390 391 392 393 394 395 396 397 398
activity variation method is in good agreement with the alpha/210Po ratio found at 50 days. These results confirm that the alpha/210Po ratio might not significantly change between 5 days and 50 days, and demonstrates that 210Po is the dominant long-lived alpha emitter of
atmospheric aerosols.
210 210
3.7 Atmospheric Po/ Pb activity ratio versus gross alpha/beta activity ratio
Figure 8 represents gross alpha/beta activity ratio measured at 5 days as a function of atmospheric Po/ Pb activity ratio inferred from gross alpha activity variation (2017 samples) and from corrected 210Po activity (2018 samples). The two activity ratios are not
well correlated (R2 = 0.12 and 0.46 for 2017 and 2018 respectively). Gross alpha/beta activity
ratio is lower than 210Po/210Pb activity ratio by a mean factor of 0.9 (2017) or 0.6 (2018).
Lower alpha/beta activity ratio as compared to Po/ Pb activity ratio is logical since 5-day gross beta activity overestimates 210Pb activity (see section 3.2) and since alpha activity
underestimate 210Po activity (see section 3.4). Thus, both differences tend to an
underestimation of Po/ Pb activity ratio by the alpha/beta activity ratio. However, it should be pointed out that both ratios are almost always compatible considering the large error bars, especially for the Po/ Pb activity ratio. Actually, gross alpha/beta activity ratio has a typical relative uncertainty of 22% ± 14% (k=2) while 210Po/210Pb ratios present
larger relative uncertainties (36% ± 2% in 2018 and 50% ± 20% in 2017). For both kinds of ratio, the relative variability of the sample set (2o standard déviation divided by mean) is not considerably higher than measurement uncertainties (48% for alpha/beta ratio and 70% for
210Po/210Pb ratio).
399 400 401 402 403 404 405 406 407 408 409 410 411 412 413 414 415 416 417 418 419 420 210 210 210
Based on the estimate of atmospheric Po/ Pb activity ratio and on measured Pb activities, it is possible to determine the airborne 210Po activity level at the study site. We
find a level of 210Po of 13 ± 6 pBq/m3 (mean and standard deviation on all samples). This
level is in very good agreement with levels reported in England by Daish et al., 2005 (12,3 ± 0,4 pBq/m3) and constitutes the first chronicle of 210Po activity in France.
4. Discussion
4.1 Origin and consequences of the gross beta activity excess compared to 210Pb
Gross beta activity is found in marked excess as compared to 210Pb activity by a typical
factor of ~1.3 (see section 3.2). This excess is higher at 5 days than at 50 days after sampling and can be attributed to the presence of short-lived cosmogenic radionuclides (see sections 3.2 and 3.3). This factor can serve as a correction factor to retrieve 210Pb activity from 5-day
gross beta activity. However, it is interesting to point out that a previous comparison study (based on a larger set of samples) did not identify this phenomenon (Mattsson et al., 1996). The authors found a regression equation equivalent to P = 1.03 x 210Pb + 0.02 mBq/m3 (see
figure 9 in Mattsson et al., 1996) even if some samples could present a beta excess factor as large as 1.3. Even if a calibration bias cannot be ruled out, we suggest that the typical beta activity excess compared to 210Pb (and the correction factor to apply) may depend on the
location and on the potential presence of local sources of other beta emitters. As a consequence, the use of gross beta activity to infer 210Pb activity might be cautious and requires a calibration of gross beta activity vs 210Pb to be made on site, for instance using the protocol presented in this study. If such a calibration of gross beta activity vs 210Pb activity
421 422 423 424 425 426 427 428 429 430 431 432 433 434 435 436 437 438 439 440 441 442 443
was performed on a large number of sampling stations, it would be possible to understand how the excess of gross beta activity relates to environmental conditions.
In this study, the two gross beta activity has been measured only two times for each sample (at 5 and 50 days). Yet, we have shown that gross beta activity likely reflects the presence of several short-lived radionuclides including 210Pb-210Bi, 32P, 33P and 35S. Thus, we suggest that
precise constraints on the nature of the beta excess could be obtained with at least 5 gross beta activity measurements over a period of 50 days.
4.2 Alpha particles self-absorption in filters
The gross alpha activity has been found to slightly underestimate 210Po activity when
both activities are compared at 50 days. The cause of this difference likely lies in the measurement process itself. Actually, measurement of alpha emitters in air filters is known to be strongly biased by alpha particles attenuation inside aerosol particles and filter media (Geryes et al., 2009 and references therein). Alpha particles interact efficiently with aerosol particles and filter fibers and can possibly be stopped before reaching the detector which causes a decrease in the gross detection efficiency. The correction of the alpha attenuation in air filter consists in calibrating the alpha/beta counting apparatus with a filter
impregnated with a known amount of alpha radioactivity (see section 2.3). However, the attenuation endured by alpha particles in the calibration filter can be slightly different from the attenuation occurring in real atmospheric air filters. This could be explained, for
instance, because of different mechanisms of fixation (water droplets percolation versus aerosols fixation) or because of attenuation caused by aerosol particles themselves. This difference could result in a biased calibration coefficient. In the present case, we suggest that alpha attenuation is slightly underestimated resulting in an underestimate of the gross
444 445 446 447 448 449 450 451 452 453 454 455 456 457 458 459 460 461 462 463 464 465
alpha activities by approximately 10% (see section 3.4). Therefore, in the context of atmospheric radioactivity monitoring we recommend to calibrate alpha counting devices using real aerosol filters in order to avoid potential matrix biases. The reference value of alpha activity for calibration filters can be obtained via radiochemistry, as presented in this study.
4.3 Advantages and disadvantages of 210Po measurement strategies in atmospheric
samples
Since Po is regenerated in the samples by Pb and Bi decays, precise measurement of this radionuclide in the atmosphere is challenging. If 210Po is not measured within a few
days at most after sampling, its activity significantly increases in the sample which implies to make a correction to retrieve the original 210Po content. Yet, this correction depends on
210Pb which is difficult to estimate directly with high precision (since it requires long counting
times). Therefore, important errors can be made on the initial 210Po activity due to error
propagation and amplification from Pb measurement. Moreover, Bi activity is also
210 210
needed in the correction process, as variable Bi/ Pb initial activity ratios will affect the build-up of Po by Pb decay. This problem has also been investigated by Lozano et al. (2011). Yet, precise measurement of 210Bi is also challenging since it is a pure beta emitter
mixed with other beta emitters in the filter. Its quantification would require either a
chemical separation or a continuous measurement of beta activity over a few weeks in order to perform the proper deconvolution of the half-lives of the different beta emitters present in the filter (33P, 32P, 35S, 40K, 210Bi).
466 467 468 469 470 471 472 473 474 475 476 477 478 479 480 481 482 483 484 485 486 487 488 489 210 210 210
It has been shown that Po activity values corrected for build-up by Bi- Pb decay in the filter in between 5 and 50 days are largely biased due to error propagation (see 3.5). This is not surprising since this correction relies on 210Pb activity measured by gamma spectrometry
with high uncertainty (typical relative uncertainty of 30% in our study) and since any error on Pb activity propagates to Po activity. Contrastingly, the same correction formula was used for recalculating 210Po activity at 50 days (typical correction of 10-20 days, see table 1)
and did not introduce any notable dispersion (see section 3.4). The same observation stands true for 2018 samples for which the time lag between 5-day alpha/beta counting and 210Po
measurement was 24 days at most. This suggests that the dispersion induced by the correction is amplified as 210Po activity is recalculated sooner backward in time. Therefore,
precise 210Po specific activity determination implies a short time lag between sampling and
analysis (typically 10-20 days). If this condition is met, this technique has the major advantage of being direct.
Another Po measurement strategy is based on Po/ Pb ratio determination using gross alpha activity variation with time. Compared to direct determination of 210Po, this method
has the main advantage to be simpler (no radiochemistry is needed). It is also worth to point out that this method is not affected by alpha particle attenuation bias since it is based on the relative increase of gross alpha activity. However, the waiting period to obtain the result is longer since two gross alpha activity measurements are required, at 5 and 50 days, in order to determine the initial Po/ Pb ratio. What is more, this method is based on the
assumption that the relative increase of gross alpha activity is equal to the 210Po true relative
increase in the filter. Potential reasons for rejecting this assumption would be the presence of other alpha emitters in the filter. Regarding long-lived radionuclides, the comparison at 50 days between gross alpha activity and 210Po activity demonstrates that no contribution can
490 491 492 493 494 495 496 497 498 499 500 501 502 503 504 505 506 507 508 509 510 511 512 513
be detected since an excellent corrélation is found between the two activities. However, short-lived radionuclides with significant initial activity compared to 210Po could have
completely decayed and could be missed at 50 days. Such radionuclides would likely have a half-life shorter than ~10 days. Conversely, they must have a half-life > ~1 day to be still active in the sample at 5 days (this is not the case for all radon and thoron daughters). A search in a radionuclide database indicates that potential candidates for naturally occurring alpha-emitters with a half-life between 1 and 10 days are Ra and Ra. For both nuclides, we found no atmospheric activity reported in the literature. However, airborne Th ( Ra father in the 232Th decay chain) activity has occasionally been reported to be about 1 pBq/m3 (Kolb, 1989). Therefore we suggest that 224Ra activity level is in the same order of magnitude
due its short half-life (3.6 days). Such level is very low compared to the amplitude of gross alpha activity variation (tens of pBq/m3) and would not affect the final result. Because 223Ra
originates from the U decay chain, which is much less abundant than Th and U in nature (0.7% of uranium and Th/U = 4.2), we suggest that 223Ra levels in the atmosphere are likely to be even lower than 224Ra levels. Therefore, it appears that the initial assumption
lying behind the method is robust.
When compared in term of final result uncertainty, the gross alpha activity variation method is more reliable than direct Po determination if the time lag between sampling and Po determination is long (typically 50-70 days). Conversely, if the time lag is short (10-20 days) the two methods give similar results, even if the typical relative uncertainty is higher for the gross alpha activity variation method as compared to direct 210Po determination (50% compared to 35%). Since both methods are based on measured 210Pb activity, it should finally be noted that the uncertainty of both methods would decrease if a more precise 210Pb
514 515 516 517 518 519 520 521 522 523 524 525 526 527 528 529 530 531 532 533 534 535 536 210 210
4.4 Alpha/beta activity ratio versus Po/ Pb activity ratio and the détection of extreme natural events
5-day alpha and beta activities are routinely measured in many locations for
monitoring reasons. Thus, large databases of alpha/beta activity ratio are available and could be used to study Po and Pb in the atmosphere. When comparing this ratio with our estimates of 210Po/210Pb activity ratio, we found that both ratios match each other due to
large uncertainties. Due to the rather low number of samples (16) and to the fact that
210Po/210Pb and gross alpha/beta ratio variability did not significantly exceed the
measurement uncertainty, it is not possible to conclude about the correlation between the two ratios. However, when looking at mean ratios, our data suggest that alpha/beta activity ratio is smaller than Po/ Pb activity ratio. This underestimation is potentially due to two phenomena: (i) presence of other beta emitters leading to an overestimation of 210Pb by
gross beta activity and (ii) calibration error on alpha measurement due to an inappropriate treatment of alpha self-absorption in the filter, leading to underestimation of 210Po by gross
alpha activity.
The amplitude of these two biases has been determined in sections 3.2, 3.4, 3.5 and 3.6. Considering the mean and standard deviation of alpha/210Po ratios (see figures 5 and 6a, b)
determined at 5 and 50 days with different methods, it is possible to infer a typical
alpha/ Po ratio of 0.7 with a sample-to-sample variability of 15%. At 5 days, the beta/ Pb ratio has a mean value of 1.5 with a variability of 15%. Thus, it is possible to infer a typical factor of 0.5 between gross alpha/beta and Po/ Pb activity ratios with a 1a variability of 20%. Consequently, the gross alpha/beta activity ratio appears to be suitable for tracking relative 210Po/210Pb ratio variations much largerthan 20% (i.e. at least 100%). Yet, relative
537 538 539 540 541 542 543 544 545 546 547 548 549 550 551 552 553 554 555 556 557 558 559
variations of 210Po activity associated with savanna fire plumes or volcanic plumes often
exceed this threshold as reported by several authors (e.g., Le Cloarec et al., 1995; Nho et al., 1996,1997). Therefore, the gross alpha/beta ratio might be able to record such variations. Finally it is possible to imagine a protocol dedicated to the monitoring of these extreme natural events:
- The protocol is triggered on when 5-day alpha/beta ratio is 100% larger than the reference value.
- A gamma spectrometry is performed as long as possible to obtain Pb activity in the sample.
- If possible, an aliquot is analysed as soon as possible for 210Po determination.
- In any case, several gross alpha/beta countings are performed during 50 days to better constrain the initial 210Bi/210Pb and 210Po/210Pb ratios and the cosmogenic
radionuclides.
5. Conclusion
210 210
Gross alpha/beta activity and specific Po and Pb activity measurements have been performed on a set of atmospheric aerosols samples in order to investigate co-variations of these different activities. Several main conclusions can be drawn:
- Beta activity was found to systematically overestimate 210Pb activity by ~30%.
Using 5 and 50-day gross beta activity measurements, it is possible to constrain the nature of this beta activity excess. We show that it is mostly due to short-
560 561 562 563 564 565 566 567 568 569 570 571 572 573 574 575 576 577 578 579 580 581 582 583
- 50-day gross alpha activity is mainly due to 210Po. However, alpha activity is found
to underestimate 210Po activity. This is likely due to the alpha energy attenuation
in the filter that is difficult to properly take into account in the calibration
process.
- Determination of Po activity in the atmosphere from delayed Po measurement (from 15 to 90 days after sampling in this study) is very challenging due to the effect of 210Po build-up from 210Pb and 210Bi decay. We show that the
uncertainty increases as the timespan of correction increases and that the
corrected value can be significantly biased.
- However, indirect estimation of Po/ Pb activity ratio can be obtained from gross alpha activity variation between 5 and 50 days. Mean Po/ Pb activity ratio obtained using this method is in very good agreement with alpha/210Pb
activity ratio, meaning that the method is not strongly biased although it is indirect.
210 210
- alpha/beta activity ratio tend to underestimate Po/ Pb activity ratios due to discrepancies between gross beta and 210Pb activities (presence of other beta
emitters), on one hand, and between gross alpha and 210Po activities on the other
hand (alpha particle attenuation). However, large-scale Po/ Pb ratio variations typical of extreme natural events could still be monitored through gross alpha/beta measurements.
584 A first estimation of atmospheric 210Po activity level in France is 13 ± 6 pBq/m3.
585
587 588 589 590 591 592 593 594 595 596 597 598 599 600 601 602 603
APPENDIX A: correction of 210Po build-up in the filter.
210Po activity measured at a given time t must be corrected to take into account the build-up of this radionuclide by 210Bi decay in the sample. The formula of this correction can
be obtained by solving the decay équations for a three-member chain (1^2^3, or
210Pb^210Bi^210Po). To do so we use the formalism of Bateman given by Pressyanov (2002)
where radionuclide initial numbers are factorized and we transform it to express the solution with activities instead of numbers:
Ai(t) = Ai,oe Xit +lim1iAm,o n -m+1
n—Ak t
nJ=m(J*k)(^J ^k)
(eq. A.1)
were At(t) stands for the activity of the i-th nuclide in the decay chain, Ai 0(t) for the initial activity of t (at t = 0), Xi for the decay constant of i and t for the time. In the case of 210Pb -> 210Bi -> 210Po (1->2->3) decay chain, the equation A.1 translates to:
(Po)t = (Po)0Cpo + (Bi)oC^i + (Pb)0Cpb
(eq. A.2)
where (X)0 is the activity of the aliquot at a given initial time and (X)t is the activity of the same aliquot after a time t (X corresponding either with 210Pb, 210Bi or 210Po, the 210
exponent is not reproduced in the equation for simplicity). C£ is a numerical coefficient that
is a function of time t and of radioactive decay constants of Pb, Bi and Po:
Ct = e~ÀPot
CPo — e
C|| =T-^Ve-*E|t + , Ap° e~Ap°t Ipo — ^Bi ^Bi — ^Po
604 605 606 607 608 609 610 611 612 613 614 615 616 617 rt — CPb — APoAPo^Bi
(APo — ApbX^Bi — APb)
g ^-Pbt + APoAPo Bi
(APo — ABi)(APb — Ab0
+
APoABi
(ABi — APo)(APb — APo)
-Ap0t
(eqs. A.3, A.4 & A.5)
Using this formalism it is possible to infer initial polonium content of the sample using the following equation:
^ ^ (Po)t - (Bi)oC^i - (Pb)oC^b
(Po)o — --- r---rPo
(eq. A.6)
In the right member of equation A.6, (Po)t is measured, (Pb)o is constant through short times and is determined by gamma spectrometry and CBji, CPb and CPo are directly calculated from t. Only (Bi)o is not directly measured. When 210Po activity is to be
recalculated at 50-day analysis time, (Bi)o is equal to (Pb)o because of radioactive
equilibrium and equation A.6 simplifies. When 210Po activity is to be recalculated at sampling
time, or at 5 days, it is not possible to assume radioactive equilibrium. However, it is possible to show that the initial 210Bi activity can be neglected. Let us rewrite equation A.6:
(Po) o — (Po)t (Pb)oCPb rt CPo CPort / + (Bi)o CBA V (Pb)o C^b/ (eq. A.7) 210 210
We can neglect the contribution of Bi initial activity if it is smaller than the Pb term contribution, in other words if:
(Bi)o CBi (Pb)oCPb
618 619 620 621 622 623 624 625 626 627 628 629 630 631 632 633 634 (eq. A.8)
First, CBi/Cpb is about 10% for t =50 days. Second, 210Bi/210Pb activity ratio of atmospheric
aérosols is generally reported lower than 1 with a mean value of 0.5 (e.g. Poet et al., 1972). Therefore, it is likely that the contribution of the 210Bi term in equation 4 is no more than 10 % of the contribution of 210Pb, and likely around 5 %. Because the typical uncertainty on
210Pb values measured by gamma spectrometry is larger than 10 % (see table 1), it is
legitimate to neglect 210Bi initial activity in the correction formula. Equation A.7 can thus be
simplified as: , (Po)t - (Pb)oCpb (Po)o = --- ---üPo (eq. A.9) 210
Finally, the uncertainty of corrected Po activity is obtained by convolution of the
210 210
uncertainties of Po and Pb measurements:
u((Po)o)
J
u2((Po )t) + u2((Pb)o)Cpb2
where u(v) stands for the uncertainty on the measured quantity v.
635 636 637 638 639 640 641 642 643 644 645 646 647 648 01 O 01 O
Appendix B: détermination of Po/ Pb activity ratio from gross alpha activity increase between 5 and 50 days.
Supposing that gross alpha activity relative variation between 5 and 50 days is only due to 210Po, we can write:
^50 - (Po)5o - (Po)s
«5 (Po)5
(eq. B.1)
where a and (Po)t correspond to gross alpha activity and 210Po activity respectively (either
at 5 or 50 days). Replacing right terms of equation B.1 by their expression given by equation A.2, the relative variation of gross alpha activity becomes:
aso - as _ (CpQ - Cpb)(Pb)o + (cB,0 - i)(Bi)0 + (CP50° - CP50)(Po)o
a 5 cPb(Pb)0 + C’Bi(Bi)° + Cpo(Po)°
_ ACPb(Pb)0 + ACBi(Bi)0 + ACPo(Po)0
_ CP5b(Pb)0 + CBj(Bi)0 + CP5o(Po)0
(eq. B.2)
where ACx _ 0 - . Dividing by (Po)0 and using the notation Æ0 for 210Po/210Pb initial
activity ratio, equation B.2 becomes:
a s 0 - a s _ A^Pb^Q-1 + ACBi(Bi/Pb)0fi0'1 + ACPo
as _ Cp^ô1 + CB5i(Bi/Pb)0«0-1 + Cp5o
(eq. B.3)
Noting S _ «5o «5 the relative variation of gross alpha activity, we can finally obtain an «5
R0 =
CnS âCPb + (re)0 (Càs - âC=û
âCPo - CpoS
649 (eq. B.4).
210 210 210 210
650 Of course, this expression of Po/ Pb activity ratio dépends also on the Bi/ Pb activity
210 210
651 ratio and can be simplified if an assumption on the Bi/ Po initial activity ratio is made.
652
654 655 656 657 658 659 660 661 662 663 664 665 666 667 668 669 670 671 672 673 674 675 676 677 678 679 680 681 682 683 684 685 686 687 688 689 690 691 692 693 694 695 696 697 698 699 References
Allard, P., Aiuppa, A., Bani, P., Métrich, N., Bertagnini, A., Gauthier, P.-J., Shinohara, H., Sawyer, G., Parello, F., Bagnato, E., Pelletier, B., Garaebiti, E., 2016. Prodigious emission rates and magma degassing budget of major, trace and radioactive volatile species from Ambrym basaltic volcano, Vanuatu island Arc. Journal of Volcanology and Geothermal Research, Understanding volcanoes in the Vanuatu arc 322, 119 143. https://doi.org/10.1016/jjvolgeores.2015.10.004
Baskaran, M., 2016. Applications of Radon Progeny in Atmospheric Studies, in: Baskaran, M. (Ed.), Radon: A Tracer for Geological, Geophysical and Geochemical Studies, Springer Geochemistry. Springer International Publishing, Cham, pp. 85-117.
https://doi.org/10.1007/978-3-319-21329-3_5
Baskaran, M., 2011. Po-210 and Pb-210 as atmospheric tracers and global atmospheric Pb- 210 fallout: a Review. Journal of Environmental Radioactivity, International Topical Meeting on Polonium and Radioactive Lead Isotopes 102, 500-513.
https://doi.org/10.1016/jjenvrad.2010.10.007
Bourcier, L., Masson, O., Laj, P., Pichon, J.M., Paulat, P., Freney, E., Sellegri, K., 2011.
Comparative trends and seasonal variation of 7Be, 210Pb and 137Cs at two altitude sites in the central part of France. Journal of Environmental Radioactivity 102, 294 301. https://doi.org/10.1016/j.jenvrad.2010.12.005
Daish, S.R., Dale, A.A., Dale, C.J., May, R., Rowe, J.E., 2005. The temporal variations of 7Be, 210Pb and 210Po in air in England. Journal of Environmental Radioactivity 84, 457 467. https://doi.org/10.1016/jjenvrad.2005.05.003
Garland, J.A., Wakeford, R., 2007. Atmospheric emissions from the Windscale accident of October 1957. Atmospheric Environment 41, 3904-3920.
https://doi.org/10.1016Zj.atmosenv.2006.12.049
Geryes, T., Monsanglant-Louvet, C., Gehin, E., 2009. Experimental and simulation methods to evaluate the alpha self-absorption factors for radioactive aerosol fiber filters. Radiation Measurements, Proceedings of the 24th International Conferenceon Nuclear Tracks in Solids44, 763-765. https://doi.org/10.1016/jTadmeas.2009.10.059
Hernandez, F., Hernandez-Armas, J., Catalan, A., Fernandez-Aldecoa, J.C., Karlsson, L., 2005. Gross alpha, gross beta activities and gamma emitting radionuclides composition of airborne particulate samples in an oceanic island. Atmospheric Environment 39, 4057-4066. https://doi.org/10.1016/j.atmosenv.2005.03.035
Kolb, W., 1989. Seasonal fluctutions of the uranium and thorium contents of aerosols in ground-level air. Journal of Environmental Radioactivity 9, 61-75.
https://doi.org/10.1016/0265-931X(89)90038-6
Lal, D., Suess, H.E., 1968. The Radioactivity of the Atmosphere and Hydrosphere. Annual Review of Nuclear Science 18, 407-434.
https://doi.org/10.1146/annurev.ns.18.120168.002203
Le Cloarec, M.F., Ardouin, B., Cachier, H., Liousse, C., Neveu, S., Nho, E.-Y., 1995. 210Po in savanna burning plumes. J Atmos Chem 22, 111-122.
https://doi.org/10.1007/BF00708184
Lozano, R.L., Miguel, E.G.S., Bolivar, J.P., 2011. Assessment of the influence of in situ 210Bi in the calculation of in situ 210Po in air aerosols: Implications on residence time
calculations using 210Po/210Pb activity ratios. Journal of Geophysical Research: Atmospheres 116. https://doi.org/10.1029/2010JD014915
700 701 702 703 704 705 706 707 708 709 710 711 712 713 714 715 716 717 718 719 720 721 722 723 724 725 726 727 728 729 730 731 732
Lujanien=, G., Ogorodnikov, B.I., Budyka, A.K., Skitovich, V.I., Lujanas, V., 1997. An
investigation of changes in radionuclide carrier properties. Journal of Environmental Radioactivity 35, 71-90. https://doi.org/10.1016/S0265-931X(96)00014-8
Mattsson, R., Paatero, J., Hatakka, J., 1996. Automatic Alpha/Beta Analyser for Air Filter Samples - Absolute Determination of Radon Progeny by Pseudo-Coincidence Techniques. Radiat Prot Dosimetry 63, 133-139.
https://doi.org/10.1093/oxfordjournals.rpd.a031520
Moore, M.E., McFarland, A.R., Rodgers, J.C., 1993. Factors That Affect Alpha Particle Detection in Continuous Air Monitor Applications. Health Physics 65, 69-81. Nho, E.-Y., Ardouin, B., Le Cloarec, M.F., Ramonet, M., 1996. Origins of 210Po in the
atmosphere at lamto, ivory coast: Biomass burning and saharan dusts. Atmospheric Environment 30, 3705-3714. https://doi.org/10.1016/1352-2310(96)00093-3
Nho, E.-Y., Cloarec, M.-F.L., Ardouin, B., Ramonet, M., 1997. 210Po, an atmospheric tracer of long-range transport of volcanic plumes. Tellus B: Chemical and Physical Meteorology 49, 429-438. https://doi.org/10.3402/tellusb.v49i4.15980
OPERA network [WWW Document], n.d. URL https://www.irsn.fr/en/research/scientific- tools/experimental-facilities-means/opera/Pages/Opera-network.aspx (accessed 6.17.20).
Paatero, J., Vesterbacka, K., Makkonen, U., Kyllonen, K., Hellen, H., Hatakka, J., Anttila, P., 2009. Resuspension of radionuclides into the atmosphere due to forest fires. Journal of Radioanalytical and Nuclear Chemistry 282, 473-476.
https://doi.org/10.1007/s10967-009-0254-9
Poet, S.E., Moore, H.E., Martell, E.A., 1972. Lead 210, bismuth 210, and polonium 210 in the atmosphere: Accurate ratio measurement and application to aerosol residence time determination. Journal of Geophysical Research (1896-1977) 77, 6515-6527.
https://doi.org/10.1029/JC077i033p06515
RNM [WWW Document], n.d. URL https://www.mesure-radioactivite.fr/en#/expert (accessed 6.17.20).
Schery, S.D., 2001. Understanding radioactive aerosols and their measurement. Springer Science & Business Media.
Sources and effects of ionizing radiation, UNSCEAR 2008 Report, 2010. . Volume I. Annex A. United Nations, New York.
Figures and tables
210 210
Table 1: Sampling details and analysis results. All uncertainties are given with a coverage factor k=2. Po activity is given at the time of Po déposition onto plates. All activities are expressed in mBq/m3 considering sampled volumes and a constant aliquot/filter surface ratio of 0.3.
210Po
1st gross 2nd gross meas.
Sampling Sampled alpha/beta Gross activity 5 days alpha/beta Gross activity 50 days 210Pb activity delay 210Po activity
Sampling start duration volume Dust load counting (mBq/m3) counting (mBq/m3) (mBq/m3) (d) (mBq/m3)
Sample (local time) (h) (m3) (pg/im1) delay (d) alpha beta delay (d) alpha beta
1 27/3/17 14:08 50,6 7582 3 7 0,011 ± 0,003 0,224 ± 0,009 63 0,038 ± 0,004 0,203 ± 0,009 0,18 ± 0,05 91 0,09 ± 0,01 2 4/4/17 11:33 73,8 11073 15 5 0,008 ± 0,002 0,203 ± 0,007 63 0,032 ± 0,003 0,178 ± 0,007 0,16 ± 0,04 82 0,055 ± 0,006 3 12/4/17 18:40 47,9 7181 15 11 0,017 ± 0,003 0,33 ± 0,01 56 0,055 ± 0,007 0,31 ± 0,02 0,21 ± 0,03 110 0,11 ± 0,01 4 14/4/17 18:35 87,0 13050 10 7 0,010 ± 0,002 0,257 ± 0,008 52 0,038 ± 0,003 0,224 ± 0,007 0,16 ± 0,02 71 0,067 ± 0,007 5 21/4/17 13:53 71,6 10742 10 10 0,020 ± 0,003 0,48 ± 0,01 56 0,069 ± 0,004 0,39 ± 0,01 0,30 ± 0,03 65 0,10 ± 0,01 6 2/5/17 12:54 45,9 6893 6 5 0,004 ± 0,003 0,180 ± 0,008 53 0,018 ± 0,003 0,138 ± 0,008 0,09 ± 0,02 82 0,045 ± 0,005 7 12/5/17 18:02 63,3 9485 5 4 0,007 ± 0,002 0,162 ± 0,007 56 0,025 ± 0,003 0,160 ± 0,007 0,10 ± 0,02 71 0,038 ± 0,005 8 23/5/17 13:45 51,9 7781 12 6 0,013 ± 0,003 0,39 ± 0,01 56 0,069 ± 0,005 0,39 ± 0,01 0,27 ± 0,03 69 0,10 ± 0,01 9 7/6/17 13:22 52,3 7843 12 7 0,008 ± 0,003 0,30± 0,01 56 0,035 ± 0,003 0,228 ± 0,009 0,19 ± 0,03 61 0,047 ± 0,005 10 13/6/17 11:49 52,3 7845 15 11 0,033 ± 0,003 0,77 ± 0,02 64 0,147 ± 0,007 0,75 ± 0,02 0,60 ± 0,05 69 0,19 ± 0,02 11 21/6/17 13:36 48,2 7228 23 6 0,035 ± 0,004 0,91 ± 0,02 112 0,30 ± 0,01 1,05 ± 0,03 0,68 ± 0,06 118 0,35 ± 0,04 12 26/2/18 15:45 49,1 7363 17 9 0,020 ± 0,003 0,47 ± 0,02 0,28 ± 0,08 15 0,034 ± 0,005 13 18/4/18 9:08 52,1 7825 23 7 0,020 ± 0,003 0,66 ± 0,02 0,45 ± 0,06 17 0,046 ± 0,007 14 20/6/18 9:05 49,9 7491 18 14 0,022 ± 0,004 0,45 ± 0,01 0,29 ± 0,03 20 0,036 ± 0,005 15 27/6/18 9:45 47,7 7138 17 17 0,020 ± 0,003 0,37 ± 0,01 0,22 ± 0,04 21 0,030 ± 0,003 16 21/9/18 16:14 64,3 9631 6 19 0,015 ± 0,002 0,248 ± 0,008 0,12 ± 0,03 24 0,021 ± 0,002
Natural radioactivity of atmosphenc aérosols 5 days 100000 10000 000 100 22,3 a 138,4 j
00 [10
0,01 0,001 0,0001Figure 1: Repartition of the natural radioactivity of atmospheric aérosols. The main radionuclides are sorted on the x axis from short-period to long-period. The main decay mode (alpha, beta or electronic capture) is also indicated. Data are taken from the 2008 UNSCEAR report (Sources and effects of ionizing radiation, UNSCEAR 2008 Report, 2008) and from Schery (2001). All short-lived 222Rn daughters have half-lives considerably smaller than
5 days. Contrastingly, most Rn daughters (from the Th chain) are part of the progeny of
212Pb which has a 10.64 hours half-life. Therefore, the long-lived radioactivity can only be
measured after 5 days when 212Pb has thoroughly decayed out (5 days corresponds with
eleven 212Pb periods and a 2000 fold reduction of the initial activity). This long-lived
radioactivity comes from three different types of radionuclides: long-lived 222Rn daughters
(210Pb, 210Bi, 210Po), radionuclides of cosmogenic origin (32P, 33P, 7Be, 35S, 22Na) and
40 238 232
"primordial" radionuclides ( K, U, Th) injected in the atmosphere upon soil erosion.
210 210
Long-lived alpha activity is largely dominated by Po. Pb is the most active long-lived beta emitter but other radionuclides are also significant (32P, 33P, 35S, 40K).
(a)
Figure 2: Activities recorded for all samples in 2017 (a) and 2018 (b), including 5 and 50-day gross alpha/beta activities, Pb activity measured by gamma spectrometry and Po activity measured by alpha spectrometry after chemical separation (activities reported on the graph are not corrected for 210Po ingrowth between sampling and measurement). Error
bars are not drawn to avoid visual overload but are provided in table 1.
A c ti v it y (mB q/m )
Figure 3: 5-day gross beta activity versus 210Pb activity of all samples (2017 and 2018 sample groups). The best linear fit (R2 = 0.98) and the y=x line (dash line) are also plotted.