HAL Id: hal-01524249
https://hal.archives-ouvertes.fr/hal-01524249
Submitted on 17 May 2017HAL is a multi-disciplinary open access archive for the deposit and dissemination of sci-entific research documents, whether they are pub-lished or not. The documents may come from teaching and research institutions in France or abroad, or from public or private research centers.
L’archive ouverte pluridisciplinaire HAL, est destinée au dépôt et à la diffusion de documents scientifiques de niveau recherche, publiés ou non, émanant des établissements d’enseignement et de recherche français ou étrangers, des laboratoires publics ou privés.
i-Motif Structures Capped by AT Hoogsteen Base Pairs
Miguel Garavís, Núria Escaja, Valérie Gabelica, Alfredo Villasante, Carlos
González
To cite this version:
Miguel Garavís, Núria Escaja, Valérie Gabelica, Alfredo Villasante, Carlos González. Cen-tromeric Alpha-Satellite DNA Adopts Dimeric i-Motif Structures Capped by AT Hoogsteen Base Pairs. Chemistry - A European Journal, Wiley-VCH Verlag, 2015, 21 (27), pp.9816-9824. �10.1002/chem.201500448�. �hal-01524249�
Chem. Eur. J. (2015) Jun 26;21(27):9816‐24. doi: 10.1002/chem.201500448.
Centromeric alpha-satellite DNA adopts dimeric i-motif
structures capped by AT Hoogsteen base pairs
Miguel Garavís[a],[b], Núria Escaja[c], Valérie Gabelica[d], Alfredo Villasante*[b] and Carlos
González*[a]
Dedicated to the memory of our dear colleague, and friend, Alfredo Villasante, who died during the revision of this manuscript.
[a] Instituto de Química Física Rocasolano, CSIC, Serrano 119, 28006 Madrid (Spain).
[b] Centro de Biología Molecular “Severo Ochoa” (CSIC-UAM), Universidad Autónoma de Madrid, Nicolás Cabrera 1, 28049 Madrid (Spain).
[c] Departament de Química Orgànica and IBUB, Universitat de Barcelona, Martí i Franquès 1-11, 08028 Barcelona (Spain).
[d] Univ. Bordeaux, ARNA Laboratory, IECB, 2 rue Robert Escarpit F-33600 Pessac, France, and Inserm, ARNA Laboratory, 146 Rue Leo Saignat, F-33000 Bordeaux, (France).
E-mail: cgonzalez@iqfr.csic.es
Abstract: Human centromeric alpha-satellite DNA is composed of tandem arrays of two types of 171 bp
monomers; type A and type B. The differences between these types are concentrated in a 17 bp region of the monomer called the A/B box. Here, we have determined the solution structure of the C-rich strand of the two main variants of the human alpha-satellite A box. We show that, under acidic conditions, the C-rich strands of two A boxes self-recognize and form a head-to-tail dimeric i-motif stabilized by four intercalated hemi-protonated C:C+ base pairs. Interestingly, the stack of C:C+ base pairs is capped by T:T and
Hoogsteen A:T base pairs. The two main variants of the A box adopt a similar three-dimensional structure, although the residues involved in the formation of the i-motif core are different in each case. Together with previous studies showing that the B box (known as the CENP-B box) also forms dimeric i-motif structures, our finding of this non-canonical structure in the A box shows that centromeric alpha satellites in all human chromosomes are able to form i-motifs, and consequently raises the possibility that these structures may play a role in the structural organization of the centromere.
Introduction
The centromere is the chromosomal region on which the kinetochore, a large multiprotein structure, forms and attaches to spindle microtubules and ensures proper chromosome segregation. It is now recognized that both genomic competency and epigenetic mechanisms act together to define the site of kinetochore assembly.[1] Nucleosomes containing the centromere-specific histone H3 variant CENP-A
provide the epigenetic mark to establish the centromere-specific chromatin structure.[2] In particular, the
characteristic DNA unwrapping at CENP-A nucleosomes may enable these centromeric particles to adopt the three-dimensional chromatin structure required for centromere function.[3]
The centromeres of eukaryotic chromosomes are a paradox in that their function is conserved but their tandemly repeated “satellite” DNA sequences evolve rapidly by inevitable recombination processes.
However, the rapid and adaptive evolution of CENP-As involves regions that are predicted to contact centromeric DNA,[4] and this provides compelling evidence that CENP-As evolve in concert with satellite
DNAs.[5]
Centromeric satellites may have evolved to stabilize centromeric nucleosomes against the pulling forces they undergo during chromosome segregation. These satellite DNAs may have been selected not by their primary sequence but for their ability to form non-canonical DNA structures.[6] Since this effect may
be easily unnoticed by sequence analysis tools, structural studies on satellite DNA sequences are necessary to corroborate this hypothesis.
Since human centromeres have been extensively investigated, their alpha-satellite DNA is a useful model to understand the role of satellite DNAs in centromere structure and function. This satellite DNA has evolved highly homogenized higher-order repeats of the basic 171 bp repeat unit at functional centromeres and divergent monomeric repeats at the periphery (centromeric relics) (Figure 1). In humans, there are two types of alpha-satellite monomers: type A and type B (Figure 1), but lower primates have only type A satellites. The type B monomer evolved from type A in the common ancestor of great apes.[7] The
differences between A and B types lie in a 17 bp segment called the A/B box. This clustering is considered to be indicative of positive selection.[8] The B box is also known as the CENP-B box because it is the binding
site of the centromeric protein CENP-B. Type B monomers have spread to all human centromeres except the Y chromosome, which only has type A monomers.[9] Similarly, the same 17 bp CENP-B box sequence
appears in the mouse centromeric minor satellite DNA and not in the mouse Y centromeric repeat DNA.[10]
Therefore, this motif has evolved independently in an ancestor of the Mus musculus domesticus.
It has been proposed that CENP-B may function by juxtaposing two distal CENP-B boxes through DNA-protein and protein-protein interactions,[11] but it has also been suggested that the binding of
CENP-B may facilitate the folding of CENP-CENP-B box C-rich strands into dimeric i-motif structures.[12] Subsequent
studies have shown that the C-rich strand of the human satellite III DNA can also adopt the i-motif structure,[13] but it is now known that this human satellite does not belong to the functional centromere.
The i-motif is a four-stranded intercalated structure formed by the association of two parallel-stranded duplexes connected by hemi-protonated C:C+ base pairs.[14] The two duplexes are intercalated in
opposite orientations. Since i-motif formation requires protonation of cytosines,[15] these structures are more
stable at acidic pH, although, depending on particular C-rich sequences, they can be observed at neutral pH.[16] I-motifs can also exist at neutral pH under molecular crowded conditions[17] and under
transcriptionally induced negative superhelicity.[18] The recent remarkable finding that the transcription of
centromeric alpha-satellite DNA during mitosis is required for centromere function[19] supports that negative
superhelicity conditions may be common in these regions and, consequently, favor i-motif formation under physiological conditions. In the last few years, i-motifs are attracting a great deal of interest for their implication in biological processes and in DNA-nanotechnology (for recent reviews see[20]).
In the present study, we determine the solution structure of the A box of the human centromeric alpha-satellite DNA. The structure is a dimeric i-motif resulting from a head-to-tail association of two folded C-rich strands. The discovery of i-motif structures in the two types of alpha-satellite monomers leads us to suggest a potential role of this non-canonical structure in centromeric chromatin organization
Figure 1. Structure of the centromeric alpha-satellite DNA showing the position of the A and B boxes.
Results
The A box of the human alpha-satellite DNA contains tracts of two cytidines.
The consensus sequence of the human A box is 5’-TTCCTTTTCPyACCATAG-3’ [8] where Py can
be C (HS) or T (HST) in the autosomes and the X chromosome, but it is mainly C in the Y chromosome. In this study we have also used two truncated versions of HS (HS1 and HS2) (Figure 2). The residue numbering used in this paper is shown in Figure 2a, and it has been defined arbitrarily for convenient discussion of the NMR spectra and structures.
NMR, CD and mass spectrometry show that the C-rich strand of the A boxes form dimeric i-motifs.
Mass spectra of HS1 and HS2 at different pH conditions are shown in Figure S1 in the Supporting Information. In all cases, dimeric species are clearly detected, and they are more abundant at acidic pH. The isotopic distributions shown in Figure S1 are strikingly identical at the two pH values, showing a separation between consecutive 13C isotopes consistent with the presence of a dimer (see figure legend).
The CD spectra at acidic pH exhibit a positive band at around 285 nm and a negative one around 265 nm, which are characteristic of i-motif structures[21] (Figure 2c). Both bands disappear when the temperature or
pH increases, indicating a pH dependent denaturation process. The midpoint pH of this transition provides an apparent pKa value for the overall structure of HS2 of 6.1 (Figure 2d). Melting transitions were monitored
by CD obtaining Tm values at pH 4.0 of 26.6 and 30.5 ºC for HS1 and HS2, respectively (Figure S2 in Supporting Information).
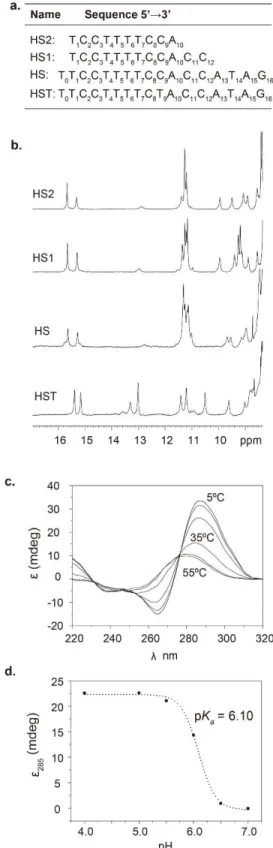
Figure 2. a) Sequences of the oligonucleotides studied. b) Exchangeable protons region of the NMR
spectra of the centromeric sequences in 25 mM NaPi, 100 mM NaCl buffer at pH 4.0 (HS, HS1 and HS2) and pH 4.5 (HST) T=5 ºC (Oligo concentrations: [HS2] = 2.0 mM, [HS1] = 2.0 mM, [HS] = 0.8 mM and [HST] = 0.8 mM). c) CD spectra of HS2 at different temperatures (Buffer conditions: 25 mM NaPi, 100 mM NaCl pH=4) ([HS2] = 100 μM). d) pH titration of HS2 at T=5ºC ([HS2] = 100 μM).
Under acidic conditions, proton NMR spectra show signals characteristic of non-canonical base pairs (Figure 2b and Figure S2 in the Supporting Information). The signals around 15.4 ppm are distinctive of cytosine imino protons involved in hemi-protonated C:C+ base pairs (as well as the signals at around
9.0-10.0 ppm for their amino protons).[14] The sharp signals between 10.0 and 11.5 ppm may correspond to
other non-canonical base pairs, most probably wobble T:T base pairs. The signal around 12.7 ppm corresponds to an A:T base pair. This signal becomes broad at pH 4.0 and disappears at pH 4.5 (see Figure S3 in the Supporting Information). Except by this broadening effect, the general features of the NMR spectra are very similar in a wide range of pH (3.5 to 6.5), in sodium and ammonium acetate buffer (the latter required for mass spectrometry experiments), and in a range of oligonucleotide concentrations between 100 μM and 3 mM (Figure S1 and S4 in the Supporting Information). This indicates that the species observed in the NMR and CD experiments are the same dimeric species observed in the mass spectrometry experiments.
Assignment of the NMR spectra and general structural features.
The NMR spectra of the oligonucleotides HS, containing the main variant of the full human A box, together with its truncated versions (HS1 and HS2), are shown in Figure 2b. In the three cases, NMR spectra are very similar. This resemblance is also observed in the two-dimensional spectra (see Figure 3a and Figures S5-6,9 in the Supporting Information), where almost identical NOE patterns between exchangeable protons are observed. This indicates that the three constructions are dimers with the same symmetry and stabilized by the same base pairs (number of C:C+, etc.), with only residues 1 to 10 involved
in base pair formation. This strong similarity allowed us to focus in the NMR spectra of HS1 and HS2 for resonance assignments.
Sequential assignment of exchangeable and non-exchangeable protons was conducted following standard methods (assignment lists are shown in the Supporting Information). The number of major signals found in the NMR spectra of HS2 and HS1 were 10 and 12, respectively, indicating the two subunits in the dimeric structures are magnetically equivalent. Additional broad and low intensity signals are observed in the spectra recorded at 5 ºC. These signals become sharper and more intense at higher temperature, becoming majoritary at T > 25-30 ºC, which indicates that correspond with the unfolded species. This behavior, illustrated in Figure S7 in the Supporting Information for the cytosine H5-H6 cross-peaks, is characteristic of equilibrium between the folded and unfolded species, which is slow in the NMR time scale.
Sequential contacts with A10 and T1 allowed the assignment of C9 and C2. The stacking order could be followed by H1’-H1’ connectivities between C2-C8, C2-C9 and C3-T7 (Figure 3c), and other NOEs such as H6C9-H1’C2, H6C3-H1’T7, H6C2-H1’C9, etc (Figure S8 in the Supporting Information). Sequential sugar-aromatic cross-peaks were found between thymine loop residues, allowing the assignment of T5, T6 and T7. The remaining thymine spin system did not present sequential connectivities and it was assigned to T4. In the case of HS1, some sequential NOEs were observed for residues A10C11 and to a less extension for C11C12. No sequential NOEs were observed for residues 13 to 16 in HS, suggesting that these residues are disordered in solution. According to the H6/8-H1’ NOE intensities all the glycosidic angles are anti.
The exchangeable proton spectra exhibit two signals at 15.68 and 15.32 ppm, indicative of hemiprotonated C:C+ base pairs (Figure 2b). Each of these signals presents four cross-peaks with amino
protons in the 8-10 ppm range (Figure 3a). This indicates that the two C:C+ base pairs occur between non
magnetically equivalent cytosines. NOEs between amino protons of C2 and C8 with H2’/H2” of the same residue are clearly observed (Figure 3a). Since these cross-peaks are characteristic of i-motifs and they occur through the major groove formed by antiparallel oriented neighbor strands, the only possible
orientation between both subunits is head-to-tail, with the minor grooves occurring between intra-molecular strands. This orientation is confirmed by the H1’-H1’ contacts mentioned above, and amino-H2’H2” contacts between C9 and T7, and C3 and T1 (Figure 3a). All the exchangeable and non-exchangeable NOEs are consistent with the following stacking order: A10-T1-C9-C2-C8-C3-T7. Additional NOEs between amino protons of C9 and methyl of T7, and amino protons of C3 and methyl of T1 confirm that C3-C9 base pair are located at the end of the cytosine stack. This location is also supported by the exchangeable protons of C3 and C9, which exhibit broader lines and disappear at lower temperatures than those of C2 and C8 (Figure S2 in the Supporting Information).
Several thymine imino protons are found between 10.5 and 11.5 ppm. The signals at 11.36 and 11.17 exhibit strong cross-peaks between them, indicating the formation of a T:T base pair. A number of contacts with the neighboring residues allow the assignment of these signals to the imino protons of T1 and T7, respectively (Figure 3a). Cross-peaks with C3 and C9 protons indicate that T1:T7 base pair is directly in contact with the C3:C9 base pair. At pH 3.6, an intense cross-peak between H8A10 with a thymine imino proton is observed, indicating the formation of a Hoogsteen base pair (Figure 3b). This imino proton was assigned to T6, since the assignment to T4 or T5 gave rise to strong constraint violations during the structural calculations. Moreover, a number of NOEs between protons of T1 and T6 with T7 and A10 were clearly detected, indicating that the T6:A10 Hoogsteen base pair is on top of T1:T7 (Figure 3). At higher pH, the signal of H3T6 becomes broader and disappears at pH 4.5. The only other signals affected in this range of pH are H2 and H8 of A10. The effect of pH in their chemical shifts is shown in Figure S3 in the Supporting Information. The pH titration curves exhibit a sigmoidal dependence with a midpoint value of 4.1, consistent with reported pKa values for adenine protonation in position N1. This apparent pKa value is
slightly higher than in the free mononucleotide (pKa = 3.5).[22]
As mentioned above, the exchangeable proton spectra of HS1 indicate that C11 and C12 are not involved in the core of intercalated cytosine pairs. Sequential sugar-base NOEs suggest that C11 stacks on top of A10. The lack of sequential NOEs for the remaining residues at the 3’-end of HS, and the fact that no exchangeable protons are observed for residues 13 to 16, indicate that these residues are mainly disordered.
Sugar conformation can be deduced from qualitative analysis of DQF-COSY spectra. H1’-H2’/2” cross-peaks for residues T4 to T7, and A10 are consistent with J1’2’ and J1’2” coupling constants in the range of 7-10 and 6-7 Hz, respectively. This indicates that the sugar conformations of these residues are in the general South domain. However, residues T1 and C2 exhibit very small J1’2’, indicating that these deoxyriboses adopt a North conformation. No direct experimental evidence of the sugar conformation of C3, C8 and C9 was obtained due to signal overlap.
Solution structure of HS2.
The three dimensional structure of HS2 was calculated on the basis of 300 experimental distance constraints by using restrained molecular dynamics methods, and following standard procedures used in our group[23]. A summary of the distance constraints is shown in Table S4 and Figure S14 in the Supporting
Information. Except for T4 and the corresponding residue in the symmetry related sub-unit, all residues are well defined, with an RMSD of 0.8 Å (Table S4). The final AMBER energies and NOE terms are reasonably low in all the structures, with no average distance constraint violation>0.7 Å. Atomic coordinates of HS2, have been deposited in the PDB (accession number 2MRZ).
The resulting structure is a dimer, consisting of two molecules of d(TCCTTTTCCA) arranged head-to-tail (see schematic representation in Figure 4e). As reflected by the number of signals in the NMR spectra, the dimer is symmetric. The two decamers associate with each other by forming four intercalated hemi-protonated C:C+ base pairs (C2-C8 and C3-C9, and their symmetry related counterparts), sandwiched
by two intermolecular T1:T7 base pairs. The structure is capped by two intermolecular T6:A10 Hoogsteen base pairs, and the unpaired T5. The base-paired cytidines present the characteristic sugar-sugar contacts between adjacent strands through the minor groove. The two sides of C:C+ stacks correspond with the
cytosine located at 3’-end of the C-tracts (3’E type of i-motif structures[20]). The two T:T base pairs,
contiguous to the C:C+ core stack, follow the same pattern of alternate base pair between parallel oriented
strands (Figure 4c). This feature confirms the ability of thymines to fit into intercalative C:C+ structures.[24]
However, the Hoogsteen AT base pairs occur between antiparallel oriented strands and do not follow the alternate base pair motif (Figure 4d). In spite of this, extensive stacking interactions occur between T6:A10 and T1:T7 base pairs. As shown in Figure 4a, residue T4 and its symmetry related one are mainly disordered.
All glycosidic angles are anti, with values ranging from -110º to -150º, with the exception of cytosines at the 3’-end of the tracts (C8, C9 and their symmetric counterparts) which adopt a high anti glycosidic conformation of around -80º to -90º. Sugar pucker of T1, C2, C3 and C9 are in the North domain, C8 adopts an East conformation, and the remaining residues are in the general South domain. The dihedral torsion angles are shown in Table S5 in the Supporting Information.
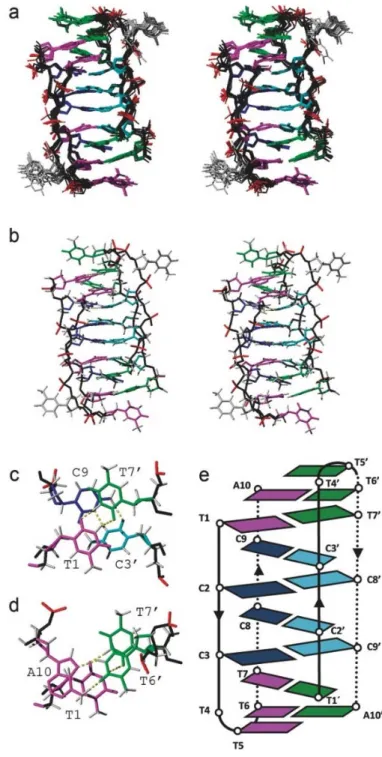
Figure 3. Regions of NOESY spectra of HS2 at pH 3.6 and T=5 ºC ([HS2] = 2.9 mM). a) Four panels with
exchangeable proton regions of NOESY spectra of HS2 in 90/10 H2O/D2O (mixing time 150 ms). b) Detail
of NOESY spectra of HS2 in 90/10 H2O/D2O (mixing time 50 ms) showing a Hoogsteen NOE pattern. c)
Solution structure of the human A box (HS)
As mentioned above, all the NMR evidences indicate that the structure of HS1 and HS are very similar to that of HS2. In fact, most signals in HS1 and HS2 spectra are almost identical (see Figures 3, and Figures S5, S6 and S9 in the Supporting Information). Only some weak sequential cross-peaks between A10C11C12 were detected in HS1’s NOESY spectra, suggesting that C11 and C12 are relatively disordered, and they are not involved in additional base pairs. Interestingly, the CD melting experiments show that addition of these two residues reduces the thermal stability of HS1 vs. HS2 (Figure S2 in the Supporting Information). This is probably due to the presence of two consecutive cytosines, which are partially charged at pH 4. Although dangling ends are usually stabilizing in duplex structures, the opposite effect has been observed in non-canonical structures.[25]
In the case of HS, the NMR spectra indicate the structure is stabilized by the same base pairs as
HS1 and HS2 (see Figure S9 in the Supporting Information), and that the 3’-terminal tail (residues A13 to
G16) is completely disordered. Taking together the NMR spectra and the mass spectrometry data mentioned above, we can conclude that the major structure of the complete human A box is the dimer represented in Figure 5b. The structure consists of two well-defined loops (residues 1 to 10) that interact with each other through the formation of four intercalative C:C+, two T:T and two A:T Hoogsteen base pairs
with the remaining residues (11 to 16) being mainly disordered.
The small broad signals observed in the cytosine imino regions at low temperature suggest the formation of an additional species. This minor species, which may be a different dimer or a higher order multimer, has a very low population of less than 10% according to the signal intensities, and it is only observed at low temperature.
Figure 4. Dimeric structure of HS2. a) Stereo view of the ensemble of the 10 calculated structures. b)
Stereoview of the average structure. c) Detail of the stacking interaction between C:C+ and T:T base pairs.
d) Detail of the stacking interaction between T:T and the capping Hoogsteen A:T base pair. e) Schematic representation of the dimeric structure of HS2. Colour code: cytosines in the two sub-units are shown in blue and cyan, respectively; well-defined thymines and adenines in the two sub-units are shown in magenta and green, respectively; no well-defined residues in grey; and backbone in black. Hydrogen bonds are indicated in yellow.
The structure of the main variant of the human A box (C9T9).
As shown in Figure S10a in the Supporting Information, mass spectrometry data show that the oligonucleotide HST forms dimeric structures at neutral pH. The NMR spectra of HST, shown in Figure 2b and Figure S10b in the Supporting Information, exhibit the characteristic signals of C:C+ base pairs. NMR
melting experiments indicated that HST has a similar thermal stability as HS (Figure S11 in the Supporting Information). The analysis of the 2D spectra clearly shows that the dimer is symmetrical (the two subunits are equivalent) and is stabilized by the formation of four C:C+ base pairs. Two imino signals at 15.41 and
15.13 ppm, corresponding to the hemiprotonated C:C+ base pairs, exhibit four cross-peaks with cytosine
amino protons, indicating that the C:C+ base pairs occur between non-equivalent residues. Spectral
assignment of the cytosine core can be carried out by standard methods and shows that these pairs are C2-C11 and C3-C12 (see Figure S12 in the Supporting Information). The only possible arrangement of a symmetric dimer with these base pairs is a head-to-tail association of the two subunits, with the stacking order T1-A13-C2-C12-C3-C11-T4-A10. This order could be confirmed by a number of inter-strand H1’-H1’ cross-peaks along the minor groove, and inter-strand amino-H2’H2” cross-peaks through the major groove. This indicates that the core of C:C+ base pairs in the dimeric structures of HS and HST are very similar,
with the role of cytosines C8 and C9 in the main variant (HS) being substituted by C11 and C12 in the C9T9 variant (HST) (see Figure 5c and Figure S13 in the Supporting Information).
In spite of these similarities in the core, the NMR spectra indicate that there are significant differences in the loop regions. Of particular relevance are the two signals around 13 ppm, indicative of formation of two A:T base pairs, which corresponds with four base pairs in the dimer. The NOE cross-peaks between the imino at 13.08 ppm and adenine H2 and amino protons indicate the formation of a Watson-Crick or reverse Watson-Watson-Crick base pair. A number of NOEs with the neighbor C2:C11 base pair suggest that this A:T pair is intermolecular and corresponds with T4:A13 (Figure 5c and Figure S13 in the Supporting Information). The imino signal at 12.95 ppm exhibits a strong cross-peak with the H8A10, indicating the formation of a Hoogsteen base-pair. With the experimental data available, this imino resonance could be assigned to T1 or T14, giving rise to the base pairs T1:A10 or T14:A10, respectively. Model calculations with these two possibilities and the experimental distance constraints derived from unambiguously assigned NOEs indicate that a Hoogsteen T14:A10 base pair gives rise to better structures (no significant distortions, and lower distance constraints violations). Unfortunately, the long loops in HST prevent the extraction of enough unambiguous distance constraints from the NMR spectra. Although we can not provide a full picture of the structure of the loops, we can conclude that the structure is a head-to-tail association of two subunits stabilized by four hemiprotonated C:C+ base pairs and four A:T base pairs, as shown schematically in
Figure 5c. A plausible model based on the experimental information available is shown in Figure S13 in the Supporting Information.
Figure 5. a) Model for nucleosome bundling in centromeric chromatin. B/A boxes of the alpha–satellite
DNA (in red) would maintain the structural organization of the centromere by forming dimeric i-motif structures, like those found in vitro for the two main variants of the alpha-satellite A box, shown schematically in panels HS (b), and HST (c).
Discussion
The structures of the A box and B box of the human alpha-satellite are examples of self-recognition in DNA sequences. In a previous study, Gallego et al.[12] showed that the B box forms an i-motif resulting
from the dimerization of two folded C-rich strands in a head-to-head way. The dimer is stabilized by a tract of five C:C+ hemiprotonated base pairs capped at one end by a G:T:G:T minor groove tetrad and a A:A
base pair at the other side. On the other hand, we show here that the A box also forms a dimeric i-motif. In this case, the two folded C-rich strands associate in a head-to-tail way and interact through formation of four C:C+ base pairs, and other additional interactions that differ in each of the two main A box variants. In
the main variant, the C:C+ core is extended at each side by T:T base pairs, which follow the same pattern
of intercalated base pairs between parallel oriented strands. The structure is capped at both ends by Hoogsteen A:T base pairs between antiparallel oriented strands and an unpaired thymine. In the second variant, the C9T9 mutation provokes a rearrangement of the i-motif core, which consists now of C2-C3 and C11-C12 tracts. Consequently the loops in HST structure are much larger than in HS (Figure 5). Stacking order between C:C+ base pairs is 3’E in HS and 5’E in HST. However, considering that the closing
T1:T7 extends the i-motif core of HS, both structures can be seen as having the same 5’E intercalation topology. These T:T base pairs in HS are substituted by A:T base pairs in HST, most probably in a reverse Watson-Crick conformation. This difference is consistent with a recent report by Lieblein et al., showing that adenines next to a C:C+ base pairs favor 5’E conformations in i-motifs.[26] Interestingly, both structures are
capped by Hoogsteen A:T base pairs between antiparallel oriented strands.
T:T base pairs are well accommodated in i-motif structures[27] and they have been observed in
loops connecting C-tracts.[28] A:T base pairs are not so common, but they have been also observed in
monomeric[13, 28-29] and tetrameric i-motifs.[30] In some cases, adenine protonation affects the structure[13, 31]
and the stability of the i-motif. Generally, this effect is destabilizing since protonation at N1 position disrupts Watson-Crick base pairs.[13, 31] In our case, adenine protonation in N1 results in stabilization of an A:T
Hoogsteen base pair, probably due to acidification of the adenine amino protons, enabling them to form stronger hydrogen bonds. This stabilization of Hoogsteen base pair upon adenine protonation has been reported in some RNA molecules, like the hairpin ribozyme.[22b]
As usual in i-motif structures, the C:C+ pairing provokes the formation of four grooves; two major
grooves and two extremely narrow minor grooves. Interestingly, in all these structures the minor grooves are intra-molecular, as reported in other dimeric i-motif structures.[24, 27, 32] This is in contrast with the dimeric
i-motif formed by d(5mCCTTTACC),[33] where the minor groove is inter-molecular.
All these dimeric structures show that C:C+ intercalative base pairs constitute a robust motif for
self-recognition between DNA sequences. Interestingly, the structures of HS and HST obtained in this study exemplify how the sequences connecting short C-tracts are able to undergo large structural re-adjustments to maintain the intercalated C:C+ core and preserve dimerization. The ability of diverse (and apparently
unrelated) sequences connecting C-tracts to form stable i-motifs makes the identification of these dimeric motifs at primary sequence level very difficult.
Recent in vivo evidence for phasing of humans and rice CENP-A nucleosomes on centromeric satellites has shown that nucleosome positioning is a physical requirement for centromere formation.[3a, 34]
Moreover, human, mouse, rice and Drosophila centromeres contain blocks of CENP-A nucleosomes that are interspersed with blocks of canonical histone H3 nucleosomes,[2a, 35] and although the folding of this
centromeric chromatin is still unresolved, it is assumed that CENP-A nucleosomes self-associate laterally and exclude histone H3 containing nucleosomes to form a lattice on the surface of the chromosome primary
constriction. The flexibility observed in the DNA regions located at the entrance and the exit of CENP-A nucleosomes may be the physical feature that facilitates the lateral interactions.[3]
In humans, the phasing of CENP-A nucleosomes on alpha-satellite DNA places the A box and the CENP-B box at the entrance and exit of the nucleosome.[3a] In mice, the CENP-B box of the centromeric
minor satellite also appears at the end of nucleosome core particles.[36] Moreover, the binding of CENP-B
to CENP-A nucleosomes does not protect the CENP-B box from nuclease digestion.[37] Therefore, these
regions remain accessible in each CENP-A nucleosome. It is important to mention that although the mouse Y centromeric satellite does not contain CENP-boxes, it also has a sequence able to form an i-motif in an equivalent position (Figure S15 in the Supporting Information).
The function of mammalian CENP-Bs in natural centromeres still remains mysterious. On the one hand, higher-order alpha-satellite repeats containing CENP-B boxes and the CENP-B itself appear to be required for de novo centromere formation in human artificial chromosome assays,[1, 38] and it has been
shown that CENP-B provides a parallel pathway for kinetochore formation.[2c] On the other hand, CENP-B
is not an essential centromeric protein because it is absent from functional centromeres that lack CENP-B boxes (human and mouse Y centromeres and human neocentromeres). Moreover, CENP-B null mice are viable and do not show mitotic or meiotic defects.[39]
Recently, using both CENP-A chromatin immunoprecipitation followed by sequencing analysis and artificial chromosome assays, Willard’s group has been able to demonstrate that it is not just the presence of CENP-B boxes but rather the pattern of CENP-B boxes and A boxes within the higher-order repeat array that contributes to de novo centromere formation[1]. Therefore, a hierarchical mechanism of chromatin
folding based on CENP-B boxes and A boxes interactions may determine the three-dimensional structure of the centromere.
The discovery of i-motif structures in the two types of alpha-satellites (A box and B box) strongly reinforces the idea that this non-canonical DNA structure may have a role in the structural organization of the centromere. The biochemical data discussed above together with our structural findings are consistent with the centromeric nucleosome organization shown in Figure 5. Thus, it is expected that the higher stability of CENP-B box or A box i-motif homo-dimers versus CENP-B box/A box i-motif hetero-dimers would prevent out-of-register interaction of higher-order repeat units and, in turn, would determine the ordered spatial arrangement of the centromeric chromatin in metaphase chromosomes. Moreover, the high stability of the i-motifs may confer an enhanced resistance against the pulling forces felt by the centromeric chromatin during chromosome segregation. In this sense, it is interesting to note the recent report by Famulok et al, showing how DNA nanocircles containing C-tracts can be arranged in well-defined assemblies through formation of intermolecular i-motifs.[40] Likewise, i-motifs may induce the assembly of more complex
multicomponent DNA architectures in the cell.
All together, these results support our initial hypothesis that centromeric alpha-satellite DNA may have been selected not by their primary sequence but by their ability to form i-motif structures. If this were the case, the “centromere paradox” may well be explained by shared secondary structures without shared primary structures.
Experimental Section
Sample preparation. Oligonucleotides were purchased from Integrated DNA Technologies, IDT, Coralville,
IA, USA. Samples for NMR experiments were dissolved in either D2O or 9:1 H2O/D2O. Experiments were
performed either with no buffer added or in 25 mM sodium phosphate buffer, and 100 mM NaCl. Experiments were carried out at different pHs, ranging from 3.5 to 7. pH was adjusted by adding aliquots of either concentrated solution of DCl or NaOD.
NMR experiments. All NMR spectra were acquired in Bruker spectrometers operating at 600 and 800 MHz,
equipped with cryoprobes and processed with the TOPSPIN software. In the experiments in D2O,
presaturation was used to suppress the residual H2O signal. A jump-and-return pulse sequence[41] was
employed to observe the rapidly exchanging protons in 1D H2O experiments. NOESY spectra in D2O and
9:1 H2O/D2O were acquired with mixing times of 50, 150, and 250 ms. TOCSY spectra were recorded with
the standard MLEV-17 spin-lock sequence and a mixing time of 80 ms. In most of the experiments in H2O,
water suppression was achieved by including a WATERGATE module in the pulse sequence prior to acquisition. The spectral analysis program SPARKY[42] was used for semiautomatic assignment of the
NOESY cross-peaks and quantitative evaluation of the NOE intensities.
Circular Dichroism spectroscopy. Circular dichroism spectra at different temperatures were recorded on
a Jasco J-810 spectropolarimeter fitted with a thermostated cell holder. CD spectra were recorded in 25 mM sodium phosphate buffer, pH 4, with 100 mM NaCl (100 μM oligo concentration). CD melting curves were recorded at the wavelength of the larger positive band, 285 nm, with a heating rate of 0.5 ºC·min-1.
Titration experiments were performed by recording the absorbance at λ = 285 nm and different pH values. pH was adjusted by adding aliquots of concentrated solutions of DCl or NaOD.
Mass spectrometry. All ESI-MS experiments were carried out in the negative ion mode on an Exactive
ESI-Orbitrap mass spectrometer (Thermo Scientific, Bremen, Germany). The ESI spray voltage and capillary voltage used were -2.75 kV and -20 V, respectively. The capillary temperature was set to 150 ºC. Tube lens and skimmer voltage were fixed to 180 V and -10 V, respectively. All the oligonucleotides analysed were dissolved at 100 μM in 100 mM NH4OAc buffer at pH 7 and pH 4, and were injected at a
flow rate of 4 μL min-1.
NMR constraints. Initial calculations were performed with qualitative distance constraints (classified as 3,
4 or 5 Å) and the resulting structures were then refined by employing more accurate distance constraints obtained from a complete relaxation matrix analysis with the program MARDIGRAS.[43] Error bounds in the
interprotonic distances were estimated by carrying out several MARDIGRAS calculations with different initial models, mixing times and correlation times, as described in previous works. In addition to these experimentally derived constraints, hydrogen bond and planarity constrains for the base pairs were used in the initial DYANA calculations. Target values for distances and angles related to hydrogen bonds were set to values obtained from crystallographic data in related structures.[44] Due to the relatively broad line-widths
of the sugar proton signals, J-coupling constants were not accurately measured, but only roughly estimated from DQF-COSY cross-peaks. Loose values were set for the sugar dihedral angles δ, ν1 and ν2 to constrain
deoxyribose conformation to North or South domain.
Structure calculations. Structures of HS2 were calculated with the program DYANA 1.4[45] and further
refined with the SANDER module of the molecular dynamics package AMBER 7.0.[46] Initial DYANA
calculations were carried out on the basis of qualitative distance constraints. The resulting structures were used as initial models in the complete relaxation matrix calculations to obtain accurate distance constraints, as described in the previous paragraph. These structures were taken as starting points for the AMBER refinement, consisting of an annealing protocol in vacuo, followed by trajectories of 500 ps each in which explicit solvent molecules were included and using the Particle Mesh Ewald method to evaluate long-range electrostatic interactions. Non-experimental constrains used in the initial DYANA calculations were removed in the AMBER refinement. The specific protocols for these calculations have been describe elsewhere.[23] The AMBER-98 force field[47] was used to describe the DNA, and the TIP3P model was used
experimental constraints derived from the assigned NOEs, and additional hydrogen bonds and planarity constraints for different possible combinations of AT base pairs (in either Hoogsteen or Watson-Crick conformations). The resulting structures with less residual violations and geometrical distortions were considered as the final models. Analysis of the representative structures as well as the MD trajectories was carried out with the programs Curves V5.1[48] and MOLMOL.[49]
Acknowledgements
We gratefully acknowledge Dr. Douglas V. Laurents for revision of the manuscript and his useful comments. We also thank the Structural Biophysical Chemistry platform of the IECB (CNRS UMS3033 / Inserm US001) for the access to the mass spectrometry facility and Dr. Frederic Rosu for his kind assistance. This work was supported by the MICINN (CTQ2010-21567-C02-02 to CG, BFU2011-30295-C02-01 to AV), the Inserm (ATIP-Avenir Grant no. R12086GS to V.G.), the Conseil Régional Aquitaine (Grant no. 20121304005 to V.G.), the EU (FP7-PEOPLE-2012-CIG-333611 to V.G.), and the institutional grant from the Fundación Ramón Areces to the Centro de Biología Molecular “Severo Ochoa”). MG was supported by the FPI-fellowship BES-2009-027909.
Keywords: i-motif • quadruplex • structural biology • nucleic acids • centromere
References
[1] K. E. Hayden, E. D. Strome, S. L. Merrett, H.-R. Lee, M. K. Rudd, H. F. Willard, Mol. Cell. Biol.
2013, 33, 763-772.
[2] a) R. C. Allshire, G. H. Karpen, Nat. Rev. Genet. 2008, 9, 923-937; b) B. E. Black, D. W. Cleveland,
Cell 2011, 144, 471-479; c) D. Fachinetti, H. D. Folco, Y. Nechemia-Arbely, L. P. Valente, K.
Nguyen, A. J. Wong, Q. Zhu, A. J. Holland, A. Desai, L. E. Jansen, D. W. Cleveland, Nat. Cell Biol.
2013, 15, 1056-1066.
[3] a) D. Hasson, T. Panchenko, K. J. Salimian, M. U. Salman, N. Sekulic, A. Alonso, P. E. Warburton, B. E. Black, Nat. Struct. Mol. Biol. 2013, 20, 687-695; b) T. Panchenko, T. C. Sorensen, C. L. Woodcock, Z. Y. Kan, S. Wood, M. G. Resch, K. Luger, S. W. Englander, J. C. Hansen, B. E. Black,
Proc. Natl. Acad. Sci. U. S. A. 2011, 108, 16588-16593.
[4] a) H. S. Malik, S. Henikoff, Genetics 2001, 157, 1293-1298; b) P. B. Talbert, T. D. Bryson, S. Henikoff, J. Biol. 2004, 3, 18; c) M. G. Schueler, W. Swanson, P. J. Thomas, E. D. Green, Mol. Biol.
Evol. 2010, 27, 1585-1597.
[5] S. Henikoff, K. Ahmad, H. S. Malik, Science 2001, 293, 1098-1102. [6] J. P. Abad, A. Villasante, Genetica 2000, 109, 71-75.
[7] I. Alexandrov, A. Kazakov, I. Tumeneva, V. Shepelev, Y. Yurov, Chromosoma 2001, 110, 253-266. [8] L. Romanova, G. Deriagin, T. Mashkova, I. Tumeneva, A. Mushegian, L. Kisselev, I. Alexandrov,
J. Mol. Biol. 1996, 261, 334-340.
[9] C. Tyler-Smith, W. R. Brown, J. Mol. Biol. 1987, 195, 457-470.
[10] a) P. Kalitsis, B. Griffiths, K. H. Choo, Proc. Natl. Acad. Sci. U. S. A. 2006, 103, 8786-8791; b) M. D. Pertile, A. N. Graham, K. A. Choo, P. Kalitsis, Genome Res. 2009, 19, 2202-2213.
[11] K. Yoda, K. Kitagawa, H. Masumoto, Y. Muro, T. Okazaki, J. Cell Biol. 1992, 119, 1413-1427. [12] a) J. Gallego, S. H. Chou, B. R. Reid, J. Mol. Biol. 1997, 273, 840-856; b) J. Gallego, E. B. Golden,
[13] S. Nonin-Lecomte, J. L. Leroy, J. Mol. Biol. 2001, 309, 491-506.
[14] a) K. Gehring, J.-L. Leroy, M. Guéron, Nature 1993, 363, 561-565; b) J. L. Leroy, K. Gehring, A. Kettani, M. Guéron, Biochemistry 1993, 32, 6019-6031.
[15] A. L. Lieblein, M. Kramer, A. Dreuw, B. Furtig, H. Schwalbe, Angew. Chem. Int. Ed. Engl. 2012, 51, 4067-4070.
[16] a) J. A. Brazier, A. Shah, G. D. Brown, Chem. Commun. 2012, 48, 10739-10741; b) J. L. Leroy, M. Guéron, J. L. Mergny, C. Hélène, Nucleic Acids Res. 1994, 22, 1600-1606.
[17] J. Cui, P. Waltman, V. H. Le, E. A. Lewis, Molecules 2013, 18, 12751-12767. [18] D. Sun, L. H. Hurley, J. Med. Chem. 2009, 52, 2863-2874.
[19] F. L. Chan, O. J. Marshall, R. Saffery, B. W. Kim, E. Earle, K. H. Choo, L. H. Wong, Proc. Natl.
Acad. Sci. U. S. A. 2012, 109, 1979-1984.
[20] a) S. Benabou, A. Aviñó, R. Eritja, C. González, R. Gargallo, RSC Advances 2014, 4, 26956-26980; b) Y. Dong, Z. Yang, D. Liu, Acc. Chem. Res. 2014, 47, 1853-1860; c) H. A. Day, P. Pavlou, Z. A. E. Waller, Bioorg. Med. Chem. 2014, 22, 4407-4418.
[21] J. Kypr, I. Kejnovská, D. Renčiuk, M. Vorlíčková, Nucleic Acids Res. 2009, 37, 1713-1725. [22] a) M. Guéron, J. L. Leroy, Methods Enzymol. 1995, 261, 383-413; b) S. Ravindranathan, S. E.
Butcher, J. Feigon, Biochemistry 2000, 39, 16026-16032.
[23] R. Soliva, V. Monaco, I. Gómez-Pinto, N. Meeuwenoord, G. Van der Marel, J. Van Boom, C. González, M. Orozco, Nucleic Acids Res. 2001, 29, 2973-2985.
[24] M. Canalia, J. L. Leroy, Nucleic Acids Res. 2005, 33, 5471-5481. [25] K. L. Hayden, D. E. Graves, Molecules 2014, 19, 2286-2298.
[26] A. L. Lieblein, B. Furtig, H. Schwalbe, ChemBioChem 2013, 14, 1226-1230. [27] M. Canalia, J. L. Leroy, J. Am. Chem. Soc. 2009, 131, 12870-12871. [28] X. Han, J. L. Leroy, M. Guéron, J. Mol. Biol. 1998, 278, 949-965.
[29] S. Benabou, R. Ferreira, A. Aviñó, C. González, S. Lyonnais, M. Solà, R. Eritja, J. Jaumot, R. Gargallo, Biochim. Biophys. Acta 2014, 1840, 41-52.
[30] C. Kang, I. Berger, C. Lockshin, R. Ratliff, R. Moyzis, A. Rich, Proc. Natl. Acad. Sci. U. S. A. 1995,
92, 3874-3878.
[31] S. Fernández, R. Eritja, A. Aviñó, J. Jaumot, R. Gargallo, Int. J. Biol. Macromol. 2011, 49, 729-736. [32] N. Escaja, J. Viladoms, M. Garavís, A. Villasante, E. Pedroso, C. González, Nucleic Acids Res.
2012, 40, 11737-11747.
[33] S. Nonin, A. T. Phan, J. L. Leroy, Structure 1997, 5, 1231-1246.
[34] T. Zhang, P. B. Talbert, W. Zhang, Y. Wu, Z. Yang, J. G. Henikoff, S. Henikoff, J. Jiang, Proc. Natl.
Acad. Sci. U. S. A. 2013, 110, E4875-4883.
[35] M. D. Blower, B. A. Sullivan, G. H. Karpen, Dev. Cell 2002, 2, 319-330.
[36] H. R. Widlund, H. Cao, S. Simonsson, E. Magnusson, T. Simonsson, P. E. Nielsen, J. D. Kahn, D. M. Crothers, M. Kubista, J. Mol. Biol. 1997, 267, 807-817.
[37] Y. Tanaka, H. Tachiwana, K. Yoda, H. Masumoto, T. Okazaki, H. Kurumizaka, S. Yokoyama, J.
Biol. Chem. 2005, 280, 41609-41618.
[38] a) J. J. Harrington, G. Van Bokkelen, R. W. Mays, K. Gustashaw, H. F. Willard, Nat. Genet. 1997,
15, 345-355; b) J. Ohzeki, M. Nakano, T. Okada, H. Masumoto, J. Cell Biol. 2002, 159, 765-775;
c) T. Okada, J.-i. Ohzeki, M. Nakano, K. Yoda, W. R. Brinkley, V. Larionov, H. Masumoto, Cell
2007, 131, 1287-1300; d) M. Ikeno, B. Grimes, T. Okazaki, M. Nakano, K. Saitoh, H. Hoshino, N.
I. McGill, H. Cooke, H. Masumoto, Nat. Biotechnol. 1998, 16, 431-439.
[39] a) D. F. Hudson, K. J. Fowler, E. Earle, R. Saffery, P. Kalitsis, H. Trowell, J. Hill, N. G. Wreford, D. M. de Kretser, M. R. Cancilla, E. Howman, L. Hii, S. M. Cutts, D. V. Irvine, K. H. Choo, J. Cell Biol.
1998, 141, 309-319; b) M. Kapoor, R. M. de Oca Luna, G. Liu, G. Lozano, C. Cummings, M.
Mancini, I. Ouspenski, B. Brinkley, G. S. May, Chromosoma 1998, 107, 570-576; c) A. V. Perez-Castro, F. L. Shamanski, J. J. Meneses, T. L. Lovato, K. G. Vogel, R. K. Moyzis, R. Pedersen, Dev.
Biol. 1998, 201, 135-143.
[40] T. Li, M. Famulok, J. Am. Chem. Soc. 2013, 135, 1593-1599. [41] P. Plateau, M. Guéron, J. Am. Chem. Soc. 1982, 104, 7310-7311. [42] D. T. Goddard, G. Kneller, 3. ed., University of California, San Francisco. [43] B. A. Borgias, T. L. James, J. Magn. Reson. 1990, 87, 475-487.
[44] L. Cai, L. Chen, S. Raghavan, A. Rich, R. Ratliff, R. Moyzis, Nucleic Acids Res. 1998, 26, 4696-4705.
[45] P. Guntert, C. Mumenthaler, K. Wüthrich, J. Mol. Biol. 1997, 273, 283-298.
[46] D. A. Case, D. A. Pearlman, J. W. Caldwell, T. E. C. III, J. Wang, W. S. Ross, C. L. Simmerling, T. A. Darden, K. M. Merz, R. V. Stanton, A. L. Cheng, J. J. Vincent, M. Crowley, V. Tsui, H. Gohlke, R. J. Radmer, Y. Duan, J. Pitera, I. Massova, G. L. Seibel, U. C. Singh, P. K. Weiner, P. A. Kollman, University of California, San Francisco, 2002.
[47] W. D. Cornell, P. Cieplak, C. I. Bayly, I. R. Gould, K. Merz, D. M. Ferguson, D. C. Spellmeyer, T. Fox, J. W. Caldwell, P. A. Kollman, J. Am. Chem. Soc. 1995, 117, 5179-5197.
[48] R. Lavery, H. Sklenar, 3.0 ed., Laboratory of Theoretical Biochemistry CNRS, Paris, 1990. [49] R. Koradi, M. Billeter, K. Wüthrich, J. Mol. Graphics 1996, 14, 29-32.

![Figure 3. Regions of NOESY spectra of HS2 at pH 3.6 and T=5 ºC ([HS2] = 2.9 mM). a) Four panels with exchangeable proton regions of NOESY spectra of HS2 in 90/10 H 2 O/D 2 O (mixing time 150 ms)](https://thumb-eu.123doks.com/thumbv2/123doknet/14550799.536898/8.918.128.824.488.1021/figure-regions-noesy-spectra-panels-exchangeable-regions-spectra.webp)