Designing and Testing the Neutron Source
Deployment System and Calibration Plan for a
Dark Matter Detector
by
Shawn Westerdale
Submitted to the Department of Physics
in partial fulfillment of the requirements for the degree of
Bachelor of Science in Physics
at the
MASSACHUSETTS INSTITUTE OF TECHNOLOGY
ARCHIVES
June 2010
@
Massachusetts Institute of Technology 2010. All rights reserved.
Author
...
Department of Physics
May 6, 2010
Certified by.
Jocelyn Monroe
Assistant Professor
Thesis Supervisor
Accepted by ....
Professor Nergis Mavalvala
Senior Thesis Coordinator, Department of Physics
MASSACHUSETTS INSTITUTE OF TECHN#~OLOG:Y
JUN
0
8 2011
Designing and Testing the Neutron Source Deployment
System and Calibration Plan for a Dark Matter Detector
by
Shawn Westerdale
Submitted to the Department of Physics on May 6, 2010, in partial fulfillment of the
requirements for the degree of Bachelor of Science in Physics
Abstract
In this thesis, we designed and tested a calibration and deployment system for the MiniCLEAN dark matter detector. The deployment system uses a computer con-trolled winch to lower a canister containing a neutron source into the detector where the neutron source pulses to produce calibration data. The winch then pulls the neutron source back out of the detector. We found that the deployment system po-sition is precise to under 0.05 cm, one tenth of the minimum required precision. We designed a canister that will hold the neutron source during the calibration process. The canister will contain a dielectric gel to thermally and electrically insulate the high voltage electronics and the neutron source from the rest of the detector. We cal-culated the equilibrium temperature change of the calibration neutron source when it is turned on and found that the temperature increases by 92.6+isi K, correspond-ing to a rise in the dielectric gel height of 1.501i.9 cm. This temperature change is within the service temperature range of the dielectric gel; however, a more thermally conductive gel could still be used to reduce the temperature increase. We simulate the background external neutrons in MiniCLEAN and find that the addition of an air-filled calibration tube to the basic MiniCLEAN design has little effect on the ex-ternal neutron background rate. Lastly, we simulate the calibration process in order to determine how long we must calibrate MiniCLEAN in order to obtain the desired
5% statistical precision on measurements of the calibration neutron-induced recoil
spectrum. We found that a minimum of 2.48x 10⁶ neutrons are needed to measure the total counts in the region of interest in energy to 5% (corresponding to a pulse mode calibration time of 124 seconds assuming that neutrons are produced at a rate
of 105 per second), and 2.02x 10⁷ neutrons are needed to achieve 5% measurements of the energy spectrum with 2 KeVee binning in the region of interest (corresponding to a time of 1005 seconds).
Thesis Supervisor: Jocelyn Monroe Title: Assistant Professor
Acknowledgments
First and foremost, I would like to thank my advisor Professor Jocelyn Monroe for putting up with me for most of these last four years and being a great mentor to me as I developed as a physicist. I don't think I can express my gratitude for all that she has done to help me learn the ins and outs of being a physicist and for helping me set the course for the next step in my career, in addition to all that she has done to help me produce this thesis.
I would also like to thank Kim Palladino for patiently answering my questions
whenever I got confused. Your guidance and support were incredibly instrumental in doing all of the research and analysis that went into writing this document. I also want to express my gratitude to Lu Feng and the entire MIT MiniCLEAN group for working with me as I progressed through my research and for helping me figure things out whenever I got stuck on a problem.
I would also like to extend a warm thank you out to the Weak Interactions Team
at Los Alamos National Laboratory. I am especially grateful to Vince Guiseppe for being both a mentor and a friend as I was working some place new somewhere far from home. I am also indebted to Keith Rielage and Andrew Hime for accepting me onto their team and helping me learn what it is like to be a physicist.
While at MIT, I have taken many great classes with many amazing professors. One professor who particularly stands out, though, is Professor Janet Conrad, my particle physics professor. Your friendly guidance and brilliant instruction has helped inspire me to pursue particle physics and have stuck with me as a constant reminder of how much fun one can have while exploring the inner workings of the universe. I would also like to thank Professor Nergis Mavalvala, my Junior Lab instructor, who helped make one of my most stressful terms at MIT also one of my most fun and educational terms. Many of the data collection and analysis techniques that went
Contents
1 Introduction
1.1 Evidence for Dark Matter . . .
1.1.1 Galactic Rotation Curve
1.1.2 Bullet Cluster . . . .
1.1.3 WMAP . . . .
1.2 Dark Matter Particle Candidates 1.2.1 WIMPs . . . . 1.2.2 Axions . . . .
1.2.3 MaCHOs . . . .
1.2.4 Sterile Neutrinos . . . .
1.3 Direct Dark Matter Detection .
1.3.1 Axion Searches and ADM
1.3.2 WIMP Searches...
1.3.3 Event Rates . . . .
1.4 MiniCLEAN . . . .
2 Calibration Deployment System 2.1 Cables ... 2.2 M otor . .. . . . .. . .. 2.3 Controller . . . . 2.4 Yo-Yo Potentiometer . . . . 2.4.1 Repeatability . . . . 2.5 Software . . . . 21 22 28 29 30 31 32 32 33 40 45 46 47 48 50 52 53 . . . . . . . . ... ... . . .
2.6 Deployment Test ... 3 Neutron Calibration Source
3.1 Neutron Source . . . .. . . .. .
3.2 Neutron Source Canister . . . .
3.3 Heat Generation . . . .
3.3.1 Heat Generation in Test Stand . . . . .
3.3.2 Heat Generation in MiniCLEAN . . . .
4 Calibration Simulations
4.1 Calibration System Background . . . . 4.1.1 Neutron Background Sources . . . .
4.1.2 Neutron Background Simulations . . . .
4.2 Calibration System Signal . . . . 4.2.1 Standard Geometry Results . . . . 4.2.2 Geometry with Calibration Tube Results 4.2.3 Full Calibration Geometry Results .
5 Conclusions
A High Voltage Feedthrough Technical Data
B PAVE Feedthrough Technical Data
C High Voltage Source Technical Data D Dielectric Gel Technical Data
E USB DAC Technical Data
F Yoyo Potentiometer Technical Data G Winch Control Functions
63 . . . . 63 . . . . 65 . . . . 68 . . . . 69 . . . . 72 75 75 75 80 81 83 86 88 91 95 97 99 101 103 105 107
List of Figures
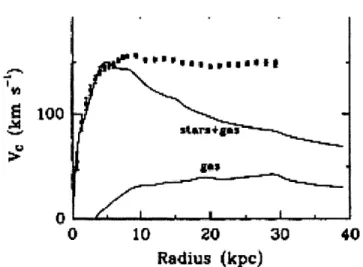
1-1 The measured galactic rotation velocity (in km/s) versus the distance
from the center of the galaxy (in kpc) for the NGC 1398 galaxy. The dotted points show the measured velocities and the lines show the gaseous and stellar contributions to this velocity, as labeled. The dif-ference between these two velocity distributions indicates the presence of matter that is not accounted for by the galactic model or that gravity does not behave as expected [3]. . . . . 23
1-2 Rotation velocity (in km/s) versus distance from center of galaxy (in arcsec). Measured galactic rotation curves of NGC 1560 fit with max-imum contributions from the gas component (dotted line), from the stellar disk (dashed line), and from the dark halo (dash-dotted line). [11] 24
1-3 An x-ray photograph of the bullet cluster, taken by the Chandra X-Ray
Observatory [38]. . . . . 25
1-4 The energy density of dark energy, atoms, and dark matter, measured
by W M AP [46]. . . . .
27
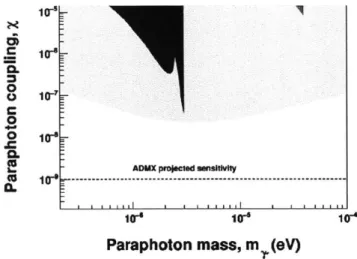
1-5 Paraphton coupling constant versus mas (in eV). Excluded regions of
paraphoton (e.g. axion) kinetic coupling and mass parameter space. The dark region is the most recent limits placed by ADMX. The light gray shading is the limits placed by an earlier microwave cavity exper-iment, and the light shading comes from deviations from Coulomb's law [13]. . . . . 33
1-6 Differential rate of WIMP interactions per recoil energy (in kg-'days-1keV-1) versus recoil energy (in keV) for 100 GeV WIMPs scattering in a liq-uid argon detector with a cross section of 1 x 10-44 cm2. Scaling the
y-axis by the total exposure during an experiment (in kilogram-days) and integrating over the recoil energy region of interest gives the total number of recoil events that the experiment is expected to detect. . . 35
1-7 The current WIMP-nucleon cross section versus WIMP mass as placed by CDMS in [26]. TOP: These curves all demarcate the minimum
spin-independent cross sections that WIMPs can have at each given mass. The dark solid line shows the results found from CDMS II, the dashed line shows the results from a low-threshold analysis of CDMS
II shallow-site data, the dash-dotted curve shows the CDMS II results with a 10 keV threshold, the + and L denote the results published by
XENON100 with, respectively, constant and decreasing scintillation
ef-ficiencies at low energies, the light shaded region is a region of possible signal found by CoGeNT, and the dark shaded region is a similar re-gion found by DAMA/LIBRA; the hashed rere-gion is a combined fit to the results of CoGeNT and DAMA/LIBRA. BOTTOM: These curves show the spin dependent limits from the same data, with the solid line showing the results of the data from CDMS II, the dash-dotted line shows the CDMS II results with a 10 keV threshold, the A are the results from XENON10, the
0
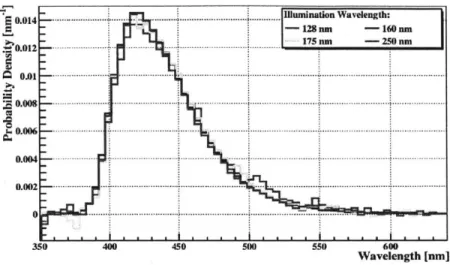
are the results from CRESST, and the shaded region is the 99.7% confidence level region of neutron-only scattering found by DAMA/LIBRA. [26] . . . . 371-8 Probability density (in nm-1) versus wavelength (in nm). This graph
shows the visible re-emission spectra for extreme ultraviolet photons of four different frequencies incident on TPB, normalized to unit area.
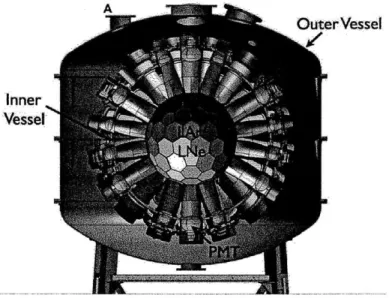
1-9 A drawing of MiniCLEAN, generated by James Nikkel for the August 2009 SNOLAB workshop. The calibration tube (not shown) enters the
outer vessel at the port labeled A. . . . . 42
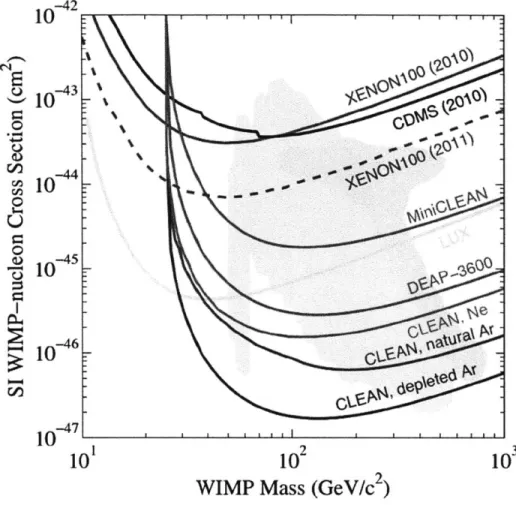
1-10 Measured and projected sensitivity curves for several different dark
matter experiments.. . . . . 43
2-1 A cross section picture of MiniCLEAN. The water tank, muon veto photomultiplier tubes, inner and outer vessels, photomultiplier tubes, calibration tube, and stands are shown. The long (3.54 m) cylinder (in red) that enters the outer vessel on the top right is the calibration tube that the neutron source will be deployed down. . . . . 46
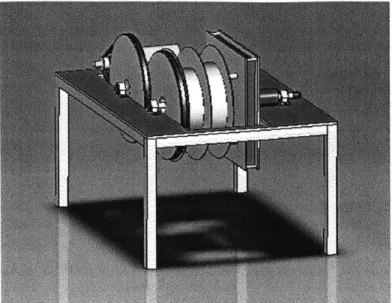
2-2 A CAD drawing of the winch on its stand. . . . . 47
2-3 A photograph of the winch in its stand, connected to the computer and
ready for operation. Wooden panels were added to lower the canister from an arm rather than its usual position directly below the front of the winch. These panels were added to facilitate indoor testing over short distances. . . . . 48
2-4 The buildup of slack between the umbilical cables (labeled wires) and load-bearing steel cable as the winch spins. The distances shown on this graph go far beyond the expected deployment distances so that the overall effects can be seen more clearly; however, signficant slack builds up by the time the canister has been deployed the 15 feet that we expect to deploy it. This buildup was made assuming the idealized conditions of a perfectly clean wrapping of the cables, where none of the cables wrap on top of each other and they unwind smoothly as the canister is lowered. . . . . 49
2-5 A diagram depicting a three phase motor. In the center of the motor
is a magnet surrounded by three pairs of coils. Each pair of coils has a current running through it at a different phase, such that each pair creates a magnetic field that rotates the central magnet towards those coils at different times. The net effect of all three pairs of coils magnetizing out of phase is that the central magnetic is constantly being rotated between the pairs of coils, causing the motor to spin quickly and reliably. . . . . 50
2-6 Diagram depicting the circuitry of the winch motor control system.
The cyan boxes are 24V relays. . . . . 51
2-7 A photograph of the control circuit. Circled in red are the relays.
Circled in blue is the 60pF capacitor. . . . . 52
2-8 Circuit and relay configuration to raise the canister . . . . 53
2-9 Circuit and relay configuration to lower the canister . . . . 54
2-10 Yo-yo potentiometer output voltage (in Volts) versus cable extension (in feet). The yo-yo potentiometer calibration was done over twelve feet. The blue line is the calibration curve taken by measurements in August 2010, and the green line is the calibration curve taken by mea-surements in November 2010. The slope and y-intersect of this curve was used to determine absolute distances from the voltage measure-ments. The values for the fit parameters are given in table 2.1. . . .. 55
2-11 Distance measured by the yo-yo potentiometer (in feet) versus time (in seconds). Three different 90 second test runs in which the canister was lowered and then raised back up while the yo-yo potentiometer measured the distance 40 times every second. The results were so repeatable that only the results of one run are visible on the graph. . 56
2-12 Deviation from the mean (in feet) versus time (in seconds). These graphs show the residuals from the mean of the three different 90 sec-ond measurement runs as the yo-yo pot measured the canister position 40 times every second as the canister was lowered and then raised back up. Test runs 3 had an RMS deviation of 0.0032 feet. Test runs 4 and
5 had an RMS deviation of 0.0031 feet. . . . . 57
2-13 The deployment stand lifted several feet in the air during the
deploy-ment tests in the high bay. . . . . 58
2-14 The displacement of the canister was hand-measured by tying a piece of string to the top of the canister, feeding it through a loop that was fixed to the ground, and then measuring the change in length of the string along the ground as the canister moved. . . . . 58
2-15 This shows the raw data measured during the tall test. Here, the
displacement that the winch was told to reach is compared to the actual displacement, so the red and green points are shown as the canister was being raised and are therefore in reverse order. Note that these are displacements from the zero position, which is fully raised,
so higher numbers imply that the canister is closer to the ground. . . 59
2-16 This plot shows that the yo-yo potentiometer measurements were all
very close to each other and consistently near the six inch displacements that the winch was told to make. There was much more variation in the measurements taken by hand, however, since there are more measurement errors limiting the precision of the hand measurements that used the string, all of these points were still within the acceptable half centimeter error bounds . . . . 59
2-17 Histogram showing how far computer measured displacements and
string measure displacements deviated from the specified displacements. The computer measurements show a Gaussian-shaped distribution with a mean value of 0.014 cm and RMS of 0.055 cm, while the string mea-surements appear to be much more crudely spread with a general trend towards over-measuring. The string measurements have a mean value of 0.173 cm and an RMS of 0.321 cm. . . . . 60 2-18 Histogram showing the same computer measurements as were shown
in figure 2-17, zoomed in to better see the shape. . . . . 60 2-19 The computer measurements plotted against the hand measurements
yielded a straight line with slope of 0.977±0.0088 and a y-intercept of
0, showing that the calibration reflected the actual measurements very
well and that the winch controller is well-calibrated. . . . . 61
3-1 A drawing of the Schlumberger compact neutron source that we will
use for calibration[2] . . . . 64
3-2 A diagram of the canister's top cap. Measurements are in inches. . . 65
3-3 (Left) The top cap of the canister screwed into the middle section
attached to the winch with the HV feedthrough installed. (Right) The top cap with the HV feedthrough inserted, attached to the winch. . . 66
3-4 A diagram of the middle section of the canister. On the left side of the middle section is the acrylic holder; to the right of the holder is the d-d source. During operation, the d-d source will rest on the part of the holder labeled A. The d-d source is not shown resting on the holder in this picture in order to keep each part separate. . . . . 67 3-5 A diagram of the acrylic neutron source holder that goes inside of the
middle section. Measurements are in inches. . . . . 67 3-6 A photograph of the holder with the d-d source resting on the stand,
as it would be inside of the canister . . . . 68
3-8 (Left) A photograph of the bottom cap with the PAVE feedthrough
inserted. (Right) A photograph of the PAVE feedthrough. . . . . 69
3-9 A drawing of a cross section of the d-d source test stand with
rele-vant thermodynamic variables labeled. Within each medium, h is the convection coefficient and k is the conduction coefficient. . . . . 70
3-10 A cross section drawing of the d-d source surrounded by the dielectric
gel inside the steel canister in the calibration tube surrounded by water. ro = 0.55 inches, r1 = 1.078 inches, r2 = 1.191 inches, r3 = 1.334
inches, and r4 - 1.490 inches. . . . . 73
4-1 Graph from [39] showing the muon intensity at various sites of inter-est to dark matter and neutrino experiments. Fitted to the data is equation 4.1 . . . . 76
4-2 Graph from [39] showing the muon-induced neutron flux measured at several sites with equation 4.3 fit to the data. The error bars on the points come from the uncertainty of the measurements of the muon and neutron flux at each location. . . . . 78
4-3 Graph from [39], showing neutron energy spectrum for fast neutrons produced by muon-induced interactions and (ae,n) interactions in rock. This graph shows the neutron yields of both types of radiation with and without shielding and shows that the (a,n) neutron flux with a rock cavern boundary in the energy range of interest - around 0.1 MeV - is approximately three orders of magnitude greater than the muon induced neutron flux. . . . . 79
4-4 Neutron flux (in Mev-1 pm-1g-1year-1) versus neutron kinetic energy
(in MeV). The (a,n) neutron energy spectrum in argon, calculated by
4-5 Number of neutron scatters per year versus recoil energy (in keVee). This graph shows the energy distributions for neutrons that interacted within the fiducial radius for the MiniCLEAN geometry with no cal-ibration tube. The simulation showed a total of 0.0638 scatters per year between 20-100 keVee. . . . . 81
4-6 Number of neutron scatters per year versus recoil energy (in keVee). This graph shows the energy distributions for neutrons that interacted within the fiducial radius for the MiniCLEAN geometry with the cal-ibration tube. The simulation showed a total of 0.0676 scatters per year between 20-100 keVee. . . . . 82
4-7 A simple drawing of the inside of MiniCLEAN with the full calibra-tion system installed. Note that the line separating the two halves of calibration tube is an artifact marking where the tube intersects the outer vessel and is not actually a hole in the geometry. . . . . 83
4-8 Fraction of total neutron reactions versus distance of closest approach (in cm). The spatial distribution of neutron interactions as they passed from the d-d source to the center of the detector for the standard geometry. The histogram bins how many interactions occurred at each distance from the center of the detector. Features on the histogram are labeled with which parts of the detector they occur at, including the outer vessel wall, the photomultiplier tubes, the wavelength shifter, and the fiducial volume. Note that the unlabeled regions between the photomultiplier tubes and fiducial volume are all filled with liquid argon. 84
4-9 Fraction of neutron interactions within fiducial volume versus recoil energy (in keVee). The normalized neutron deposition energy distri-bution within the fiducial volume for the standard geometry with no calibration system . . . . 85
4-10 Fraction of total neutron reactions versus distance of closest approach (in cm). The spatial distribution of neutron interactions as they passed from the d-d source to the center of the detector. The histogram bins how many interactions occurred at each distance from the center of the detector for the standard calibration geometry with an added tube. Features on the histogram are labeled with which parts of the detector they occur at, including the outer vessel wall, the calibration tube, the photomultiplier tubes, the acrylic shields, the wavelength shifters, and the fiducial volume. Note that the unlabeled regions between the photomultiplier tubes and fiducial volume are all filled with liquid argon. 86 4-11 Fraction of neutron interactions within fiducial volume versus recoil
energy (in keVee). The normalized deposited energy distribution from neutron interactions within the fiducial volume for the standard geom-etry with the calibration tube. . . . . 87
4-12 The spatial distribution of neutron interactions as they passed from the
d-d source to the center of the detector. The histogram bins how many
interactions occurred at each radius for the full calibration geometry. Features on the histogram are labeled with which parts of the detector they occur at, including the outer vessel wall, the tube and canister, the photomultiplier tubes, the acrylic shields, the wavelength shifter, and the fiducial volume. Note that the unlabeled regions between the photomultiplier tubes and fiducial volume are all filled with liquid argon. 88 4-13 The normalized deposited energy distribution from neutron
interac-tions within the fiducial volume for the full calibration geometry . . . 89
5-1 The energy spectra for neutron-induced recoils within the fiducial vol-ume for the standard geometry, the full calibration geometry, and the standard geometry with an added calibration tube. All three spectra are within error of each other, showing that the geometries had little effect on the neutron-induced recoil energy spectrum. . . . . 92
List of Tables
1.1 Liquid noble gas dimer lifetimes, from [45] . . . . 38
2.1 Fit parameters for the yo-yo potentiometer calibration data taken in August 2010 and November 2010, shown in figure 2-10. The data for each set was fit with a line of the form Offset + Slope x Distance, where Offset and Slope are the fit parameters. . . . . 51
3.1 Ideal operating specifications for d-d source hardware components. The current and voltage specified for the HV supply controller are the values required to set the supply to output 30 kV[27]. These val-ues are still tentative and the possibility of finding better operation parameters is being investigated. . . . . 65 3.2 Thermal resistances for the d-d source in the test stand. SF6 0 and
SF6 1 are the convective resistances at ro and r1, respectively. .... 71
3.3 Thermal resistances for the d-d source during calibration. Steel 1 is the resistance at innermost steel cylinder, and steel 2 is at the outermost
one. Air 1 and air 2 are the resistances of the air at r2 and r3, respectively. 73
4.1 The proportion of simulated neutron interactions within the region of interest in the fiducial volume (P) and the proportion of simulated neutron interactions within the highest bin of the region of interest in the fiducial volume (P2). . . . . 90
4.2 The number of neutrons that need to be produced to reach 5% counting and energy spectrum measurements and the total amount of time the
d-d source must be on in ord-der to reach this precision, assuming neutrons
Chapter 1
Introduction
Luminous matter, the matter that we see and interact with on a daily basis can be accurately detected in outer space and measured using astrophysical techniques. However, it has been observed through evidence discussed in Section 1.1 that many bodies in the universe behave as if they have more mass than can be observed with the aforementioned techniques. This mass difference is accounted for by models that include dark matter. Dark matter is matter that demonstrates gravitational effects but cannot be detected via electromagnetic interactions. Despite the difficulty of detecting it, current estimates of the dark matter distribution in the universe claim that 83% of the matter density of the universe is made up of dark matter [18], making it far more abundant than any other form of matter that we know of.
The two leading dark matter candidates are WIMPs and axions, discussed in Section 1.2. While it is possible that both of these models are correct and that the dark matter we observe is some mixture of these proposed particles, to determine the nature of dark matter we must first detect it. Then we can begin narrowing models down and determining the mass of different types of dark matter particles so that these previously unobservable forms of matter can finally be understood.
While there are many different experiments currently being developed to search for each of these forms of dark matter, discussed in Section 1.3, this thesis focuses on MiniCLEAN, a dark matter detector searching for WIMPs with masses between
can begin operation, it is important that it be well calibrated in order to achieve the required precision-especially because the probability of a WIMP interactions is so low that it is important to measure whatever events are detected as precisely as possible.
The primary focus of this thesis is the neutron calibration system for MiniCLEAN. Chapter 3.2 discusses the canister that will hold the calibration neutron source, and the source is described in Chapter 3.1. In Chapter 2 we discuss the deployment system; its accuracy and precision at lowering the canister to a specified depth is then discussed in Chapter 2.6. We will then discuss in Chapter 4 simulations of the calibration made in GEANT4 in order to determine how long we must calibrate the detector in order achieve this desired precision.
1.1
Evidence for Dark Matter
Three observations that have necessitated the existence of dark matter come from measurements taken from rotational velocities around spiral galaxies, measurements of the gravitational lensing around the bullet cluster, and measurements taken by the WMAP experiment of the Cosmic Microwave Background. The first observation is that the rotational velocities of spiral galaxy arms do not decrease with distance from the center of the galaxy as the visible luminous matter would predict. This observation is discussed in greater detail in Section 1.1.1. The second observation is that the center of visible mass of the bullet cluster, a pair of colliding galaxy clusters, does not agree with the center of gravitational lensing; this observation is further discussed in Section 1.1.2. The third observation is that the total mass of baryonic and leptonic matter in the universe does not account for the total matter density measured by WMAP; this observation is discussed in Section 1.1.3.
1.1.1
Galactic Rotation Curve
The first definitive evidence for dark matter came from measurements of galactic rotation curves taken by Louise Volders in 1959.
0
0 10 20
30
40Radius (kpc)
Figure 1-1: The measured galactic rotation velocity (in km/s) versus the distance from the center of the galaxy (in kpc) for the NGC 1398 galaxy. The dotted points show the measured velocities and the lines show the gaseous and stellar contributions to this velocity, as labeled. The difference between these two velocity distributions indicates the presence of matter that is not accounted for by the galactic model or that gravity does not behave as expected [3].
Galaxies typically consist of a dense inner sphere of stars around a central black hole and a sparse disk of stars that reach far out from the center of the galaxy. The vast majority of the observable matter in the galaxy appears within the dense inner ball, and so without accounting for dark matter, we can predict how fast the galaxy should be spinning at a distance r from the center by assuming that the entire mass of the galaxy is located in this region. This analysis concludes that within the central ball, the measured orbital velocities should increase linearly with r. Outside this region, the velocities are predicted to drop off as 7L. The total gaseous and stellar contributions to the galactic rotation curve in figure 1-1 shows this expected velocity distribution.
These velocities can be directly measured with the 21cm wavelength line emitted
by spin-flip transitions within hydrogen. Since most of the galaxy is made of hydrogen,
this line can be used to consistently measure the velocity at any distance from the center of the galaxy by considering how much the signal that reaches the earth has been Doppler shifted. Plotting the resulting velocity curve yields the dotted curve in figure 1-1. This curve agrees with the prediction within the central ball, but then
differs drastically from the prediction in the sparse region.
This difference is an indication that the model neglecting dark matter and assum-ing Newtonian gravity is wrong and therefore lends strong evidence supportassum-ing the dominance of dark matter within the galaxy [43]. Assuming a spherically symmetric dark matter halo, de Blok and McGaugh have shown that the observed rotation curve can be explained by a dark matter density distribution given by
p(r) = po + ( (1.1)
Re
where po is the central density of the halo and Rc is the core radius of the halo [43]. Figure 1-2 shows the measured galactic rotation curve of the NGC 1560 galaxy
80
60-~40 20 -
-0
0
200
400
radius (arcsec)
Figure 1-2: Rotation velocity (in km/s) versus distance from center of galaxy (in arc-sec). Measured galactic rotation curves of NGC 1560 fit with maximum contributions from the gas component (dotted line), from the stellar disk (dashed line), and from the dark halo (dash-dotted line). [11]
with the maximal contributions to the rotation curve from gas, the stellar disk, and the dark halo. The latter uses the density given by equation 1.1 and predicts that
1.1.2
Bullet Cluster
1 E 0657-56
Chandra 0.5 Msec image P z0 3
Figure 1-3: An x-ray photograph of the bullet cluster, taken by the Chandra X-Ray
Observatory
138].
The bullet cluster, consisting of two clusters of galaxies that have collided, provides a key piece of evidence suggesting that dark matter rather than a modified theory of gravity is cause of the missing mass discussed in Section 1.1.1. Standard galactic models divide the matter in galaxies into three types: stars, gas, and dark matter (other bodies such as planets are sufficiently small that their masses can be neglected).
Of the two forms of luminous matter, the gas has significantly more mass than the
stars, and so we can effectively track the dynamics of a galaxy by only observing the gas, which is observable by x-ray emissions. Figure 1-3 shows the x-ray measurements of the gases of the two galaxies interacting as they collide and subsequently slow down as they pass through each other [14]. From these images, the center of mass of both galaxies can be determined, considering only the mass that comes from the gas.
The mass of the galaxies can also be determined by measuring gravitational lensing around and through the cluster. Large bodies can have sufficiently strong
gravita-tional fields to bend light significant distances. When this happens, objects that appear behind or near the large body in the night sky may appear to be displaced. This effect is known as gravitational lensing. By measuring the deflection of light around an object, the mass of that object can therefore be determined. When this analysis is applied to the bullet cluster in order to measure its center of mass, the result differs from the center of mass measured by the x-ray image by eight standard deviations. This difference definitively shows that the visible mass cannot account for all of the mass of the clusters, and that an alteration of the gravitational force law cannot explain the observations, necessitating the existence of dark matter. [14]
1.1.3
WMAP
The Wilkinson Microwave Anisotropy Probe (WMAP) measures differences in the Cosmic Microwave Background temperature across the sky; by measuring the slight variations in this background, WMAP can determine the density of dark matter in the universe. WMAP measures many parameters relevant to the ACDM model of the universe-the leading cosmological model, including dark energy and dark matter. From the temperature fluctuations, WMAP determines the current composition of the universe through analysis of the power spectrum of the two-point correlation function. After running for five years, WMAP was able to rule out the possibility of a dominantly hot dark matter model (a model in which dark matter consists of light, relativistic particles) and determine the relative abundances of different forms of matter in the universe. WMAP measured the baryonic closure fraction of the universe-the minimum fraction of the total energy density of the universe required for the universe to be closed-to be Ob = 0.0456±0.0015, the cold dark matter closure
fraction to be Qc = 0.228 ± 0.013, and the dark energy closure fraction to be QA =
0.726 ± 0.015 [18]. The matter content of the universe as measured by WMAP today
Atoms Dark 4.6% Energy Dark 72% Matter 23% TODAY
Figure 1-4: The energy density of dark energy, atoms, and dark matter, measured by WMAP [46].
1.2
Dark Matter Particle Candidates
Despite its abundance, the nature of dark matter particles, other than that they have gravitational interactions, is unknown. However, many models of dark matter based on physical observations and possible extensions to the Standard Model can poten-tially explain observations. The leading models are currently WIMPs and axions, discussed below. This section will also discuss MaCHOs and sterile neutrinos, which are models that may be able to account for part of the observed abundance but not all of it.
1.2.1
WIMPs
WIMPs, or Weakly Interacting Massive Particles, are theoretical particles that
inter-act only via gravitational and weak forces. Since these particles do not interinter-act with electromagnetic fields, they cannot be detected through standard optical means. If WIMPs do interact via the weak force, then they would be detectable through nuclear recoils within a target medium. The interaction cross section scale is 10-" cm2, and
therefore WIMP detectors must have very low background and high precision.
While WIMPs are similar to neutrinos in that they interact only through the gravitational and weak forces, they are predicted to have much higher masses (on the GeV/c 2 scale), and therefore move much more slowly. For this reason, WIMPs consti-tute cold dark matter, i.e. slowly-moving dark matter that forms clumps. Simulations of the evolution of a universe containing only cold dark matter result in clumps of
dark matter that have size and density distributions that agree with those observed in the universe[5]. Such simulations limit hot dark matter, relativistic dark matter, to contributing no more than 10% of the total observed dark matter.
In addition to being a cold dark matter candidate, WIMPs are predicted by most models of supersymmetry. The Standard Model in its currently accepted form does not predict any particles that have the properties that are expected of WIMPs. How-ever, all supersymmetric extensions to the Standard Model require a lightest super-symmetric particle (LSP), which by conservation of R-parityl must be stable. Addi-tionally, most supersymmetric models require that the LSP have a mass on the GeV to TeV scale, be weakly interacting, and not interact with the strong or electromag-netic force, and so the LSP must be a WIMP. Various supersymmetric models predict that WIMPs be either neutralinos, gravitinos, sneutrinos, or a superposition of these
[28]. Since WIMPs are predicted by supersymmetry and would constitute cold dark
matter, they are one of the favored candidates for dark matter.
1.2.2
Axions
The other favored candidate for dark matter is the axion, which is a theoretical particle postulated in order to solve the strong CP problem in the Standard Model. Among the symmetries observed in particle physics, there are charge conjugation, parity, and time symmetries, abbreviated as C,P, and T. C symmetry means that interchanging every particle in a system with its antiparticle would have no observable effect. Similarly, a system that exhibits P symmetry is left unchanged if all of the coordinates change sign, and a system that has T symmetry remains the same if time were to flow in reverse.
Experiments have consistently shown that the strong force and quantum chromo-dynamics obey the combination of C and P symmetries, CP. However, the Standard Model does not provide any explanation for why this is so; in fact, it predicts that there should be some probability that a QCD interaction violate CP symmetry. The
'R-parity is a symmetry expressed in supersymmetric models that forbids supersymmetric par-ticles from becoming Standard Model and vice versa
fact that this CP violation is never observed is known as the strong CP problem, and the axion is a particle that is introduced by Peccei-Quinn theory to solve this problem. The axion carries a field that cancels with the parameter that makes the Standard Model predict CP violation, making the probability of a QCD interaction violating CP symmetry effectively zero [41].
Axions are predicted to have no electric charge and to primarily interact with fermions by converting into two photons with a coupling constant given by gty, =
(1.1 x 10⁻⁴MeVi/2cm3/2) 1o-ev, where m, is the mass of the axion. The mass of
the axion is constrained by cosmological considerations to ma > 10- 5eV and from measurement of the cooling rates of red giants to ma < 10-2eV. Due to this low coupling constant, axions are predicted to interact very little with ordinary matter. This low coupling constant in addition to their expected mass scale makes them prime candidates for cold dark matter.
1.2.3
MaCHOs
MaCHOs, or Massive Compact Halo Objects, are large, non-luminous celestial bodies such as brown dwarfs, black holes, and neutron stars. Since these bodies are made of entirely baryonic matter, their existence would not depend on any extension to the Standard Model, and their large masses would make them possible candidates for cold dark matter.
However, theoretical calculations of the amount of baryonic matter produced in the universe tells us that not enough baryons were produced by the Big Bang to constitute enough MaCHOs to account for the observations that motivate dark matter. While MaCHOs may constitute some amount of the measured cold dark matter in the universe, they cannot explain all of our observations, and other models are still needed to explain what we see [35].
These results were experimentally verified by the EROS collaboration, which used gravitational micro-lensing measurements to look for massive low-luminosity bodies in the galaxy. While this collaboration observed the expected number of brown dwarfs within the galactic plane, they did not find any such bodies in the Magellanic clouds,
thereby ruling out the possibility of the dark matter halo being composed of MaCHOs with masses between 10-7M@ < M < 5MG[40].
The OGLE collaboration verified these results with a similar experiment, looking for micro-lensing in the Large Magellanic Cloud. After collecting data for 10 years,
OGLE only detected three candidate MaCHOs, well below the required event rate
for MaCHOs to explain the dark halo and consistent with EROS. These observations place an upper limit on the contribution of MaCHOs to the total mass of the dark halo of approximately 1.7x 10⁻⁷ [21].
1.2.4
Sterile Neutrinos
Neutrinos are leptons with very little mass that only interact via the weak nuclear force and the gravitational force. All neutrinos that are detected through nuclear reactions are observed to have left-handed chirality. Similarly, all anti-neutrinos that we observe are observed to be right-handed. The sterile neutrino is a hypothetical right-handed neutrino or left-handed anti-neutrino. Since they do not interact with the electromagnetic or strong forces but, due to their small but nonzero mass, would have a gravitational effect, sterile neutrinos are considered to be a candidate for hot dark matter.
However, since hot dark matter particles move with high velocities, they would not be able to account for the clumping in the early universe that lead to galaxy formation, and so other forms of dark matter are also needed to account for our observations.
While sterile neutrinos may exist, Abazajian et. al have shown in [34] that they cannot constitute an appreciable fraction of the total observed dark matter in the universe. By considering the production of sterile neutrinos in the early universe and their oscillation rates with other neutrino flavors, these authors found that the closure fraction of the universe for sterile neutrinos can be given by
where 0 is the mixing angle for the sterile neutrino and m, is the sterile neutrino's mass [34]. Using the recent LSND results indicating the likelihood of a sterile neutrino with mass on the order of 1 eV, the constrains placed on sin2(20) by MiniBooNE,
KARMEN, and NOMAD estimating that sin2(20) be on the order of 3 x 10⁻³[33],
and the WMAP cold dark matter closure fraction ch 2 = 0.1131 ± 0.0034, Q,8h2
0.0009 << Och2 , showing that sterile neutrinos are account for at most .008 of the
observed dark matter.
1.3
Direct Dark Matter Detection
Many detector experiments are currently running or under development in order to directly detect dark matter. Most direct searches use detectors designed to detect dark matter particles passing through them; if dark matter forms a halo around the galaxy as expected, as the earth moves through the galaxy, there should be dark matter "wind" blowing over us. When a dark matter particle passes through a detector, the particle may interact with a nucleus within the detector. After the collision, the nucleus then recoils, and the detector can detect the recoil and determine whether or not it was likely caused by a dark matter interaction.
Since dark matter is so elusive, positively identifying a signal is very hard to do. When an experiment does not manage to do this, however, it can place limits on the probability that the dark matter interacts, so that the parameter space in which these particles might exist can be narrowed down. Detectors that strive to positively identify dark matter need much higher sensitivity and lower background than those that place limits.
The standard method of placing limits on a data set is to assume that all of the measured events are background and to determine the probability that a dark matter particle with a given set of properties would not be detected within the range of values that the detector was sensitive to, given the number of background events and the model being tested. Most limit setting techniques place a limit on the interaction cross section for a given dark matter particle mass.
1.3.1
Axion Searches and ADMX
Experiments like ADMX (Axion Dark Matter eXperiment) search for axions deflect-ing photons in a strong magnetic field. In sufficiently strong magnetic fields, there is a nonzero probably that an axion will turn into a photon. ADMX uses an array of very high-sensitivity and low background SQUIDs (Superconducting Quantum Inter-ference Devices) that amplify the radio-frequency power associated with this photon in order to detect axions.
The kinetic behavior of axions is described by the Standard Model Lagrangian modified to account for interactions with the "hidden sector" of particles that are not easily detectable:
1 1 1 12
L = -FM"FyL, - IB'"Bi, -4 V 4 2 x XF1" B11 + 1m 2(132B By~ (1.3)
Here, F"" is the electromagnetic field strength tensor, B"" is the hidden sector field strength tensor, X is the kinetic coupling-a parameter that controls the probability of an axion turning into a photon-rm is the mass of the axion, and B" is the hidden sector vector potential of the axion.
In November 2010, ADMX published a limit on axions excluding vector bosons with kinetic couplings X > 3.48 x 10⁻⁸ for masses less than 3peV/c2[13]. Figure 1-5
shows experimental limits on these parameters.
1.3.2
WIMP Searches
Since WIMPs are predicted to interact via the weak force, they can be detected through low-probability collisions with target nuclei. Using noble liquids as a detec-tion medium has become a popular paradigm among many current detectors, such as
LUX, XENON100, and MiniCLEAN. However, other methods of detection are also
explored by groups such as CDMS and DM-TPC.
Figure 1-10 summarizes results from several experiments that have placed limits on the WIMP cross section versus mass distribution, as well as limits that are projected to be set by several future experiments.
0 o.iO 0
0-.
- ADMX prooeted senstty
10-a 10-* 10-*
Paraphoton mass, m (eV)
Figure 1-5: Paraphton coupling constant versus mas (in eV). Excluded regions of paraphoton (e.g. axion) kinetic coupling and mass parameter space. The dark region is the most recent limits placed by ADMX. The light gray shading is the limits placed by an earlier microwave cavity experiment, and the light shading comes from deviations from Coulomb's law [13].
1.3.3
Event Rates
The rate at which the detector should measure WIMP scattering events depends on the flux of the dark matter passing through the detector, the probability of a given WIMP interacting with a target nucleus in the detector as it passes through, and the efficiency of the equipment for actually measuring an interaction when it occurs. Assuming 100% equipment efficiency, the differential rate per unit mass of WIMPs interacting is given by
dR(vE, vesc) 11/2 VO[f( Vmin + VE - Vmin - VE RO _U/UO
= kA er -erf e #c
dEr Eor 4 vE [0 V0 Eor
(1.4)
k is a normalization constant, normalizing the number of WIMPs for their velocity,
given by
k = v -erif 2 ve eac (1.5)
ver
)
,1/2 0vesc is the escape velocity for the galaxy (i.e. the highest velocity a galactic WIMP
vE ; 244 ± 15 km/s, depending on the time of the year, vmin is the velocity of the dark matter particle with the minimum energy to produce a recoil with energy E,.
Vmin is given by
E.1/2
Vmin = / Vo (1.6)
Eor
vo is the average dark matter velocity corresponding to average dark matter energy
E0, r is a kinematic factor and is given by
4MDMT
(MD + MT)2 (17)
where MD is the WIMP mass and MT is the target nucleus mass. RO is interaction rate at zero momentum transfer, given by
Ro ( 1GeV/c2 PD VO
- 6 1pb p )0.4GeVe2cm-3 230km/s
where p is the reduced mass of the WIMP and the target nucleus, PD is the density of the dark matter, between 0.3 GeVe- 2cm-3 and 0.7 GeVc-2cm-3, with a
gener-ally accepted value of 0.4 GeVc-2cm-3, and o is the zero momentum transfer cross section. This is related to the energy dependent cross section L- by
o- = F(q)2o.9 (1.9)
where F(q) is the nuclear form factor for a recoil momentum q. The form factor describes the nuclear physics associated with how the dark matter particle will scatter off of a nucleus rather than just one nucleon. For spin-independent interactions, the form factor is given by,
F(q) = 3j1qrn e_(q,)2/2 (1.10)
gr.
where rn is the radius of the target nucleus (rn ~ 1. 14A'/ 3 fm),
ji
(X) is the first order Bessel function, and s is the nuclear skin thickness (s ~ 0.9).Count-Energy Relationship for a = 1a-44 c 2 and m=100 GeV 0.03 CU 0.02 I1-0 0.01 0 50 100 150 200 Energy [keV]
Figure 1-6: Differential rate of WIMP interactions per recoil energy (in kg-'days-'keV-1) versus recoil energy (in keV) for 100 GeV WIMPs scattering in
a liquid argon detector with a cross section of 1 x 10-" cm2. Scaling the y-axis by the total exposure during an experiment (in kilogram-days) and integrating over
the recoil energy region of interest gives the total number of recoil events that the experiment is expected to detect.
interaction and obeys
(
2
where gD and gN are the coupling strengths of the WIMPs and the target nuclei,
respectively, and ME is the mass of exchange particle moderating the interaction. Since gN is proportional to A, the mass number of the target nucleus, we find that
o- oc A2, and therefore that the zero momentum transfer cross section per unit mass
and rate per unit mass are both proportional to A2. Since A is a property of the target
nucleus and is not an interesting part of the dark matter physics, we normalize the results of our experiment by giving the per nucleon rates and cross sections by dividing the measured quantities by A2 so that they can be compared to other experiments
[37].
The differential interaction rate as described in [37] for a 100 GeV WIMP inter-acting in a liquid argon detector with cross section 1 x 10-" cm2 is shown in figure
1-6. This graph shows the shape of the recoil energy deposition distribution that
Germanium Bolometer Detectors
Experiments such as CDMS, CRESST, Edelweiss, and CoGeNT use germanium bolometer detectors to detect WIMP interactions. These detectors measure ionization caused by the WIMP-nucleon interactions and compare the amount of ionization to the amount of vibrations produced by the interaction in order to distinguish nuclear recoil signals from background..
Figure 1-7 shows the limits published by CDMS II for the WIMP mass versus WIMP-nucleon cross section [26]. CDMS is currently the leading germanium bolome-ter experiment in bolome-terms of dark matbolome-ter sensitivity.
Other Detection Methods
The DAMA/LIBRA (Large sodium Iodide Bulk for RAre processes) experiment uses
250 kg of Nal crystals surrounded by photomultiplier tubes to detect WIMP
inter-actions. When a nuclear recoil occurs within the detector, a burst of photons is produced that is detected by the photomultiplier tubes. While these signals can come from WIMPs or from background sources, DAMA/LIBRA looks for long term signal modulation to differentiate between these two types of signals [23]. Since the Earth is moving around the sun, the velocity of the Earth with respect to the dark halo changes over the course of a year. This means that the dark wind (and therefore the incident WIMP flux) changes periodically as well. By collecting data for several years and recording the signal strength over time, they were able to detect an annual modulations with recoil energies from 2-6 keV with modulation depth of 2%, differing from the null hypothesis of no modulation by 8.2o- [22]. The possible allowed regions of dark matter parameter space from this experiment are shown in figure 1-7.
DM-TPC, the Dark Matter Time Projection Chamber is a direction-sensitive de-tector being developed that uses gaseous CF4 as a detection medium. Although using
gas decreases the total target mass, DM-TPC's ability to measure the tracks of inci-dent WIMPs makes it able to substantially reduce the number of background events
direction in which we expect the dark matter wind to be flowing over the earth [20].
8
WIMP mass (GeV/c)
Figure 1-7: The current WIMP-nucleon cross section versus WIMP mass as placed
by CDMS in [26]. TOP: These curves all demarcate the minimum spin-independent
cross sections that WIMPs can have at each given mass. The dark solid line shows the results found from CDMS II, the dashed line shows the results from a low-threshold analysis of CDMS II shallow-site data, the dash-dotted curve shows the
CDMS II results with a 10 keV threshold, the + and E denote the results published by XENON100 with, respectively, constant and decreasing scintillation efficiencies at
low energies, the light shaded region is a region of possible signal found by CoGeNT, and the dark shaded region is a similar region found by DAMA/LIBRA; the hashed region is a combined fit to the results of CoGeNT and DAMA/LIBRA. BOTTOM: These curves show the spin dependent limits from the same data, with the solid line showing the results of the data from CDMS II, the dash-dotted line shows the CDMS II results with a 10 keV threshold, the A are the results from XENON10, the
0
are the results from CRESST, and the shaded region is the 99.7% confidence level region of neutron-only scattering found by DAMA/LIBRA. [26]Liquid Noble Gas Detectors
Liquid noble gas detectors currently have the leading dark matter sensitivity, as shown
by the XENON100 results in figure 1-7. Because noble gases have very few chemical
media. Additionally, separation processes can be used to clean noble gases down to very low radioactivities, lowering the detectors' background rates and improving their sensitivities [4].
One of the biggest advantages of noble liquid detectors, is their ability to dis-tinguish between background electronic recoils and nuclear recoils, the type of recoil we expect to see from signal WIMP interactions. When a particle collides with a noble liquid atom, the atom recoils and is ionized if the projectile energy is above the ionization energy of the atom. This initial ionization releases light that can be detected by photomultiplier tubes. When the ion collides with another atom, they briefly bond together, forming a dimer. However, since noble gases are most stable when not chemically bound to any other atoms, the dimer will eventually split apart, releasing light that can be also be detected.
When the dimer forms, the two atoms may bind together to form either a triplet or singlet state. The triplet has a significantly longer lifetime than the singlet state (lifetimes for both states for a few liquid noble gases are listed in table 1.1), so the decay of the triplet states can be easily differentiated from the decay of the singlet states by the time distribution of the detected scintillation light. Nuclear recoils have higher energy densities and produce more interactions that destroy the triplet state, and so nuclear recoils will be distinguished by a higher prompt light fraction [45]. This way of differentiating between nuclear and electronic recoils is called pulse shape discrimination.
Target Nucleus Singlet Lifetime (ns) Triplet Lifetime (ns)
Ne < 18.2 ± 0.2 14900±300
Ar 7.0±1.0 1600±100
Xe 4.3±0.6 22.0±2.0
Table 1.1: Liquid noble gas dimer lifetimes, from [45]
It has been experimentally shown in [4] that this pulse shape discrimination has a background rejection power of 108, and can be used for liquid argon detectors to achieve a minimum WIMP-nucleon cross section of 10-4 cm2 for 100 GeV/c 2 WIMPs
scaled up to the tonne scale, then a sensitivity of 10-46cm2 can be achieved.
Different liquid noble gas detectors under development use different elements pri-marily because of their nuclear properties. The interaction cross section for a given nucleus is proportional to the nuclear mass squared, meaning that heavier nuclei are expected to have significantly higher event rates than lower nuclei. However, lighter nuclei pick up more momentum in a collision, resulting in higher energy nuclear recoils which can be easier to detect, and so produce more light in an interaction. Other factors that go into choosing a detector medium include the price of the medium, as it may be more feasible to scale a detector with a cheaper medium up to the tonne scale than with a more expensive medium, and the intrinsic radioactivity of the medium.
LUX (Large Underground Xenon detector) and XENON100 are both liquid xenon
detectors that will use this pulse shape discrimination to eliminate noise from elec-tronic recoils. In 2007, XENON10, the predecessor to XENON100 placed a 90% confidence level upper bound on the WIMP-nucleon cross section at 8.8 x 10- 4cm 2
for a WIMP of mass 100 GeV/c2 and 4.5 x 10⁻⁴ cm2 for a WIMP of mass 30 GeV/c2
[19]. XENON100 has recently published an even stronger limit, excluding WIMPs
with cross sections above 7 x 10-*cm2 for WIMPs with mass 50 GeV/c2 [16].
The DEAP/CLEAN Collaboration is currently working on two lines of liquid argon detectors: the DEAP (Dark matter Experiment using Argon Pulse-shape dis-crimination) series and the CLEAN (Cryogenic Low-Energy Astrophysics with Noble gases) series. The DEAP detectors all use liquid argon as a detection medium, while the CLEAN detectors can use liquid argon or liquid neon. Both detectors are cur-rently on their second generations: DEAP-3600 and MiniCLEAN, the latter of which will be the focus of this thesis. Further details of the MiniCLEAN detector will be discussed later in Section 1.4.
MicroCLEAN, the prototype to MiniCLEAN, was a 3.14 kg detector that used liquid argon and liquid neon. It measured the effectiveness of pulse shape discrimi-nation for differentiating between nuclear and electronic recoils in these media, and measured the nuclear recoil scintillation efficiencies within these materials.
argon at 41.5 keV of 8.2%[25]. After confirming that the design had adequate energy resolution, the collaboration began designing MiniCLEAN, the following generation,
150 kg fiducial volume, detector.
1.4
MiniCLEAN
MiniCLEAN is a WIMP detector being developed by the DEAP/CLEAN collab-oration. MiniCLEAN is now under constructoin at SNOLAB (Sudbury Neutrino Observatory Laboratory) and will be completed by early 2012. A drawing of
Mini-CLEAN is shown in figure 1-9. MiniMini-CLEAN consists of an inner vessel containing
either liquid argon or liquid neon surrounded by 92 photomultiplier tubes. The inner vessel rests inside of an outer vessel which rests in the center of a water tank.
The purpose of the outermost water tank is to block incoming radiation from external sources. The inner vessel of MiniCLEAN contains 500 kg of liquid argon or 430 kg of liquid neon, while the fiducial volume is restricted to 150 kg. The fiducial volume radius is 29.5 cm, outside is a neutron-absorbing region that extends to a radius of 44 cm. A 10 cm layer acrylic surrounds this volume to increase the neutron absorption, and the photomultiplier tubes are at a radius of 73.5 cm. Only events that occur within the fiducial volume will be considered candidates for WIMP interactions. The much greater volume of argon or neon and acrylic that surrounds this volume will shield the fiducial volume from most of the incident background neutrons and a particles. Simulations, as will be discussed in Chapter 4, show that this blocking method, not including the water tank, only allows 0.5% of the total incident neutrons to interact in the fiducial volume.
When a WIMP interacts with a nucleus inside the detection medium, ultraviolet light with wavelength between 60 and 200 nm is released. This light passes through a sphere coated in tetraphenyl butadiene (TPB), a wavelength shifter that brings the ultraviolet light into the visible spectrum. The shifted light is detected by the photomultiplier tubes that surround the medium. The TPB produces 882+210 pho-tons per MeV under alpha particle excitation with a double exponential decay with
![Figure 1-3: An x-ray photograph of the bullet cluster, taken by the Chandra X-Ray Observatory 138].](https://thumb-eu.123doks.com/thumbv2/123doknet/14723052.570949/25.918.189.711.156.562/figure-photograph-bullet-cluster-taken-chandra-ray-observatory.webp)
![Figure 1-7: The current WIMP-nucleon cross section versus WIMP mass as placed by CDMS in [26]](https://thumb-eu.123doks.com/thumbv2/123doknet/14723052.570949/37.918.259.643.154.535/figure-current-wimp-nucleon-cross-section-versus-placed.webp)