Development of a cell flux model and its application to nitrogen fixers by
Keisuke Inomura
B.S., Kyushu University (2009)
Submitted to the Department of Earth, Atmospheric, and Planetary Science in partial fulfillment of the requirements for the degree of
Doctor of Philosophy at the
MASSACHUSETTS INSTITUTE OF TECHNOLOGY September 2016
C Massachusetts Institute of Technology 2016. All rights reserved.
Signature redacted
A uth o r ... ... ...
Department of Earth, Atmospheric, and Planetary Sciences June 24, 2016
Signature redacted
Certified by .... ... Michael J. Follows Associate professor Thesis SupervisorSignature redacted
Accepted by ... ...Robert D. van der Hilst Schlumberger Professor of Earth and Planetary Sciences Head of Department
MASSAXCHUSETTS INSTITUTE
OF TECHNOLOGY
SEP 19 201
LIBRARIES
Development of a cell flux model and its application to nitrogen fixers
by
Keisuke Inomura
Submitted to the Department of Earth, Atmospheric, and Planetary Science on June 24, 2016, in partial fulfillment of the
requirements for the degree of Doctor of Philosophy
Abstract
Quantifying and modeling the macroscopic ecological and biogeochemical effects of cellular physiology and metabolism is a challenge: most quantitative "systems biology" models are focused at the metabolic and individual scale. In this study, we develop and apply a simplified metabolic model at the individual scale, which we call "the cell flux model", in order to quantify costs and benefits of nitrogen fixers.
In Chapter 2, we develop the cell flux model for heterotrophic nitrogen fixers in order to examine and quantify the direct and indirect energy costs of nitrogen fixation. We have tested the model using data from Azotobacter vinelandii grown in continuous culture. The model indicates that the direct energy cost of nitrogen fixation is relatively small, whereas oxygen management to protect nitrogenase becomes dominant as the oxygen concentration increases.
In Chapter 3, we have adapted the cell flux model of Azotobacter vinelandii to consider the organisms' response to the presence of ammonium in the environment. The model shows that even under high oxygen concentrations and with high ambient concentrations of fixed nitrogen, nitrogen fixation occurs if there is sufficient carbohydrate resource available to fully consume intracellular oxygen.
Most nitrogen fixers in the ocean are photoautotrophic. Thus, in Chapter 4, we extend the cell flux model to resolve phototrophy and use it simulate and study light and nutrient
co-limitation of Synechococcus spp. as observed in published continuous culture studies. In order to capture the observed variations in elemental composition with light and resource availability, we resolve the macromolecular composition of the cells. The highly simplified model is able to simulate key aspects of the laboratory cultures including explicit prediction of the average elemental composition and maximum growth rates under different environmental limitations.
In Chapter 5, we have applied the cell flux model to simulate laboratory studies, and interpreted the ecological costs for the photoautotrophic nitrogen fixer Crocosphaera watsonii. Our model suggests that these organism also utilize multiple oxygen protection strategies, including scavenging oxygen with excess respiration, changing their size, and using extracellular polymeric substances as a barrier to the invasion of oxygen into the cell.
Thesis Supervisor: Michael J. Follows Title: Associate professor
Acknowledgments
The help of many people has contributed to this thesis, and I would like to acknowledge those who have influenced on this thesis. First and foremost, I would like to thank my advisor Michael Follows for his guidance, sharing his brilliant ideas, and knowledge. I also thank him for his continuously encouraging me in research and development of the cell flux model and beyond. I thank my thesis committee members Sallie Chisholm, Stephanie Dutkiewicz, and Mak Saito for their comments and suggestions on this thesis work. Specifically, I thank Sallie Chisholm for her pin-point suggestions on the models, and for encouraging me to study biological sciences, Stephanie Dutkiewicz for her ideas in ecological sciences and global ocean models of ecosystems, and Mak Saito for his ideas in biochemistry and nitrogen fixing organisms.
During the Ph.D. program, I have also spent time discussing the thesis related subjects and here I would like to acknowledge people I have frequently discussed science with. Each discussion has stimulated my scientific brain and quite often those people provided important tips for the thesis work. I thank Jason Bragg, co-author of Chapter 2, for his ideas from a biologist's view point through discussion. I am grateful to Hedy Kling for sharing the
information about Synechococcus spp. I would like to express my gratitude to Joseph Vallino, since discussing with him has made me realize important things; we are expanding knowledge of the natural world, and there are multiple ways to interpret one phenomena. I would like to thank David Talmy for a series of discussion on microbiology and its modeling. Our discussion of previously developed cell-growth models have been helpful to understand what approach people made in the past. I would also like to thank Rogier Braakman for his help and discussion on metabolic pathways, and biochemistry in cells.
In addition, I would like to thank the people who spent time privately teaching me subjects related to the thesis work. First, I would like to thank Yuwei Gu for sharing deep knowledge in both organic and inorganic chemistry, and for answering all my detailed questions. Each interaction with him was fun and enlightening. I thank Tanja Bosak for her help and encouragement in studying microbiology. Also, I would like to show my appreciation to Mark
Sullivan for sharing his ideas in what is happening in the cell from biochemical view point. Eric Stansifer spent a large amount of time sharing his refined programming skills with me, and I am grateful for all his help and ideas. I thank Martin Singh for his being my mentor giving me advice on every aspect of academic life, during the early years of the Ph.D. program. I am thankful to Teachers and TAs for teaching and clarifying my questions in all the classes I took. I would like to thank members of the Writing and Communication Center at MIT for their help in English writing throughout the Ph.D. program.
I also would like to show my appreciation to people who supported my academic life
during the Ph.D. program from various directions. I thank the support staff at the Green Building at MIT who has been great help in various tasks, such as computer maintenance, moving offices, and educational and financial administration. Also, I also thank the staff at the MIT libraries for their help on finding resources and teaching me rules in citation. I thank all my current and previous officemates for their help in creating environments conducive to research and all the people in Mick Follows' group for stimulating discussion and useful feedback during group meeting and beyond. I would also like to thank yoga instructors at Body & Brain for helping me relax and refresh throughout the Ph.D. program. Many good ideas come to me during the yoga classes. I thank my family in Japan for all their support for my academic life.
Finally I thank support for this work from the Japan Student Service Organization and corresponding staff at Kyushu University. I am also grateful for support from the Gordon and
Betty Moore Foundation (GBMF#3778), the Simons Foundation (Simons Collaboration on Ocean Processes and Ecology, Award 329108, Follows).
Contents
Chapter 1 Introduction ... 10
1.1 The cell flux model as a studying tool for cell physiology and function ... 10
1.2 N itrogen fixation in the context of clim ate... 17
1.3 N itrogen fixation in the context of ecosystem s... 17
1.4 W hat controls the rate of nitrogen fixation?... . . . 19
1.5 Oxygen m anagem ent of nitrogen fixers ... 20
1.6 Thesis goals and outline...22
1.7 References...25
Chapter 2 A quantitative analysis of the direct and indirect costs of nitrogen fixation: a m odel based on Azotobacter vinelandii... 30
2.1 Abstract...30
2.2 Introduction...31
2.3 M aterials and M ethods ... 35
2.4 Results and discussion...43
2.5 Broader Context ... 48
2.6 Conclusions...51
2.7 References...52
Supplem entary M aterial ... 55
S2.1 Evaluation of yields ... 55
S2.2 Oxygen diffusion through alginate layer and cost of alginate production...60
S2.3 Other parameterizations... 63
S2.4 Equations and reactions ... 64
S2.5 Nomenclature ... 68
S2.6 References...74
Chapter 3 On microbial nitrogen fixation in the presence of fixed nitrogen ... 76
3.2 Introduction...77
3.3 M odel description...81
3.4 Results and discussion... 85
3.5 Implication for nitrogen fixation under various oxygen-and-ammonium-existing environments...99
3.6 Summ ary and conclusions ... 102
3.7 References...104
Supplem entary M aterial ... 107
3.S1 M odel details: carbohydrate lim iting case ... 107
3.S2 M odel details-am monium lim iting case ... 107
3.S3 M odel details: nitrogen fixing case ... 108
3.S4 Determ ining w hich case to apply ... 110
3.S5 How to optim izef value...111
Chapter 4 A macromolecular model of phytoplankton growth under light and nutrient co-lim itation ... 112
4.1 Abstract...112
4.2 Introduction...113
4.3 M ethods ... 120
4.4 Results and discussions...138
4.5 Summ ary and conclusions ... 149
4.6 References...152
4.7 Supplem entary material: model param eterization...157
4.8 References for Supplem entary M aterial...167
Chapter 5 The cell flux model indicates multiple oxygen management strategies in Crocosphaera watsonii ... 169
5.1 Abstract...169
5.2 Introduction...169
5.3 M ethods: A m etabolic model of Crocosphaera watsonii...172
5.3.2 Param eterizations and A lgorithm s...179
5.4 Results and Discussion: Oxygen management strategies in Crocosphaera...184
5.5 Implication of these oxygen management mechanisms to the ecosystem...194
5.6 Summ ary and conclusions ... 195
5.7 References...195
Supplem entary M aterial ... 199
5.S1 Computation of carbon, nitrogen, and oxygen m etabolism ... 199
5.S2 Computation of iron m etabolism ... 205
5.S3 Param eterization...209
5.S4 Nomenclature ... 213
5.S5 References...218
Chapter 6 Sum m ary and future directions ... 220
6.1 Chapter Sum m ary...221
6.2 Future directions...224
Chapter
1
Introduction
We have developed a macromolecular model of microbial cells (the "cell flux model") in order
to study and connect cellular physiology and ecosystems. In this thesis, we have applied the
model to nitrogen fixers (diazotrophs) to examine the costs and benefits of nitrogen fixation and
their ecological implications. In this chapter, we first motivate the model development, and then
briefly review nitrogen fixation related topics. Then we consider nitrogen fixation in the context
of climate and ecosystems and narrow down to discuss the physiology of nitrogen fixers, more
specifically, their oxygen management strategies. At the end of this chapter, we provide goals
and outline of the thesis.
1.1 The cell flux model as a studying tool for cell physiology and function Cell biologists study how cells function. Biochemists study chemical processes in biological
system. Geneticists study genes. Molecular biologists study molecules in biology. These
disciplines complement each other and have achieved great progress for understanding what is
happening in the cells. Deeper understanding of the cell leads to developing effective drugs, effective production of agricultural products, and many other contributions in human society.
Currently, in biology text books (e.g. Neidhard et al., 1990; Madigan et al., 2000; Kim
and Gadd, 2008; Berg et al., 2010; Lodish et al., 2012) there are schematic depictions of the cell
organelles, chemical processes, biomass synthesis, DNA reproductions, cell divisions, etc.
However, we rarely encounter model diagrams with numbers. How much of each process is
categorized as proteins, carbohydrates, fat, and vitamins. Biochemistry has answered what they can potentially become after they are absorbed into cells. However, the quantity of the each fate has yet to become clear or well represented. For example, we still have questions about how much of fat eaten really becomes fat? Does it mostly become body fat or is most of the fat actually used for energy production or does it become a part of other macromolecules, such as carbohydrate, proteins, or even DNA?
Similar issues hold true in microbiology. A wide range of genes, proteins, lipids, carbohydrates, and organelles, have been studied and the understanding of how they function and where in the cells they exist has been increasing significantly especially since the 2 0th century. However, we still have limited quantitative understanding of the rates of each process, and the fate of acquired nutrients become what, in a given physical and chemical environment. One of the reasons for this limited quantitative understanding is the limited development of the computational models of the whole cell system. To understand biology as a system, recently, computational approaches have been developed and created a new discipline, Systems Biology, the study of biological systems by systematic perturbation (Ideker, et al., 2001). However, this approach is mainly used for understanding detailed functions or metabolic pathways (Kitano, 2002), and faces a challenge in scaling up to the whole cell metabolism in a simple manner. One Systems Biology approach towards expressing the whole cell metabolism is Flux Balance Analysis (FBA) (Kauffman et al., 2003; Palsson, 2005; Schuster and Fell, 2007; Orth et al., 2010). FBA resolves a whole cell metabolic flux network, with a large number of reactions, and obtain a single solution based on the optimization of an objective functions (Kauffman et al., 2003; Orth et al., 2010). In many cases, the single solution is obtained based on maximizing biomass production (e.g. Lee et al., 2007; Orth et al., 2010). However, the assumption that
organisms work to this end does not always apply (Schuster, et al., 2008). Another challenge is
that FBA does not calculate concentration of each molecule since fluxes are solved based on the
steady state and the concentrations of metabolites or enzymes are not resolved. Also, since the
model resolves a large number of reactions, FBA often fails to provide bird's-eye view of the
cell functions, thus intuitive quantitative understanding of the metabolic fluxes may not be
obtained easily. How could we obtain such simple and intuitive quantitative view of the cell and
concentration of each molecule?
We can obtain a hint from earth science. In earth science, the idealized, at the same
time, very intuitive quantitative understanding of ocean basin, atmospheric layers, etc. can often
be obtained through the box model. Figure 1.1 shows one example from Vaughan and Lenton
(2012). While the model is highly idealized, it provides an intuitive view of the carbon cycles on
the earth, not only representing the fluxes, but also it computes the magnitude of each carbon
pool. In appropriate circumstances, such models can be parameterized sufficiently well to
accurately represent sensitivities and observed trends (Figure 1.2). They are then used to predict
future temperature and atmospheric CO2 concentrations under different scenarios (Figure 1.3).
In this thesis, we take the philosophy of this idealized, box-model approach to modeling
the simplified metabolism of a microbial cell. For example, we model the fate of nutrient through
different chemical reactions in the cell. We use multiple boxes to represent cytoplasm,
extracellular environments, and chemical pools, such as the inorganic nutrients and organic
components (Figure 1.4). Each box is connected with other boxes or boundaries with fluxes
(Figure 1.4). The fluxes are parameterized according to known processes where possible.
Similar modeling approaches have been taken in the past (e.g. Geider et al., 1996, 1997,
those models tend to resolve the cellular quotas of each element instead of resolving the quotas of the macro-molecules. Here, we hypothesize that key differences between various functional types of microorganisms can be more faithfully and dynamically captured by a model which accounts for key macromolecular pools, simple metabolic fluxes, uptake of nutrient, cell sizes, and internal biochemical balances.
With the model we develop in this thesis, we will provide the intuitive pictures of metabolic fluxes and the relative sizes of each pool. The model can be used for interpolating the available experimental data, predicting unknown parameters, and simulating the growth of the cells in the laboratory and the ecosystems. In this thesis, we name the model "the cell flux model", and apply the model to study nitrogen fixation and nitrogen fixing organisms.
I
atmosphere
veget ation 550 Soil 1500HI,'
T
:1
596 hiyh-lati tudeH
surface ocean
401 10040 intermediate waters deep ocean I 268301Figure 1.1 Example of a box model from Vaughan and Lenton (2012). In this example, pre-industrial steady state global carbon cycle is computed. Each box shows major carbon
inventories in the earth system with concentration in numbers. Arrows represent carbon fluxes. For the ocean boxes, solid arrows are carbon fluxes due to water flows, and dashed arrows are carbon fluxes due to sinking particles. The figure is from Vaughan and Lenton (2012) with permission. 14
.1
lOW-latitUdOe surface oceani 730 geological storageV1
450-ell,
500
ry
_300
250
1800)
1850)
I90()
I 9K50
2000)
Figure 1.2 Model output of atmospheric CO2 (black) compared to values obtained from ice core data and direct atmospheric measurements (gray). The model is calibrated to represent the ice core data and direct measurements. The figure is from Vaughan and Lenton (2012) with permission.
(a) 4 3 ..,. . . ...
C-0:
1800
2000 2200 2400 2600 2800 3000 yearFigure 1.3 Prediction of temperature change and scenarios with the box model. The figure is from
(b) (Ii ri 700 600 400 200 1800 2000 2200 2400 2600 2800 300( year
atmospheric CO2 concentrations for various Vaughan and Lenton (2012) with permission.
Co2
XIL
- Pyruvate 1 0
NH+
CH
CH
Figure 1.4 Schematic depiction of the cell flux model. Green part represent cytoplasm, and the outer orange layer is cell membrane layers. Black solid arrows represent nutrient uptake, orange arrows represent biosynthesis, red arrows show respiration, and black dashed arrows are energy flow. CH represents carbohydrate.
1.2 Nitrogen fixation in the context of climate
Nitrogen fixation has an indirect but significant impact on climate, since nitrogen fixation is a major source of bio-available nitrogen, and nitrogen and carbon cycles (including C02, the major greenhouse gas) are tightly coupled (Gruber and Galloway, 2008). There are two types of
nitrogen fixation: anthropogenic and natural. Both types of nitrogen fixation have a similar order of magnitude (Gruber and Galloway, 2008), thus, equally important for the ecosystem.
Anthropogenic nitrogen fixation has the largest contribution to the terrestrial ecosystems where synthesized fertilizer is used. However, it has a certain impact in the ocean since 10-30% of nitrogen is discharged into the ocean (Galloway et al., 1995). Natural nitrogen fixation has a large impact on both in the terrestrial and oceanic ecosystems. The nitrogen and carbon cycles are closely coupled as they are tied together in the formation and destruction of living biomass (Gruber and Galloway, 2008). Nitrogen is often the growth limiting factor in the ocean (e.g. Moore et al., 2013), and provides bioavailable nitrogen for cellular carbon fixation. Carbon fixation in turn impacts the abundance of atmospheric C02, a major greenhouse gas which influences climate. Falkowski (1997) argues that a slight change in nitrogen fixation to denitrification ratio can alter atmospheric CO2 concentrations significantly in the timescale of glacial-to-interglacial periods. Thus, in order to predict climate change, it is important to predict the rate of nitrogen fixation accurately, which has been challenging.
1.3 Nitrogen fixation in the context of ecosystems
Nitrogen fixation has important implications for ecosystem functions since all organisms need nitrogen for key macromolecules, such as proteins and nucleic acids. Nitrogen fixation also supplies "new nitrogen" to the system which is passed to other organisms through excretion,
grazing, sharing and symbiosis. In the terrestrial systems, fixed nitrogen is used by plants
influencing the plant growth. In the ocean, nitrogen fixation mainly impacts the microbial
ecology since oceans are much more dominated by micro-organisms than plants (Pomeroy, et al.,
2007).
Depending on the ecosystem, the dominant nitrogen fixers are different. In terrestrial
ecosystems, the dominant type is heterotrophic bacteria (e.g. Cleveland et al., 1999) while in the
ocean, photoautotrophic bacteria (cyanobacteria) are more significant (e.g. Sohm et al., 2011).
The major difference is that heterotrophic bacteria have to obtain organic carbon from external
sources, while cyanobacteria can synthesize organic carbon from inorganic carbon through
photosynthesis. Most of the chapters of this thesis are focused on models of nitrogen fixers,
using laboratory data to inform and constrain simulations, and the models to interpret the data.
Chapter 2, and 3 focus on a heterotrophic nitrogen fixer and Chapter 5 on a photoautotrophic
nitrogen fixer. In order to achieve the latter, we needed to develop a suitable model of
photo-autotrophy, so Chapter 4 is focused exclusively on modeling a non-nitrogen fixing
phytoplankton.
In the ocean, nitrogen fixation is predicted in regions (Moore et al., 2004; Monteiro et
al., 2010, 2011; Ward et al., 2013; Stukel et al., 2014; Dutkiewicz et al., 2014), where Fe/N and
P/N resource supply ratios are high, based on the assumption that nitrogen fixers have low
maximum growth rates. While this simple assumption leads to a general picture of biogeography
of nitrogen fixers, physiological controls on them have yet to become well constrained. In the
next section, we will elaborate on the controls on nitrogen fixation.
1.4 What controls the rate of nitrogen fixation?
The viability and rate of nitrogen fixation is controlled by many factors which can be categorized
on five scales: molecular controls, physiological controls, ecological controls, ecosystem level
constraints, and regional/global level constraints (Vitousek, et al., 2002). Molecular controls
include genetic control, enzyme synthesis, and other detailed cellular mechanisms (Vitousek, et
al., 2002). Physiological controls include whole cell level controls, such as the impact of
intracellular concentration of oxygen or the cellular level of molybdenum on nitrogen fixation
(Vitousek, et al., 2002). Next are the ecological controls, such as colonization, competition,
predation and nutrient availability (Vitousek, et al, 2002). Ecosystem level constraints include
the nutrient inputs to and outputs from the system. Finally, regional/global level constraints are
include patterns of land cover, biome distribution, climate, and nitrogen deposition (Vitousek et
al., 2002).
These controls are highly interactive, influencing each other. For example, increasing
cellular oxygen concentration leads to inactivation of nitrogen fixing enzyme, nitrogenase
(Gallon, 1981; Wang et al., 1985; Poole and Hill, 1997). Also, expressions of different
respiratory enzymes influence the cellular oxygen concentration (Poole and Hill, 1997; Oelze
2000). A high concentration of heterotrophic organisms might lead to depletion of oxygen in the
environment, promoting nitrogen fixation (e.g. Steunou et al., 2008). In addition, nitrogen
fixation contributes the fixed nitrogen input to the ecosystem (e.g. Peoples et al., 1995), which in
turn influences CO2 fixation. Nitrogen fixation, which occurs at the molecular level, may
influence climate on long time scales (e.g. Falkowski, 1997; Broecker and Henderson, 1998).
In a global scale ecosystem models, large scale constraints are relatively well resolved.
intensities, and temperatures (e.g. Monteiro et al., 2010, 2011; Ward et al., 2013; Stukel et al.,
2014; Dutkiewicz et al., 2014). Also, they resolve key ecological controls, such as predation and
nutrient competition. However, the bottom-level controls such as physiology and molecular level
controls have yet to be well constrained and are not represented. For example, growth of the
microorganisms are often expressed as Monod kinetics (Monod, 1949), which connects
environmental nutrient concentration to the growth rate, bypassing the physiology and molecular
scale phenomena (Follows and Dutkiewicz 2011). In order to predict the rate of nitrogen fixation
as a function of any particular environment, it is necessary to incorporate quantitative
descriptions of the physiology and molecular scale controls into the large-scale ecosystem
models.
Among all the physiological and molecular scale controls, in this study, we will
particularly address oxygen management of nitrogen fixers since oxygen directly influences the
nitrogen fixation rate (e.g. Wang et al., 1985) and the cost for oxygen management in terms of
growth efficiency (addressed in Chapter 2 and 3). Despite the importance of oxygen
management, ecosystem models have not yet resolved the underlying mechanisms. In the
following section, we will briefly discuss different oxygen management mechanisms employed
by nitrogen fixers.
1.5 Oxygen management of nitrogen fixers
There are multiple ways to keep the intracellular oxygen concentration low enough for nitrogen
fixation. We explain the oxygen management in detail in Chapter 2, 3 and 5, but here we provide
a brief overview. The simplest form of oxygen management can be represented by the following
[02 I =[02]~ r 2Rc (1.1)
3DO2
where intracellular oxygen concentration [O2]c (mol m-3) is influenced by, [02] (mol M-3), the environmental oxygen concentration, r (in), the cell radius, Rc (mol s-1 m-3), the cellular net
oxygen consumption rate (oxygen consumption rate minus oxygen production rate) per volume (mol s- m-3), and Do2 (Mi 2 s-'), the effective diffusion coefficient for oxygen. Based on the four
parameters on the right hand side of the equation, there are four potential oxygen management strategies; (i) living in low oxygen environment; decreasing [02], (ii) increasing cell size;
increasing r, (iii) increasing respiration/other oxygen consumption; increasing Rc, (iv) decreasing the diffusivity of oxygen; decreasing Do2.
Strategy (i) is employed by multiple types of nitrogen fixers. For example, rhizobium lives in the root of plants where oxygen concentration is limited (e.g. Tjepkema and Yocum,
1974; Tjepkema 1983). Also, in marine sediments, benthic nitrogen fixers can take advantage of the low oxygen environment (e.g. Revsbech et al., 1980; Herbert, 1999). Strategy (ii) can be seen in multiple types of nitrogen fixers as well. For example, Azotobacter vinelandii, soil dwelling heterotrophic bacteria, increase in size under a high oxygen environment (Post et al., 1982). Heterocystous cyanobacteria have specialized cells for nitrogen fixation, and have a larger cells than other non-nitrogen fixers (e.g. Liu and Golden, 2002; Khudyakov and Golden, 2004). Strategy (iii) is well studied in Azotobacter vinelandii. Since they have significantly higher respiration rates than other heterotrophic bacteria, and respiration rate increases with oxygen concentration, it is hypothesized that they increase respiration in order to scavenge oxygen
(Dalton and Postgate, 1969; Poole and Hill, 1997). In addition, it is hypothesized that
Trichodesmium, a filamentous cyanobacterium, use the Mehler reaction for scavenging oxygen
heterocystous cyanobacteria; the heterocysts are specialized nitrogen fixing cells in a colony,
which have an envelope of multiple layers of thick cell wall, regulating passive uptake of oxygen
(e.g. Fay, 1992; Walsby 2007; Nicolaisen et al., 2009). This strategy is also hypothesized in
Azotobacter, which produces extra polymeric substrate, whose composition varies with oxygen
concentration, possibly preventing oxygen diffusion (Sabra et al., 2000). In this study, we will
address strategy (ii)-(iv) since those strategies have been described at the physiological and
cellular scale.
1.6 Thesis goals and outline
The goal of the thesis is to develop the cell flux model, and to investigate the physiological and
cellular controls of nitrogen fixation, and its costs and benefits using the model. In Chapter 2 and
3, we develop the cell flux model for heterotrophic nitrogen fixers. While Chapter 2 addresses
the nitrogen fixers under conditions with no sources of fixed nitrogen, Chapter 3 explores the
nitrogen fixation rates and growth of nitrogen fixers with the presence of ammonium. In Chapter
4, we have developed the cell flux model for phytoplankton and studied light-nutrient
co-limitation of phytoplankton growth. Finally, in Chapter 5, we develop the cell flux model for
photoautotrophic nitrogen fixers and examine their oxygen management. We present the outline
of each chapter as follows.
Chapter 2: A quantitative analysis of the direct and indirect costs of nitrogen fixation
Both heterotrophic and photoautotrophic nitrogen fixers grow more slowly and less efficiently
than non-nitrogen fixers of the same types. What makes the growth of nitrogen fixers inefficient?
fixers, and analyzed direct and indirect costs of nitrogen fixation. We have chosen chemostat culture data of Azotobacter vinelandii (Kuhla and Oelze, 1988) on which to base and calibrate the model, but its implications applies to other nitrogen fixers: both heterotrophic and
autotrophic.
Chapter 3: Maximizing population provides mechanistic explanation of the physiology of nitrogen fixing microbes growing in ammonium present environment
Ammonium and other forms of fixed nitrogen are known to inhibit nitrogen fixation. However, the magnitude of inhibition varies depending on the level of oxygen and availability of
carbohydrate sources. How do ammonium, oxygen and carbohydrate co-limit the rate of nitrogen fixation and population of nitrogen fixers? To address this question, we have adapted the cell flux model developed in Chapter 2 into ammonium existing environment, in particular chemostat culture of Azotobacter vinelandii with ammonium input into the culture (Buhler et al., 1987a, 1987b). With the model, we made a simple assumption that the metabolism of the cell is constrained to maximize biomass concentration. With this assumption, we have predicted nitrogen fixation rate, population and other physiological rates, for various ammonium, oxygen and carbohydrate environments.
Chapter 4: Macromolecular model for studying light-nutrient co-limitation ofphytoplankton growth
The majority of nitrogen fixers in the ocean are phytoplankton. Not only do they contribute to global photosynthesis, they account for a large fraction nitrogen fixation in the world.
ocean ecosystem models use highly idealized methods to predict growth rate without sufficiently
considering the physiology and molecular scale constraints which control this co-limitation.
Resolving such detailed scale in the model is necessary to predict the growth of phytoplankton,
which in turn influence the ecosystem and biogeochemistry in global scale. In this chapter, we
develop a macromolecular scale phytoplankton model "the cell flux model for phytoplankton" to
study light-nutrient co-limitation of phytoplankton. In this model we have considered various
macromolecules which vary differently with light-nutrient availability and growth of
phytoplankton. For the model calibration, we have used the data of Synechococcus sp. Although
this chapter exclusively addresses non-nitrogen fixers, it provides basis for modeling
photoautotrophic nitrogen fixers.
Chapter 5: The cell flux model indicates multiple oxygen management strategies by Crocosphaera watsonii
Nitrogen fixers in the ocean account for about a half of fixed nitrogen input into the ocean
(Gruber and Galloway, 2008), influencing the nitrogen cycle and coupled carbon cycle. A
considerable fraction of nitrogen fixation in the ocean may be done by unicellular nitrogen fixers
(e.g. Zehr et al., 2001; Montoya et al., 2004; Moisander et al., 2010). Thus, understanding the
physiological control of nitrogen fixation by unicellular organisms may contribute to the
prediction of the elemental cycles in the ocean. One of the major unicellular nitrogen fixers is
Crocosphaera watsonii, which fixes nitrogen during the night time in order to avoid
photosynthetically produced oxygen (e.g. Mohr et al., 2010; Saito, et al., 2011; GroBkopf and
LaRoche, 2012). However, even during the night time, the oxygen concentration in the ocean is
2004; Yates et al., 2007). Under such high oxygen concentration, how do Crocosphaera manage
to fix nitrogen? In order to address this question, we have developed the cell flux model for photoautotrophic unicellular nitrogen fixers. The model resolves diurnal cycles of metabolisms and iron movement within the cell (Saito et al., 2011). We hypothesize that Crocosphaera adopt similar oxygen management strategies to that of Azotobacter, and examine each strategy with the model. Our simulations suggest that Crocosphaera does indeed employ analogous strategies.
1.7 References
Berg JM, Tymoczko JL, Stryer L. (2010). Biochemistry, 7th edition. W. H. Freeman and Company: New York.
Berman-Frank I, Lundgren P, Chen Y-B, Kiipper H, Kolber Z, Bergman B, et al. (200 1). Segregation of nitrogen fixation and oxygenic photosynthesis in the marine cyanobacterium
Trichodesmium. Science 294: 1534-1537.
de Boyer Montegut C, Madec G, Fischer AS, Lazar A, Judicone D. (2004). Mixed layer depth over the global ocean: An examination of profile data and a profile-based climatology. J
Geophys Res 109: C12003, doi:10.1029/2004JC002378.
Broecker WS, Henderson GM. (1998). The sequence of events surrounding termination II and their implications for the cause of glacial interglacial CO2 changes. Paleoceanography 13: 352-364.
Cleveland CC, Townsend AR, Schimel DS, Fisher H, Howarth RW, Hedin LO, et al. (1999). Global patterns of terrestrial biological nitrogen (N2) fixation in natural ecosystems. Global
Biogeochem Cycles 13: 623-646.
Dalton H, Postgate JR. (1969). Effect of oxygen on growth of Azotobacter chroococcum in batch and continuous cultures. JGen Microbiol 54: 463-473.
Dutkiewicz S, Ward BA, Scott JR, Follows MJ. (2014). Understanding predicted shifts in diazotroph biogeography using resource competition theory. Biogeosciences Discuss 11: 7113-7149.
Falkowski PG. (1997). Evolution of the nitrogen cycle and its influence on the biological sequestration of CO2 in the ocean. Nature 387: 272-275.
Fay P. (1992). Oxygen relations of nitrogen fixation in cyanobacteria. Microbiol Rev 56: 340-373.
Flynn KJ. (2001). A mechanistic model for describing dynamic multi-nutrient, light, temperature interactions in phytoplankton. JPlankton Res 23: 977-997.
Follows MJ, Dutkiewicz S. (2011). Modeling diverse communities of marine microbes. Ann Rev
Mar Sci 3: 427-451.
Fransson A, Chierici M, Anderson LG. (2004). Diurnal variability in the oceanic carbon dioxide system and oxygen in the Southern Ocean surface water. Deep Res Part II Top Stud Oceanogr
51: 2827-2839.
Gallon JR. (1981). The oxygen sensitivity of nitrogenase: a problem for biochemists and micro-organisms. Trends Biochem Sci 6: 19-23.
Galloway JN, Schlesinger WH, Levy H, Michaels A, Schnoor JL. (1995). Nitrogen fixation:
Anthropogenic enhancement-environmental response. Global Biogeochem Cycles 9: 235-252.
Geider RJ, Macintyre HL, Kana TM. (1996). A dynamic model of photoadaptation in
phytoplankton. Limnol Oceanogr 41: 1-15.
Geider RJ, Macintyre HL, Kana TM. (1998). A dynamic regulatory model of phytoplanktonic acclimation to light, nutrients, and temperature. Limnol Oceanogr 43: 679-694.
Geider RJ, Macintyre HL, Kana TM. (1997). Dynamic model of phytoplankton growth and
acclimation: responses of the balanced growth rate and the chlorophyll a: carbon ratio to light, nutrient-limitation and temperature. Mar Ecol Prog Ser 148: 187-200.
GroBkopf T, LaRoche J. (2012). Direct and indirect costs of dinitrogen fixation in Crocosphaera watsonii WH8501 and possible implications for the nitrogen cycle. Front Microbiol 3: doi:
10.3389/fmicb.2012.00236.
Gruber N, Galloway JN. (2008). An Earth-system perspective of the global nitrogen cycle.
Nature 451: 293-296.
Herbert RA. (1999). Nitrogen cycling in coastal marine ecosystems. FEMS Microbiol Rev 23:
563-590.
Ideker T, Galitski T, Hood L. (2001). A new approach to decoding life: Sytems biology. Annu
Rev Genomics Hum Genet 2: 343-372.
Kana TM. (1992). Oxygen cycling in cyanobacteria with specific reference to oxygen protection in Trichodesmium spp. In: E. J. Carpenter et al. (eds.). Marine Pelagic Cyanobacteria:
Trichodesmium and other diazotrophs. Kluwer Academic publishers. Mar Pelagic Cyanobacteria Trichodesmium other Diazotrophs 29-41.
Kana TM. (1993). Rapid oxygen cycling in Trichodesmium thiebautii. Limnol Oceanogr 38:
18-24.
Kauffman KJ, Prakash P, Edwards JS. (2003). Advances in flux balance analysis. Curr Opin
Biotechnol 14: 491-496.
Khudyakov IY, Golden JW. (2004). Different functions of HetR, a master regulator of heterocyst differentiation in Anabaena sp. PCC 7120, can be separated by mutation. Proc Natl Acad Sci
USA 101: 16040-16045.
Kim GH, Gadd GM. (2008). Bacterial physiology and metabolism. Cambridge University Press: Cambridge.
Kitano H. (2002). Computational systems biology. Nature 420: 206-210.
Kuhla J, Oelze J. (1988). Dependency of growth yield, maintenance and Ks-values on the
dissolved oxygen concentration in continuous cultures of Azotobacter vinelandii. Arch Microbiol 149: 509-514.
Lee TJ, Tu D, Tan CM, You L. (2006). Modeling cellular networks. Bioinformatics: An Engineering Case-Based Approach. G. Alterovitz and M. F. Ramoni, editors. Artech House: Boston. Constr Anal Kenetic Model 151-178.
Liu D, Golden JW. (2002). hetL overexpression stimulates heterocyst formation in Anabaena sp. Starin PCC 7120. JBacteriol 184: 6873-6881.
Lodish H, Berk A, Kaiser CA, Krieger M, Scott MP, Bretscher A, et al. (2012). Molecular Cell Biology. 7th edition. W. H. Freeman: New York.
Madigan MT, Martinko JM, Parker J. (2000). Brock Biology of Microorganisms. 9th edition. Prentice-Hall, inc.: Upper Saddle River, New jersey.
Mohr W, Intermaggio MP, LaRoche J. (2010). Diel rhythm of nitrogen and carbon metabolism in the unicellular, diazotrophic cyanobacterium Crocosphaera watsonii WH8501. Environ
Microbiol 12: 412-421.
Moisander PH, Beinart RA, Hewson I, White AE, Johnson KS, Carlson CA, et al. (2010). Unicellular cyanobacterial distributions broaden the oceanic N2 fixation domain. Science 327: 1512-1514.
Monod J. (1949). The growth of bacterial cultures. Ann Rev Mar Sci 3: 371-394.
Monteiro FM, Dutkiewicz S, Follows MJ. (2011). Biogeographical controls on the marine nitrogen fixers. Global Biogeochem Cycles 25: GB2003, doi:10.1029/2010GB003902.
Monteiro FM, Follows MJ, Dutkiewicz S. (2010). Distribution of diverse nitrogen fixers in the global ocean. Global Biogeochem Cycles 24: GB3017, doi:10.1029/2009GB003731.
Montoya JP, Holl CM, Zehr JP, Hansen A, Villareal TA, Capone DG. (2004). High rates of N2
fixation by unicellular diazotrophs in the oligotrophic Pacific Ocean. Nature 430: 1027-1031. Moore CM, Mills MM, Arrigo KR, Berman-Frank I, Bopp L, Boyd PW, et al. (2013). Processes and patterns of oceanic nutrient limitation. Nat Geosci 6: 701-710.
Moore JK, Doney SC, Lindsay K. (2004). Upper ocean ecosystem dynamics and iron cycling in a global three-dimensional model. Global Biogeochem Cycles 18: 1-21.
Neidhards FC, Ingraham JL, Schaechter M. (1990). Physiology of the Bacterial Cell: a Molecular Approach. Sinauer Associate, Inc.: Sunderland, Massachusetts.
Nicolaisen K, Hahn A, Schleiff E. (2009). The cell wall in heterocyst formation by Anabaena sp. PCC 7120. JBasic Microbiol 49: 5-24.
Oelze J. (2000). Respiratory protection of nitrogenase in Azotobacter species: is a widely held hypothesis unequivocally supported by experimental evidence? FEMS Microbiol Rev 24: 321-333.
245-248.
Pahlow M, Oschlies A. (2009). Chain model of phytoplankton P, N and light colimitation. Mar
Ecol Prog Ser 376: 69-83.
Palsson BO. (2006). Systems Biology: Properties of Reconstructed Networks. Cambridge University Press, New York.
Peoples MB, Herridge DF, Ladha JK. (1995). Biological nitrogenfixation: An efficient source of nitrogen for sustainable agricultural production. Plant Soil 174: 3-28.
Pomeroy LP, Williams PL, Azam WF, Hobbie JE. (2007). The microbial loop. Oceanography 20: 28-33.
Poole RK, Hill S. (1997). Respiratory protection of nitrogenase activity in Azotobacter
vinelandii: Roles of the terminal oxidases. Biosci Rep 17: 303-317.
Post E, Golecki JR, Oelze J. (1982). Morphological and ultrastructural variations in Azotobacter
vinelandli growing in oxygen-controlled continuous culture. Arch Microbiol 133: 75-82.
Revsbech NP, Srensen J, Blackburn TH, Lomholt JP. (1980). Distribution of oxygen in marine sediments measured with microelectrodes. Limnol Oceanogr 25: 403-411.
Robertson JE, Watson AJ, Langdon C, Ling RD, Wood JW. (1993). Diurnal variation in surface pCO2 and 02 at 60'N, 20'W in the North Atlantic. Deep Res Part H 40: 409-422.
Sabra W, Zeng AP, Liinsdorf H, Deckwer WD. (2000). Effect of oxygen on formation and structure of Azotobacter vinelandli alginate and its role in protecting nitrogenase. Appl Environ
Microbiol 66: 4037-4044.
Saito MA, Bertrand EM, Dutkiewicz S, Bulygin VV, Moran DM, Monteiro FM, et al. (2011). Iron conservation by reduction of metalloenzyme inventories in the marine diazotroph
Crocosphaera watsonii. Proc Natl Acad Sci USA 108: 2184-2189.
Schuster S, Fell D. (2007). Modeling and simulating metabolic networks. In: Lengauer, T. (Ed.), Bioinformatics: From Genomes to Therapies. Wiley-VCH: Weinheim. 2: 755-805.
Schuster S, Fell DA, Pfeiffer T. (2008). Is maximization of molar yield in metabolic networks favoured by evolution? J Theor Biol 252: 497-5 04.
Sohm JA, Webb EA, Capone DG. (2011). Emerging patterns of marine nitrogen fixation. Nat
Rev Microbiol 9: 499-508.
Steunou A-S, Jensen SI, Brecht E, Becraft ED, Bateson MM, Kilian 0, et al. (2008). Regulation of nif gene expression and the energetics of N2 fixation over the diel cycle in a hot spring microbial mat. ISME J2: 364-378.
Stukel MR, Coles VJ, Brooks MT, Hood RR. (2014). Top-down, bottom-up and physical controls on diatom-diazotroph assemblage growth in the Amazon River plume. Biogeosciences
11: 3259-3278.
Tjepkema J. (1983). Oxygen concentration within the nitrogen-fixing root nodules of Myrica
gale L. Am JBot 70: 59-63.
nodules byoxygen microelectrodes. Planta (Berl.) 119: 351-360.
Vaughan NE, Lenton TM. (2012). Interactions between reducing CO2 emissions, CO2 removal
and solar radiation management. Philos Trans R Soc A Math Phys Eng Sci 370: 4343-4364. Vitousek PM, Cassman K, Cleveland C. (2002). Towards an ecological understanding of biological nitrogen fixation. Biogeochemistry 57/58: 1-45.
Walsby AE. (2007). Cyanobacterial heterocysts: terminal pores proposed as sites of gas exchange. Trends Microbiol 15: 340-349.
Walsby AE. (1985). The permeability of heterocysts to the gases nitrogen and oxygen. Proc R
Soc B Biol Sci 226: 345-366.
Wang ZC, Burns A, Watt GD. (1985). Complex formation and 02 sensitivity of Azotobacter
vinelandii nitrogenase and its component proteins. Biochemistry 24: 214-221.
Ward BA, Dutkiewicz S, Moore CM, Follows MJ. (2013). Iron, phosphorus, and nitrogen supply ratios define the biogeography of nitrogen fixation. Limnol Oceanogr 58: 2059-2075.
Yates KK, Dufore C, Smiley N, Jackson C, Halley RB. (2007). Diurnal variation of oxygen and carbonate system parameters in Tampa Bay and Florida Bay. Mar Chem 104: 110-124.
Zehr JP, Waterbury JB, Turner PJ, Montoya JP, Omoregie E, Steward GF, et al. (2001). Unicellular cyanobacteria fix N2 in the subtropical North Pacific Ocean. Nature 412: 635-638.
Chapter 2
A quantitative analysis of the direct and indirect costs of
nitrogen fixation: a model based on Azotobacter
vinelandii
The chapter is reproduced from the article "A quantitative analysis of the direct and indirect
costs of nitrogen fixation: a model based on Azotobacter vinelandii" by Inomura K, Bragg J,
Follows MJ, recently accepted to The ISME Journal.
2.1 Abstract
Nitrogen fixation is advantageous in microbial competition when bioavailable nitrogen is scarce,
but has substantial costs for growth rate and growth efficiency. To quantify these costs, we have
developed a model of a nitrogen-fixing bacterium that constrains mass, electron and energy flow
at the scale of the individual. When tested and calibrated with laboratory data for the soil
bacterium Azotobacter vinelandii, the model reveals that the direct energetic cost of nitrogen
fixation is small relative to the cost of managing intra-cellular oxygen. It quantifies the costs and
benefits of several potential oxygen protection mechanisms present in nature including enhanced
respiration (respiratory protection) as well as the production of extra-cellular polymers as a
barrier to 02 diffusion, and increasing cell size. The latter mechanisms lead to higher growth efficiencies relative to respiratory protection alone. This simple, yet mechanistic framework
provides a quantitative model of nitrogen fixation which can be applied in ecological
2.2 Introduction
All organisms need nitrogen for the synthesis of important molecules including nucleic acids and
proteins. Nitrogen pervades the environment in the form of N2 gas, yet it is often a limiting
resource on land and in aquatic environments. Nitrogen fixation provides some marine and
terrestrial prokaryotes with an ecological advantage but is typically associated with low growth
efficiencies and rates (Kuhla and Oelze, 1988a, 1988b; LaRoche and Breitbarth, 2005;
Berman-Frank et al., 2007; Goebel et al., 2007) placing significant constraints on the relative fitness of
nitrogen fixers and their biogeography. Here we address the question of what underpins the low
growth efficiency of nitrogen fixers and develop a quantitative analysis which forms the basis for
trait-based ecological and biogeochemical models.
One contribution to the low growth rate/efficiency of nitrogen fixers is the direct cost of
reducing dinitrogen. Nitrogen fixation is catalyzed by the nitrogenase enzyme, and uses 8
electrons and at least 16 molecules of ATP to reduce each N2 molecule to two molecules of NH3
(Sohm et al., 2011).
N2+ 8e- +8H+ +16ATP +16H20 -+ 2NH 3+ H2 +16ADP +16Pi (2.1)
Although the energetic expense of breaking the dinitrogen triple bond is high this direct
cost may not necessarily be the greatest challenge faced by nitrogen fixing cells. Nitrogenase
consists of an Fe-protein and a Mo-Fe-protein and other metal co-factors whose activity is
decreased upon exposure to oxygen (Gallon, 1981). Thus aerobic nitrogen fixers have developed
numerous strategies to protect nitrogenase from oxygen, particularly in oxygenic phototrophs.
For example, in Anabaena and Nostoc the nitrogen fixing cells also become heterocysts, losing
the ability to fix carbon and building a thick cell coating which is less permeable to oxygen
metabolites between cells, as do nitrogen fixers in symbiotic relationships with other species.
Free living, unicellular aerobic nitrogen fixers use other strategies, including the separation of
oxygenic photosynthesis and nitrogen fixation between day and night (e.g. Col6n-L6pez et al.,
1997; Misra, 1999; Tucker et al., 2001; Berman-Frank et al., 2003; Saito et al., 2011; Grof3kopf
and Laroche, 2012b). Heterotrophic, soil dwelling nitrogen-fixers, such as Azotobacter vinlandii, use elevated rates of respiration to deplete intra-cellular oxygen (Poole and Hill, 1997). They
also produce an extra-cellular polymeric substance that impedes oxygen invasion (Sabra et al.,
2000), and maintain larger cell sizes (Post et al., 1982), which likely also reduces the specific
oxygen invasion rate.
Each of these strategies demands that the organism invest resources in nitrogen fixation
that could otherwise be used for other activities, such as carbon fixation or biosynthesis,
offsetting the ecological advantage of nitrogen fixation. The resulting reduction in growth rate
and/or efficiency is key to understanding the biogeography of nitrogen fixation in the
environment (e.g. Staal et al., 2003; Monteiro et al., 2010; Dutkiewicz et al., 2012). In current
ecological and biogeochemical simulations, this cost is typically empirically imposed (e.g.
Krishnamurthy et al., 2007; Dutkiewicz et al., 2012; Stukel et al., 2013). Here we present a
mechanistic and quantitative approach to modeling the cost of nitrogen fixation and its
associated oxygen management. Though the model represents a generalized approach, we focus
on the heterotrophic, nitrogen-fixing soil bacterium, Azotobacter vinelandii, for which extensive, quantitative laboratory characterizations have been published (e.g. Post et al., 1982, 1983a,
1983b; Kuhla and Oelze, 1988a, 1988b; Allman et al., 1990; Poole and Hill, 1997; Oelze, 2000;
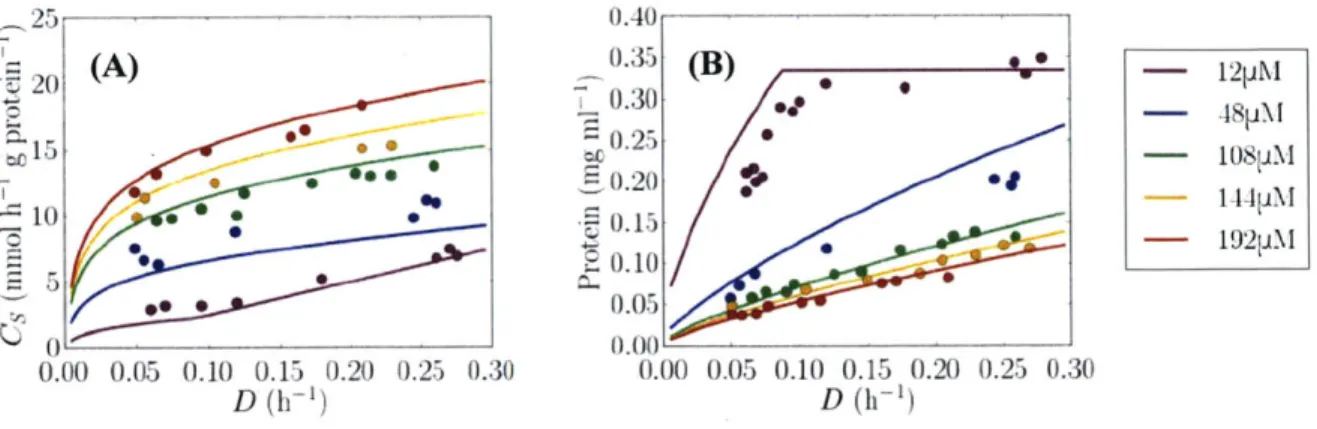
Laboratory cultures of Azotobacter (e.g. Kuhla and Oelze, 1988a, 1988b) have
demonstrated a decrease in growth efficiency at all growth rates as the ambient concentration of oxygen in the medium was increased. This was manifested as an increased carbohydrate cost, which has been interpreted as enhanced energetically uncoupled respiration (exceeding the level required for biosynthesis) (Nagai and Aiba, 1972; Kuhla and Oelze, 1988b) to manage intra-cellular oxygen concentration and maintain functional nitrogenase; hereafter termed 'respiratory protection' (Dalton and Postgate, 1969; Poole and Hill, 1997). This is illustrated in Figure 2.IA (data in circles; lines represent a model discussed later), in which the specific sucrose
consumption rate increased with oxygen concentration. The sensitivity to oxygen manifests largely as a "maintenance" effect, increasing overall carbohydrate consumption (Figure 2.1 A) because the cell must be equally clear of oxygen even at very low growth and nitrogen fixation
rates. Azotobacter encodes and expresses cytochrome bd, which has high oxygen consumption
relative to ATP production (Poole and Hill, 1997). The reduction of growth efficiency with increasing oxygen concentration was also reflected in a lower standing stock of protein (Kuhl and Oelze, 1988b) in Figure 2.1B. At the lowest oxygen concentration (12 pM) there was a sharp change in the slope at a dilution rate of about 0.1 day-1.
A (A)
:7 0.2 **0
10
eS0
00-DI) D (h I'l
Figure 2.1 Continuous cultures of Azotobacter vinelandii with observed data (circles) redrawn fromn Kuhla and Oelze (I1988b). Solid lines are the corresponding simulations from this work. (A) Protein specific sucrose consumption rate, (B) standing stock of protein, all with respect to dilution (and growth) rate, D (x-axis) and oxygen concentration (colored points/lines). The legend indicates oxygen concentration.
However, it was noted that the increase in maintenance carbohydrate consumption and respiration are not linear with oxygen concentration, increasing less rapidly at concentrations above 70 pM (Oelze, 2000) (Figure 2.1A and 2.IB respectively), suggesting other protection mechanisms must also be at play. Azotobacter vinelandii is also observed to increase in cell size in more oxygenated cultures (Post et al., 1982) and to form an external alginate capsule as a barrier to oxygen diffusion, which increases in molecular weight and gluronic acid content with higher oxygen conditions (Sabra et al., 2000).
The thorough characterization of the energetics of Azotobacter vinelandii in the
laboratory (e.g. Post et al., 1982; BUhler, et al., 1987a, 1987b; Kuhla and Oelze, 1988a, 1988b, Oelze 2000) provides an excellent opportunity to develop a quantitative, mechanistic model of nitrogen fixer physiology which we can employ both as a diagnostic tool and in dynamic ecological simulations. Shortly, we will present such a model, but first we consider the general principle which underpins it.
2.3 Materials and Methods
Intra-cellular oxygen balance
Oxygen management is a key cost for nitrogen fixers that we seek to quantitatively model. First consider the rate of change of the intra-cellular oxygen, Qo2 (mol 02 cell-'), in a spherical microbe:
dQt2 =P0 2 +47rr 02([02] -[02 ]j)-(RS + Rm+ R) (2.2)
dt
Here, [02] and [O2]c are the environmental and intra-cellular oxygen concentrations respectively (mol 02 m-3). The first term on the right, P02 (mol 02 cell-' s-1) represents a source from
oxygenic photosynthesis. The second term is a source due to transfer across the membrane of cell with the cytoplasmic radius r (m cell-'), governed by the oxygen gradient and the effective diffusivity across the membrane and external molecular boundary layer, K02 (M2 s-'). The third
term, in parentheses, represents consumption of intra-cellular oxygen by respiration associated with synthesis (Rs) including the direct cost of nitrogen fixation, maintenance (R,1) and
respiratory protection (RP) (mol 02 cell-' s-1). Rs is related to the growth rate of the population, p
(s-') by
R0 2 BIO (2.3)
where Qc is the carbon quota (mol C cell-') of the species in question and ySO2:BIO is the growth yield with respect to oxygen (mol 02 consumed per mol C biomass synthesized) which can be evaluated from the overall stoichiometry of the reactions (Heijnen and Roels, 1981; Rittmann and McCarty, 2001; see Supplementary Material 2.Sl).
Since reducing intra-cellular oxygen concentration is critical for nitrogen fixers, consider
the solution for the intra-cellular oxygen concentration [O2]c at steady state (dQo2/dt ~ 0):
Po-{~Y02:BIO +Rm +Rp)
[O2]C=[02]+ PO2( 4gcrKO2s + RY) (2.4)
Oxygenic photosynthesis, P0 2, always acts to increase intra-cellular oxygen concentration
along with invasion from the environment, if the external concentration is higher. In contrast
there are numerous strategies to reduce intra-cellular oxygen levels and protect nitrogenase, as
mentioned in the introduction: living in a low oxygen environment, reducing [02]; increasing the efficiency of respiratory oxygen consumption, ySO2:BIO; creating thick membranes or mucus
layers to reduce the effective diffusivity of oxygen, K02 into the cell. Since carbon quota, Qc, increases with cell volume (r3), increasing cell radius will increase Rs and reduce [O2]c, as increasing growth rate p also increases the respiratory oxygen demand. A high maintenance respiration or deliberate respiratory protection, Rp, consumes oxygen. The investment in
respiratory protection to reduce the intra-cellular oxygen concentration to very low levels can be estimated by setting [O2]c = 0 in (2.4) and re-arranging:
R 4 =4nr K2[02]+ P2 -( QCys2:BIO +R) (2.5)
The required Rp is the difference between sources due to oxygenesis and diffusive invasion, and the demand from growth and maintenance.
A model of Azotobacter vinelandii
Azotobacter vinelandii employs several of the strategies encapsulated in (2.4): It employs
respiratory protection (see Figure 2.1). Its radius increases with the environmental oxygen concentration (Post et al., 1982, 1983b; Poole and Hill, 1997). If respiration rate is proportional to the cell volume, i.e. the rate is influenced by r3 (which is approximately the case for
prokaryotes; Glazier, 2009), then the cell radius impacts intra-cellular oxygen concentration in a quadratic manner according to equation (2.4). Thus, the influence of the cell radius on oxygen management can be significant. Azotobacter also creates an alginate barrier, as the environmental oxygen concentration increases, and the amount of intracytoplasmic membrane increased with environmental oxygen concentration (Post et al., 1982).
Here we extend the simple model of the previous section to develop a more complete representation of a heterotrophic nitrogen fixer (the cell flux model) that we interface with published data on Azotobacter vinelandii cultures. This constrains key parameters and the model, in turn, provides a quantitative interpretation of the cultures. Extending the simple model of (2.3), we consider carbon nitrogen, electron and energy flow in a simplified cell. We combine an
idealized biochemical model (Rittmann and McCarty, 2001) which guides the evaluation of growth efficiencies such as ySO2:BIO, with a diffusive representation of the transport of oxygen
and other substrates through the cell membrane and surrounding molecular boundary layer (Staal
[C H] []II ATP IATP %I ATP
V--Biomiass
---Pruvai
NH4
N,
I
te HO [O ]c 02 [02]CH
Figure 2.2 Schematic depiction of the cell flux model in continuous culture. [CHL]V is the incoming carbohydrate concentration. [CHI and [(2] are the concentrations of carbohydrate and oxygen in the medium. [02]c represents the intra-cellular oxygen concentration. Red arrows represent the energy production pathways and blue arrows represent the biormass synthesis pathways. The green arrow represents nitrogen fixation. The black dashed lines represent energy flow. Orange shading indicates the cell membrane layers. See main text for details.
Ultimately the model has two free parameters: c, the energetic efficiency of cellular metabolism, and e, the efficiency of diffusion of oxygen through the cell membrane. We
constrain these parameters using the laboratory data for Azoiobcicier illustrated in Figure 2.1. and use the model to infer the cost of nitrogen fixation and the relative effect of different protection mechanisms. Though we focus on Azoobacler, for which systematic data is available, the model is potentially applicable to a broad range of nitrogen-fixing microbes, and we discuss the broader implications in later sections.
C02
/
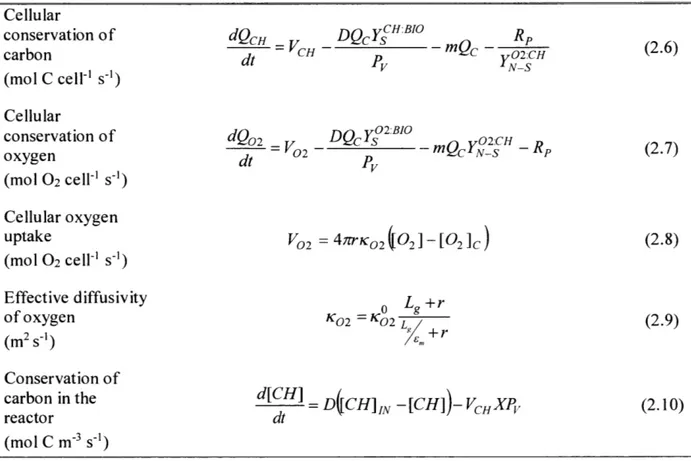
Table 2.1 Fundamental relationships of the cell flux model. Supplementary Material 2.S5 provides the definition of each parameter.
Cellular
conservation of dQcH _ DQcYCHBIO (.
carbon dt =VCH -mQc -- O 2:CH 2.6)
(mol C cell-' s-')
Cellular
conservation of dQ02 DQcSY22.BIO C 02fCH
oxygen dt =02 - V -m N S - RP (2.7)
(MOI 02 cell-' s-')
Cellular oxygen
uptake v02 =47rKO2(JI02-[O2]c) (2.8)
(mol 02 cell-' s-') Effective diffusivity 0 Lg +r of oxygen K02 = K02
(2.9)
(m2 s-1) Ly +r Conservation ofcarbon in the d[CH] = D(CH]IN -[CH] VCHXP (2.10)
reactor dt
(mol C m-3 S-1)
The model, depicted schematically in Figure 2.2, conserves mass, energy (when Rp=0)
and electron flow at the individual scale and in the simulated reactor vessel and assumes that
cultures are in steady state. Key rate equations (2.6), (2.7) and (2.10) (Table 2.1) describe the
cellular-scale conservation of carbohydrate and oxygen, as well as conservation of carbohydrate
in the reactor vessel.
For a steady state, conservation of carbohydrate at the cellular scale, equation (2.6), balances uptake of the carbohydrate (CH) substrate, VcH, against synthesis into "biomass" at


![Figure 2.2 Schematic depiction of the cell flux model in continuous culture. [CHL]V is the incoming carbohydrate concentration](https://thumb-eu.123doks.com/thumbv2/123doknet/14732226.573253/38.918.124.736.152.560/figure-schematic-depiction-continuous-culture-incoming-carbohydrate-concentration.webp)