HAL Id: insu-02481052
https://hal-insu.archives-ouvertes.fr/insu-02481052
Submitted on 17 Feb 2020
HAL is a multi-disciplinary open access
archive for the deposit and dissemination of
sci-entific research documents, whether they are
pub-lished or not. The documents may come from
teaching and research institutions in France or
abroad, or from public or private research centers.
L’archive ouverte pluridisciplinaire HAL, est
destinée au dépôt et à la diffusion de documents
scientifiques de niveau recherche, publiés ou non,
émanant des établissements d’enseignement et de
recherche français ou étrangers, des laboratoires
publics ou privés.
Distributed under a Creative Commons Attribution - NonCommercial - ShareAlike| 4.0
International License
Crustal Fault Zone: New geothermal reservoir?
Structural dataset and preliminary 3D TH(M) modelling
of the Pontgibaud fault zone (French Massif Central)
Hugo Duwiquet, Laurent Guillou-Frottier, Laurent Arbaret, Theophile
Guillon, Mathieu Bellanger, Michael Heap
To cite this version:
Hugo Duwiquet, Laurent Guillou-Frottier, Laurent Arbaret, Theophile Guillon, Mathieu Bellanger,
et al.. Crustal Fault Zone: New geothermal reservoir? Structural dataset and preliminary 3D TH(M)
modelling of the Pontgibaud fault zone (French Massif Central). 45th Workshop on Geothermal
Reservoir Engineering, Feb 2020, Stanford, CA, United States. �insu-02481052�
Stanford University, Stanford, California, February 10-12, 2020 SGP-TR-216
Crustal Fault Zone: New geothermal reservoir? Structural dataset and preliminary 3D TH(M)
modelling of the Pontgibaud fault zone (French Massif Central)
Hugo Duwiquet1,2,3*, Laurent Guillou-Frottier2, Laurent Arbaret1, Théophile Guillon2, Mathieu Bellanger3, and Michael J.
Heap4
1 ISTO, UMR 7327, Université d’Orléans, CNRS, BRGM, 1A rue de la Férollerie, 45071, Orléans, France 2 BRGM, 3 av. C. Guillemin, BP39009, 45060, Orléans, Cedex 2, France
3 TLS-Geothermics, 91 Chemin de Gabardie, 31200, Toulouse, France 4Institut de Physique de Globe de Strasbourg, UMR 7516 CNRS, Université de Strasbourg/EOST, 5 rue René
Descartes, 67084, Strasbourg cedex, France
*hugo.duwiquet@tls-geothermics.fr
Keywords: Crustal Fault Zone, high-temperature geothermal system, structural geology, 2D and 3D numerical modelling, TH, THM,
French Massif Central.
ABSTRACT
Numerous recent studies indicate that crustal-scale fault zones represent efficient conduits for meteoric fluids to flow down to mid-crustal depths (Haines et al., 2016). The present study aims to understand the potential of a new and novel type of geothermal system for high temperature and electricity production: Crustal Fault Zones (CFZ). One such example is the Pontgibaud fault zone (French Massif Central), a 30 km-long and 3 km-wide mineralized fault zone. The Pontgibaud fault zone is also characterized by numerous CO2
-rich-thermo-mineral springs. Moreover, this area is also defined by local and regional surface heat flow values of 110 mW/m2 (International
Heat Flow Commission database) involving temperature gradients between 37 and 41 °C/km. The Pontgibaud fault zone has been well studied in the last few years (Bellanger et al., 2017), electrical conductivity anomalies have been identified (Ars et al., 2019) and the temperature anomaly has been estimated (Duwiquet et al., 2019). Estimation of the geothermal resource have been established by 2D geological numerical modelling, with Thermal-Hydraulic (TH) coupling. Here we propose to integrate structural field observation into 3D geological numerical modelling with Thermal-Hydraulic-(Mechanical) (TH(M)) coupling. We then evaluate the various applications for high-temperature geothermal exploitation.
1. INTRODUCTION
CFZ can be defined as crustal-scale heterogeneities, which localize the deformation and thus modify the mechanical properties of the crust down to Brittle-Ductile Transition (BDT). These CFZ can be found worldwide, e.g. Liquine-Ofqui fault zone, Chile (Lahsen et al., 2010) Badeweiler-Lenzkirch Sutur, Germany (Brockamp et al., 2015). Among the first studies on fluid circulation within a fault, Murphy (1979) highlighted vertical thermal instabilities linked to convection cells, and then localized positives and negatives thermal anomalies. While fault often host hydrothermal systems (Faulds et al., 2010), the permeability of these networks depends on a multitude of parameters. A parametric study was able to show that the greater the permeability ratio between the fault and its host, the shallower the temperature anomaly will be. Moreover, vertical faults will concentrate the strongest temperature anomalies at shallower depths (Duwiquet et al., 2019). Additional one parameters appears to be the relationships between fault geometry and stress field (Barton et al., 1995; Siler et al., 2019).
Consequently, it is worth using a multidisciplinary approach to strongly constrain fluid flow models in hydrothermal systems (Oda, 1986; Faulkner et al., 2010; Bense et al., 2013). As an example, the recent study by Edel et al., (2018) predicts using a combination of magnetic gravity, seimic and geological data, a temperature of 150 °C at a depth of 2500m in the northern Vosges area (France). With an improved numerical modelling approach, Guillou-Frottier et al., (2013) reproduced and predicted temperatures at geothermal sites of Soultz-sous-Forêts and Rittershoffen.
Since 2014, TLS Geothermics, a French company involved in geothermal exploration has been keen to demonstrate the viability of CFZ as a geothermal exploration play for economic power generation. The Pontgibaud fault zone, located in the "La Sioule" licence (figure 1) corresponds to well-suited case study since numerous data are available (lithology, topography, springs geochemistry, thermal properties, magnetotellurics, gravimetry...) (Bellanger 2017). Thanks to this complete dataset, a multidisciplinary approach (including field, laboratory and numerical modelling study), has been performed and trend to confirm the high-temperature geothermal potential of CFZ (Duwiquet et al., 2019). However, a better understanding of the 3-dimensional spatial distribution of the 150°C economic isotherm requires 3D numerical simulation. These 3D modelling would make it possible to consider geological units not as plans but as volumes (Magri et al., 2016; Person et al., 2012; Patterson et al., 2018). Furthermore, the integration of the THM coupling will make it possible to see the effects on permeability, fluid flow and consequently to target the intensity and depth of positive thermal anomaly.
2. GEOLOGICAL SETTING 2.1 Geological formations
Bounded to the East and West by the Aigueperse Saint Sauves fault and the Sillon Houiller fault, the “La Sioule” licence (figure 1) is largely affected by late Variscan tectonics event. Metamorphic formations and the Gelles granite, which are clearly intrusive, characterize the field. Magmatic and hydrothermal vein manifestations are widely represented.
Covering a large part of the mapped region, metamorphic formations (green in figure 1) can be separated into different lithology. Biotite and Sillimanite paragneiss, extends southwards near the Miouze river and northeastwards to the Villelongue region. Orthogneiss associated with biotite and sillimanite paragneiss, are present sporadically. Cordierite gneisses is more widely represented but it is difficult
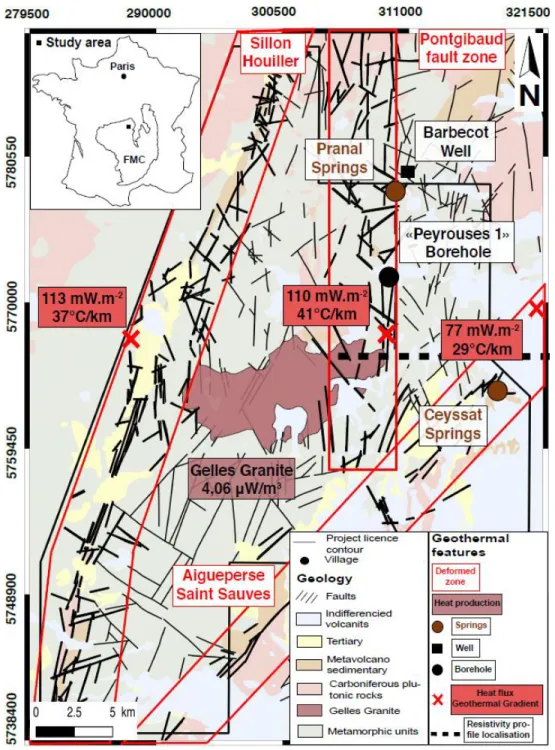
Figure 1 : Geological and geothermal features in the “La Sioule” licence area (black contour). FMC: French Massif Central. Heat flow and geothermal gradient (red crosses, Lucazeau and Vasseur (1989); Vasseur et al., 1991; International Heat Flow Commission). Heat production (Lucazeau 1981) and resistivity profil (black dashed line, Ars et al., 2019). Coordinate system: WGS84 Pseudo-Mercator EPSG:3857 (After the 1/50,000th geological map published by BRGM, the French Geological Survey).
to assign a cartographic boundary. Amphibolitic levels interspersed in the cordierite gneisses. Intrusive in metamorphic series, the porphyroid granite of Gelles (red in figure 1) extends southwest of Pontgibaud, between the Sioule Valley in the east and the village of Tortebesse in the west. To the north, the last granitic points appear immediately to the West of La Goutelle.
The presence of springs within these structures (such as Pranal and Ceyssat) is an indicator of present-day fluid circulation (figure 1). Temperature measurements have been carried out between 55 and 120m. From these measurements, a geothermal gradient of 41°C/km has been inferred and a heat flux of 110 mW.m-2 was estimated (IHFC database; http://ihfc-iugg.org/). Magnetotelluric campaigns have
been conducted in the Pontgibaud fault zone area by TLS-Geothermics and IMAGIR between 2015 and 2017 (Ars et al., 2019). At a depth of 8 km and 3 km, two anomalies located in the brittle crust could be linked to the presence of magma, clays (smectites) and/or hydrothermal fluids. These two anomalies appear to be related to the Pontgibaud fault zone.
2.2 Structural setting
In order to understand the potential reactivation of some geological structure, it seems necessary to consider the tectonic calendar of the study area.
2.2.1 Early to late Stephanien (305-295 Ma)
During the Lower and Middle Stephanian, N-S compression creates a system of conjugated N140°-170°E sinistral and N10°-50°E dextral with N80°120°E reverse faults. This episode is responsible for the NE-SW sinistral fault of the "Sillon Houiller". During the transition from the middle to the upper Stephanian, the axis of rotation of the compression changes from N-S to NW-SE, activating or reactivating dextral conjugated faults N 120°E and sinistral N160-180°E. This compression affects the basement. During the upper Stephanian, the compression becomes E-W and causing a strong folding of coal deposits along the Sillon Houiller fault (Blès et al., 1989).
2.2.2 Permian to Jurassic (295-154 Ma)
Following stephanian compression, the N-S/NE-SW permo-triassic extension is represented in the basement by normal faults, tension cracks, and veins (Santouil, 1980; Bonijoly, 1981, Blès et al., 1982a; Blès et al., 1989). On the Cévennes border, this N-S extension has followed NW-SE directions inherited from the Stephanian, forming NE faults such as the Cévennes fault. (Bonijoly and Germain, 1984; Blès et al., 1989).
2.2.3 Jurassic to Cretaceous (154-96 Ma)
During the transition from the Triassic to the Jurassic, a NE-SW extension is visible in the Rodez and in the western Cévennes, creating
normal synsedimentary faults (Blès et al., 1989).
The beginning of the NW-SE extension was accompanied by significant metallogenic and thermal phenomena. At the Trias-Lias border, a major metallogenic event occurred in the Massif Central, with the formation of a large number of veins and stratiform deposits, whose age was determined at about 194 Ma (Baubron et al., 1980). Structural studies show that the appearance of N-S to NE oriented barite and fluorite veins in Morvan, Quercy and Lozère can be attributed to the Early Jurassic (Jebrak, 1978; Bonijoly, 1981; Valette, 1983). The Jurassic-Cretaceous period corresponds mainly to the development of the Liguro-Provençal Ocean and then the Atlantic Ocean. The beginning of the Jurassic is characterized by a radical change in the directions of extension, since we move from a period marked by a strong late extension to an extensive period where the stresses are much lower, causing small deformations. This N-S oriented extension episode was responsible for the appearance of normal N80°-130° oriented faults. At the Cévennes border, the NE-SW extension also
functioned during this period and led to the formation of faults with trends varying from NW-SE to E-W. The rapid rotation of the direction of the main σ3 and intermediate σ2 minimum stresses around the maximum subvertical stress σ1 has led
to a new N-S-oriented paleogeography that persisted in the early and mid Jurassic.
At the beginning of the Late Jurassic, the Dogger structure was destroyed by another rotation of the main σ3 and σ2 minimum stresses
around the maximum vertical stress σ1. The previous E-W extension disrupted the organized N-S paleogeography elevations of the Middle
Jurassic.
2.2.4 Cretaceous to late Pliocene (96-2.5 Ma)
The establishment of a rift characterizes the Cenozoic in Europe: the European Cenozoic Rift System (ECRIS). This system of about 1000 km is associated with a series of transect faults throughout the Variscan massif in the front alpine country. This produces a radical change in the constraint regime throughout the Massif Central. After a long period of Permian-Mesozoic extension, an N-S compressive tectonic regime was established, the effects of which were visible from England to Bohemia (Mattauer and Mercier, 1980; Letouzey and Trémolières, 1980; Trémolière, 1981; Bergerat, 1985; Ziegler, 1987).
In the Massif Central and its borders, the Late Eocene - Oligocene extension generated basins, grabens and half grabens bounded by normal faults, in which several hundred to thousand metres of continental sediments were deposited. The faults limiting these basins are generally N-S oriented but some NE-SW and NW-SE trends also exist. The main basins underlie Limagnes area (tertiary plains of the Allier and Loire valleys). The eastern and south-eastern borders of the Massif Central are also marked by the Oligocene basins of Bresse, Graben du Rhône, Alès and graben de Camargue (Arthaud et al, 1977 ; Arthaud and Séguet, 1981). While the extension affected the entire Massif Central and its border, the deformation is concentrated near the regional fractures inherited from Variscan orogeny.
During the Oligocene, the Western European plate was affected by a system of N-S-trending grabens forming the Western European Rift. This continental rift is divided into several sections linked by transforming regional faults with a NE direction (Bergerat, 1985; Gélard,
1978). These faults are located above characteristic areas: -Continental crust and thinned lithosphere in the Massif Central (Limagne) and south of the Rhine Graben (Moho at 25 km depth and
lithosphere only 60 to 100 km thick (Sapin & Prodehl), 1973).
-Positive heat flow anomaly (Vasseur and Lucazeau; 1981).
-Mantle anomaly due to partial melting at the boundary between the continental crust and the rigid mantle, corresponding to an elevation or intrusion of the plastic asthenosphere into the lithosphere, which is the source of volcanic eruptions and effusions that have occurred at the faults that define the rifts.
2.3 Lithological and structural characteristics of the Pontgibaud Fault Zone Reservoir
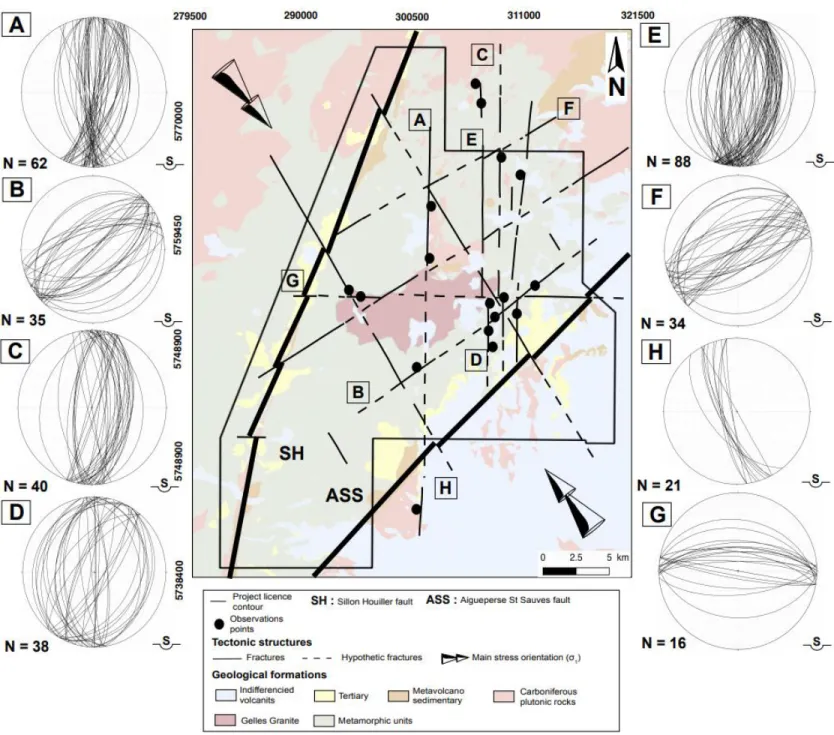
The North-South structures (figure 2 [A], [C], [D], [E]) represent fairly clear topographic boundaries and underline the vein axis at Pb-Zn. The alignment of this axis is often interrupted by transverse structures and masked by the abundance of volcanic flows in the eastern
Figure 2 : Overview map, showing the main fracture present in the "La Sioule" Licence and the regional stress (data from TLS-Geothermics, Bellanger et al., 2019)
part. Although masked by the alluvium of the Sioule Valley, these North-South structures underline a homogeneous alignment over 40 km.
Presence of sub-vertical structures (figure 2 [G]) marked the topography. There are also E-W trends, every 10 km, in the southern part of the French Massif Central (FMC) and near the Sillon Houiller.
The NW-SE (figure 2 [H]) structure are quite frequent and often overlap the E-W faults without inducing significant offset. This fault family is also found in the Limagne region. The Faye accident, whose creek valley is of the same name, morphologically highlights part of the route.
The NE-SW (figure 2 [B], [F]) structure can be seen widely on the geological map, from the west of the Sillon houiller to Limagne. They are particularly well expressed on Gelles granite. Former mining operations have shown veins of mispickel. Mapping observations show that these faults are not too affected by N-S faults. These fault planes are mostly vertical
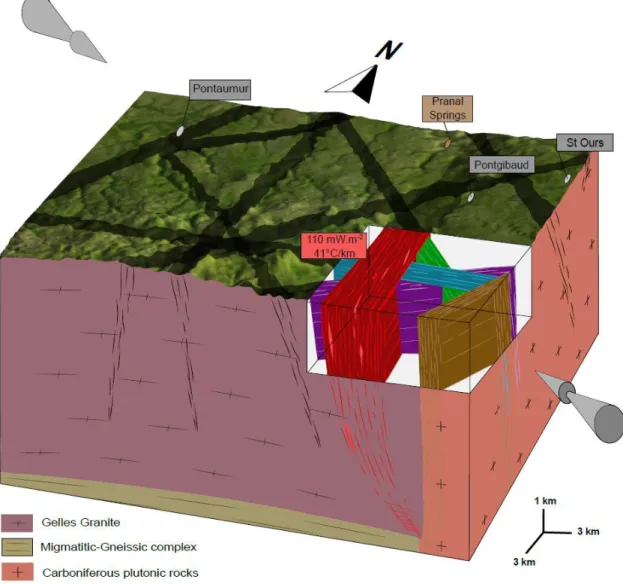
To summarize, the fracture network is characterized by a N-S deformed zone of a 3.5 km thick (figure 3). Geophysical and field data show that this rather vertical structure takes root at depths of up to 10 km. At shallower depths we find the intersection of 3 fault families. An E-W (in blue), a NE-SW family (in purple) and a NW-SE family (in green). In order to better understand how fluids can circulate in this kind of system we will first of all show the results of 2D numerical simulations. These results couple the heat equations as well as Darcy’s law. These numerical simulations integrate geological constrain.
3. 2D THERMAL AND HYDRAULIC MODELLING
The numerical simulation has been performed with Comsol MutliphysicsTM software. In the first 2D numerical simulations we coupled
the heat transfer and fluid flow equations with appropriate rock and fluid properties. For porous and permeable formations, fluid motion is driven by the pressure gradient and buoyancy, and the fluid infiltration velocity obeys Darcy’s law. Details on the used equations can be found in Guillou-Frottier et al., 2013.
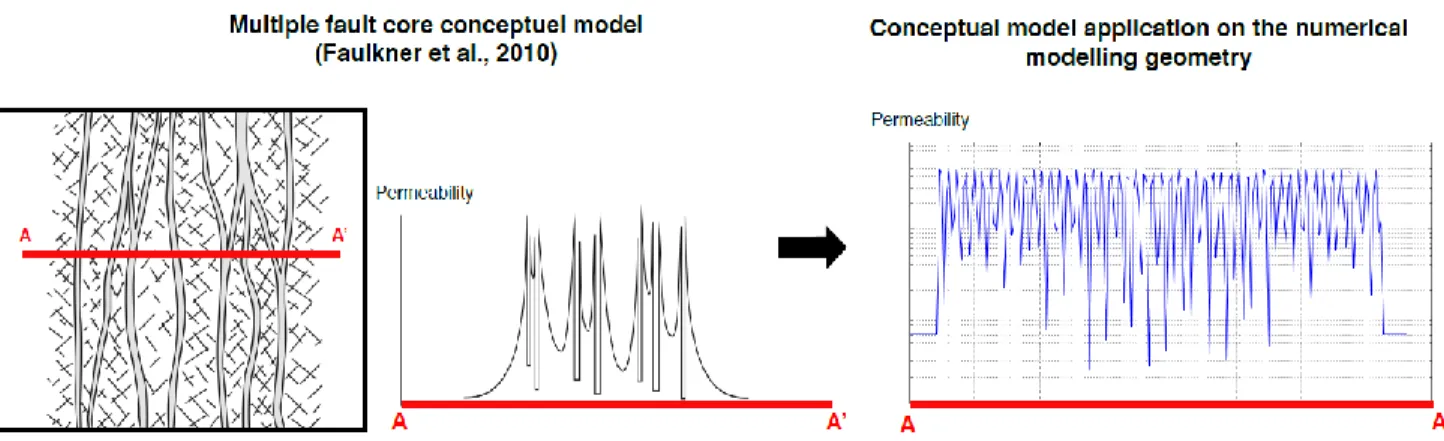
Field and laboratory analyses indicate that the Pontgibaud area has a very high fracture density. By keeping the usual depth-decrease of permeability, a lateral variation can be included, by using the following spatial variation:
𝐾𝐹(𝑥, 𝑧) = 𝐾𝐹0 × 𝑓(𝑧) × 𝑓(𝑥) (1)
Where 𝐾𝐹(𝑥, 𝑧) is the space-dependent permeability of the fault, 𝐾𝐹0 is the permeability at the surface, 𝑓(𝑧)is the depth-dependent function,
and 𝑓(𝑥)makes the permeability alternate along a sinusoid applied to the vertical and horizontal axes of the numerical model, such as:
𝐾𝐹(𝑥, 𝑧) = 𝐾𝐹0 ×[𝑒𝑥𝑝 (−𝑧) 𝛿 ] × [200 × sin ( 2𝜋(𝑧+𝑥) 𝜆 )] (2)
The term 𝜆 corresponds to the wavelength of the sinusoid. To reproduce rather fine alternations of high and low permeability, as suggested by field (Faulkner et al., 2010), and laboratory observations (Duwiquet et al., 2019), a low value of 𝜆 was chosen. The length 𝛿 (m) characterizes the intensity of the decrease in permeability with depth.
More than 200 numerical simulation have been performed. Details on the obtained temperature patterns can be found in Duwiquet et al., 2019, and figure 5 [A] synthetizes all the results in a diagram form. The x-axis corresponds to the dip (°) of the structures, which vary from 20 to 160 ° from the horizontal. The y-axis corresponds to the T (°C), which is the abnormal value of the temperature compared to a normal geothermal gradient and varies from 8°C to 127 °C. The different curves correspond to different permeability ratios between the fault and its host. This ratio is defined as:
𝑅 = 𝐾𝐹𝑎𝑢𝑙𝑡
𝐾𝐵𝑎𝑠𝑒𝑚𝑒𝑛𝑡
(3)
With 𝐾𝐹𝑎𝑢𝑙𝑡 (m2) corresponding to the permeability of the fault, and 𝐾𝐵𝑎𝑠𝑒𝑚𝑒𝑛𝑡 (m2) corresponding to the permeability of the basement.
For a first consideration, we fixed 𝐾𝐵𝑎𝑠𝑒𝑚𝑒𝑛𝑡 at 10-16 m2.
Figure 4 : Variation of permeability imposed in the fault zone according to the multiple fault core conceptual model of Faulkner et al., 2010.
For unicellular weak and medium type convection zone (blue and orange area in figure 5[A]) the values of the thermal anomalies produced are between 10 and 120°C. For bicellular convection (red area in figure 5[A]), the values of the thermal anomalies produced are between 65 and 120°C. The results of this study should be applicable to hydrothermal systems in a crustal context. The geometry of the numerical model for Pontgibaud is directly based on the geological model (from Duwiquet et al., 2019). In accordance with the thermal relaxation time of the magmatic chambers calculated on the basis of thermos-barometric study (Martel et al., 2013), the results of our numerical simulations are shown up to time t0 + 15,000 years.
The comparison of the results obtained by modelling with the data measured in the field makes its possible to assess the consistency of the obtained results. In the Pontgibaud Fault Zone area, the surface heat flux is 110 mW.m-2 and the geothermal gradient is 41°C.km-1
(Vasseur et al., 1991, International Heat flow Commission). This comparison will make it possible to estimate the permeability value for which field measurements and simulation results are consistent. Among the numerous tested models, its turns out that only some combination precisely reproduced the above-described thermal features. The result for the simulation with a maximum permeability value of 1.6 × 10⁻¹⁴ m2 show a surface heat flux of 115 mW.m-2 and a geothermal gradient of 39°C.km-1.
For this fault zone, we observed the establishement of a thermal anomaly of 150°C at 2.500m. According to the large-scale numerical simulation and the diagram of convective regimes, the fluid flow circulate in the bicellular strong type convection regime. Moreover, for a fault zone permeability value of 1.6 × 10⁻¹⁴ m2, R=160 and then confirm the quantitative approach expressed by the diagram of
convective regimes. However, a better understanding of the 3D spatial distribution of the 150°C economic isotherm requires an adapted numerical simulation.
4. 3D PRELIMINARY THERMAL, HYDRAULIC, MECHANICAL MODELLING
Although the 2D models give precious information on the physical mechanisms involved, it cannot capture the complexity in heat redistribution arising from the 3D configuration of the natural fault network. Our ultimate goal is to extend our approach to complete 3D analyses, but we present here a first, state-of-the-art 3D model. This model integrates a set of geological and physical complexities (structural, lithology, heat production...) to constrain its 3D construction. In addition to TH phenomena, we include some mechanical aspects because the natural stress-state affects the in situ TH behavior of the rock mass (e.g., by modifying the faults permeability see Barton et al., 1995). In the first place, we build a purely mechanical model submitted to the in situ stress state. The mechanical results are then used to parameterize the rock mass initial permeability and porosity. Then, a TH model is run considering the exact same geometry
Figure 5 : [A] Diagram of convective regimes. Black lines represent isotherm morphology. The dashed black line separate three areas. In blue, the area of unicellular weak type convection zone. In orange, the area of unicellular medium-type convection zone. In red the area of bicellular strong-type convection zone. [B] Numerical simulation results for a maximum permeability imposed on the Pontgibaud fault zone of 𝟏. 𝟔 × 𝟏𝟎−𝟏𝟒 m2, at time 𝒕
and the heterogeneous parameters distribution resulting from the mechanical model. So far, mechanics are blocked for the TH model (no mechanical coupling).
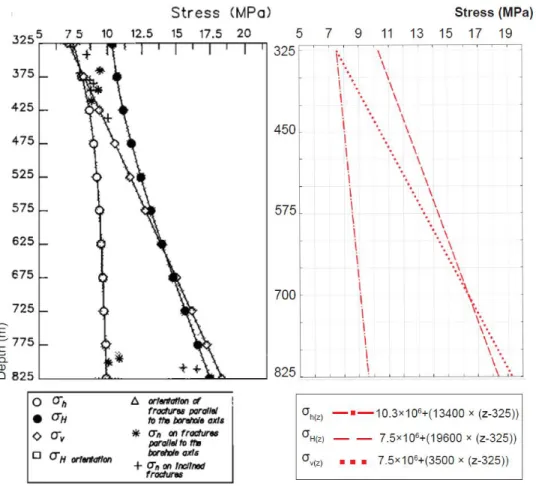
One of the critical point of setting regionally-scaled mechanical models is the boundary conditions (Gunzburger and Magnenet, 2014; Reiter and Heidbach, 2014) that result from the far-field stresses. The stress orientation in the surroundings of the Pontgibaud Fault Zone Reservoir is approximately N145° but the magnitude is not well known. We propose to take advantage of in situ measurements from the Chassoles borehole (figure 6) (located at 60km south-east of Pontgibaud). This well was drilled for the “Géologie Profonde de la France” research program. The stress field has been determined by hydraulic testing. It encountered only orthogneiss and intersected several subvertical fault zones to depths of 180m and 630m. A total of 22 tests were run, 9 between 340 and 470m and 13 between 734 and 853m. Many tests yielded fractures. At Chassoles, the maximum stress is vertical but nearly equal to 𝜎𝐻. This stress profile has been integrated
as boundary conditions for the 3D model of the “La Sioule” licence with the “Solid Mechanics” modulus of Comsol MultiphysicsTM
software.
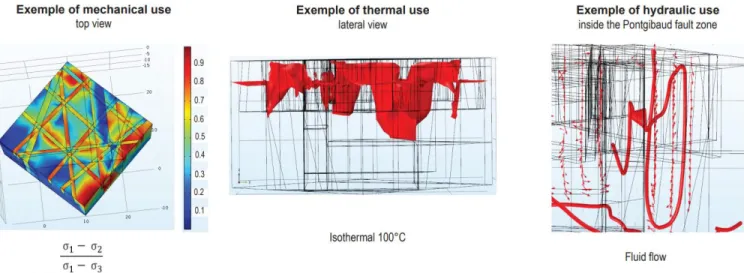
Preliminary results of the 3D TH(M) coupling of the "la Sioule" licence are shown in figure 7. For example, the stress ratio R depicted in figure 7 highlights the strong stress heterogeneity in the rock mass. With the mechanical applications of such numerical simulation, it would be possible to study quantities of industrial interest such as the slip or the dilation tendancies (Barton et al., 1995). This would make it possible to target damage zone which are favorable for fluids circulation. These first results show that the fluids circulations within a fault zone is carried out in the form of helicoïdal movement, as defined by Magri et al. 2016. Convection cells also set up and localized at shallower depths thermal anomaly. These preliminary results tend to confirm the presence of geothermal reservoirs within the CFZ. However, this requires further investigation of the fluid behavior in response to mechanical stress and the consequences on temperature anomalies. Comparison of results with field and laboratory data should also be performed
Figure 6 : Stress profile of the Chassoles borehole (45.38°N, 3.09°E) (from Cornet and Burlet, 1992) integrated in Comsol MultiphysicsTM.
5. CONCLUSION AND PERSPECTIVES
This study aims to understand how Crustal Fault Zone can generate a viable geothermal ressource. It brings new structural data set as well as the result of 3D geological constraint numerical modelling with TH(M) coupling. The structural data set underlines the polyphase character of the brittle deformation within the "La Sioule" licence. Fractures families have different N-S, E-W, NE-SW and NW-SE orientations. All of these are mainly vertical. Previous geophysical data shows that the Pontgibaud fault system is rooted at great depth. To conclude, the geothermal reservoir is made up of a deep, vertical fault, which intersect 3 other fault families at shallower depths. A 2D parametric study was established in order to obtain a predictive tool applicable to a natural system. A convective regime diagram was obtained and the results were compared and confirmed by large-scale 2D numerical modelling. These results also highlight the vertical fault zones as preferential reservoirs for high temperature operation. This approach made it possible to characterize a temperature anomaly of 150°C at a depth of 2,500m.
Integrating geological and physical data set, 3D numerical modelling with TH(M) coupling tends to show that deep and vertical faults locate temperature anomalies at economically interesting depths. Fluid flow circulate by means of convection cells via some helicoïdal movements where it will henceforth be possible to consider a mechanical factor influencing the circulation of fluids in 3D (figure 8).
Figure 7 : Preliminary 3D TH(M) numerical modelling of the “La Sioule” licence. Information collected here will be compared with field and experimental data.
Figure 8 : Diagram of 2D convective regimes for the theoretical fault. The third variable, which may be used for 3D THM experiments, has yet to be determined.
REFERENCES
Ars JM, Tarits P, Hautot S, Bellanger M, Coutant O, Maia M.: Joint inversion of gravity and surface wave data constrained by magnetotelluric: application to deep geothermal exploration of crustal fault zone in felsic basement. Geothermics, 80, (2019), 56– 68.
Arthaud, F. and Matte, P.: Late Paleozoic strike-slip faulting in southern Europe and northern Africa: result of a right-lateral shear zone between the Appalachians and the Urals. Geol. Sot. Am. Bull., 88, (1977), 1305-1320.
Arthaud, F. and Seguret, M.: Les structures pyrénéennes du Languedoc et du Golfe du Lion (Sud de la France). Bull. Soc. Geol. Fr. (7). 23(l), (1981), 51-63.
Baubron, J.C., Jebrak, M., Joannes. C., Lhegu, J., Touray, J.C. and Ziserman, A.: Nouvelles datations K/Ar sur les filons à quartz et fluorine du Massif central français, C.R. Acad. Sci. Paris, Sér. D, 290, (1980), 951-953.
Barton C-A, Zoback M-D, Moos D.: Fluid flow along potentially active faults in crystalline rock. Geology. 23(8), (1995), 683–6. Bergerat, F.: Paléochamps de contrainte tertiaires dans la plate-forme européenne au front de I’orogène alpin. Bull. Sot. Geol. Fr., 8,
(1987), 611-620.
Bergerat, F.: Déformations cassantes et champs de contraintes tertiaires dans la plate-forme européenne. Thèse Doct. Sci., Mém. Sci. Terre
Univ. Curie, Paris, 85507, (1985),315 PP.
Bense V, Gleeson T, Loveless S, Bour O, Scibek J.: Fault zone hydrogeology. Earth Sci Rev.127, (2013), 171–92.
Bellanger M. High temperature geothermal resources of crustal fault zones: a dedicated approach. In: 79th EAGE conference and exhibition, (2017).
Bellanger, M., Hermant, B., Galibert, S., Auxiètre, J. L.: Fault-controlled hydrothermal system associated with major Crustal Fault Zone: future drilling target to assess the deep geothermal potential–The Sioule license project. In: Proceedings European Geothermal Congress Den Haag, The Netherlands, (2019).
Blès, J. L., Bonijoly, D., Castaing, C., Gros, Y.: Successive post-Variscan stress fields in the French Massif Central and its borders (Western European plate): comparison with geodynamic data, Tectonophysics, 169(1-3),(1989) 79-111.
Blès, J.L., Bonijoly, D., Gros, Y. : Apport de l’analyse structural à la connaissance des gîtes filoniens. Méthode d’étude et applications dans le Sud-Ouest du Massif Central. Bull. B. R. G. M., Sér. 2, 2(4), (1982),427-436.
Bonijoly, D. : Recherche de bassins houillers sous couverture sédimentaire dans le Sud-Ouest du Massif Central. Inventaire des ressources nationales de charbon. Gitologie prévisionnelle des charbons. Rapp. B. R. G. M. No. 82 SGN, (1982), 401 GEO.
Bonijoly, D., and Germain, H.: Histoire tectonique post-hercynienne du bassin d'Alès (Gard): chronologie des déformations et contrôle structural des minéralisations barytiques Editions du Bureau de recherches géologiques et minières, Service géologique national, (Vol. 76). (1984).
D. Bonijoly.: Etude structurale et minéralisation d’une plate-forme carbonatée: le Quercy. Thèse Doct. 3e cycle, (1981) Orléans-Dot. B. R. G. M., 23: 203 pp.
Brockamp O, Schlegel A, Wemmer K.: Complex hydrothermal alteration and illite K-Ar ages in Upper Visean molasse sediments and magmatic rocks of the Variscan Badenweiler-Lenzkirch suture zone, Black Forest, Germany. Int J Earth Sci. 104(3), (2015), 683–702. Duwiquet, H., Arbaret, L., Guillou-Frottier, L. et al.: On the geothermal potential of crustal fault zones: a case study from the Pontgibaud
area (French Massif Central, France). Geotherm Energy 7, (2019), 33.
Faulds J, Coolbaugh M, Bouchot V, Moek I, Oguz K.: Characterizing structural controls of geothermal reservoirs in the Great Basin, USA, and western turkey: Developing successful exploration strategies in extended terranes. In: Proceedings world geothermal congress Bali, Indonesia, (2010).
Faulkner D, Jackson C, Lunn R, Schlische R, Shipton Z, Wibberley C, Withjack M.: A review of recent developments concerning the structure, mechanics and fluid flow properties of fault zones. J Struct Geol. 32(11), (2010), 1557–75.
Guillou-Frottier L, Carre C, Bourgine B, Bouchot V, Genter A.: Structure of hydrothermal convection in the upper Rhine graben as inferred from corrected temperature data and basin-scale numerical models. J Volcanol Geoth Res.256, (2013), 29–49.
Gunzburger, Y., Magnenet, V.: Stress inversion and basement-cover stress transmission across weak layers in the Paris basin, France. Tectonophysics 617 (2014), 44–57.
M. Jebrak.: Le filon des Farges et les minéralisations à barytine, fluorine et galène du district d’Ussel dans leur cadre géologique (Massif Central Francais). Thèse Doct. 3e cycle, (1978), Univ. Orléans, 306 pp.
Letouzey, J. and Trémolières, P.: Paleo-stress fields around the Mediterranean since the Mesozoic derived from microtectonics: comparison with plate tectonic data. Mém. B. R. G. M., 115, (1980), 261-272.
Lucazeau F, and Vasseur G.: Heat flow density data from France and surrounding margins. Tectonophysics.164(2), (1989), 251–8. Lucazeau F.: Flux de chaleur, production de chaleur et évolution géodynamique récente du Massif Central Français. Thèse Doc, Université
des sciences et techniques du Languedoc, Montpellier. 1981.
Lucazeau, F., and Vasseur, G.: Heat flow density data from France and surrounding margins. Tectonophysics, 164(2-4), (1989) 251-258. Mattauer, M. and Mercier, J.L.: Microtectonique et grande tectonique. Mém. Soc. Geol. Fr., Hors-Sér., 10, (1980), 141-161.
Magri, F., Möller, S., Inbar, N., Möller, P., Raggad, M., Rödiger, T., … and Siebert, C.: 2D and 3D coexisting modes of thermal convection in fractured hydrothermal systems-Implications for transboundary flow in the Lower Yarmouk Gorge. Marine and Petroleum
Geology, 78, (2016), 750-758.
Murphy H-D.: Convective instabilities in vertical fractures and faults. J Geophys Res. 84, (1979), 6121–30.
Oda M.: An equivalent continuum model for coupled stress and fluid flow analysis in jointed rock masses. Water Resour Res. 22(13), (1986), 1845–56.
Patterson, J. W., Driesner, T., Matthai, S., & Tomlinson, R.: Heat and fluid transport induced by convective fluid circulation within a fracture or fault. Journal of Geophysical Research: Solid Earth, 123(4), (2018), 2658-2673.
Person M, Hofstra A, Sweetkind D, Stone W, Cohen D, Gable C-W, Banerjee A.: Analytical and numerical models of hydrothermal fluid flow at fault intersections. Geofluids, 12(4), (2012), 312–26.
Reiter, K., Heidbach, O.: 3-D geomechanical-numerical model of the contemporary crustal stress state in the Alberta Basin (Canada).
Solid Earth 5, (2014), 1123–1149.
G. Santouil.: Tectonique et microtectonique de la distension permienne et de l’évolution post-triasique dans les bassins de Lodève, Saint-Afrique et Rodez (France Sud-Ouest). Thèse Doct. 3e cycle. U.S.T.L. 1980. Montpellier. 74 pp.
Sapin, M., and Prodehl, C.:Long range profiles in Western Europe. 1. Crustal structure between the Bretagne and the Central Massif of France. Ann. Geophys., 29(l), (1973),127-145.
Siler, D. L., Faulds, J. E., Mayhew, B., McNamara, D. D.: Analysis of the favorability for geothermal fluid flow in 3D: Astor Pass geothermal prospect, Great Basin, northwestern Nevada, USA. Geothermics, 60, (2016), 1-12.
Trémolières. P.: Mécanismes de la déformation en zone de plate-forme. Méthodes et application au bassin de Paris. Rev. Inst. Fr. Ptt., 36(4), (1981), 395-428
Vasseur G, Gable R, Feuga B, Bienfait G.: Groundwater flow and heat flow in an area of mineral springs. Geothermics,20(3), (1991), 99– 117.
CO. Valette.: Karsts et filons & fluorine dans le faisceau synclinal du Morvan: le gisement d’Argentolle (Saône-et-Loire, France). Thèse
Doct. 3e cycle. Univ. Orléans-Dot. B. R. G. M., 58 (1983).
Ziegler, P.A.: Late Cretaceous and Cenozoic intra-plate compressional deformation in the Alpine foreland; a geodynamic model.