The SAEM algorithm for group comparison tests in longitudinal data analysis based on non-linear mixed-effects model.
Texte intégral
Figure
Documents relatifs
Note that generating random samples from p i (ψ i |y i ) is useful for several tasks to avoid approximation of the model, such as linearisation or Laplace method. Such tasks include
Since the individual parameters inside the NLMEM are not observed, we propose to combine the EM al- gorithm usually used for mixtures models when the mixture structure concerns
Unité de recherche INRIA Rennes : IRISA, Campus universitaire de Beaulieu - 35042 Rennes Cedex (France) Unité de recherche INRIA Rhône-Alpes : 655, avenue de l’Europe -
The main drawback of the previous approach is that the precomputation step will mesh the whole parameter domain, whereas SAEM algorithm will concentrates on particular areas of
If an Egyptian date is given, we add to the number of the day the number of elapsed months of the current Egyptian year, multiplied by 30, and the number of elapsed Egyptian years
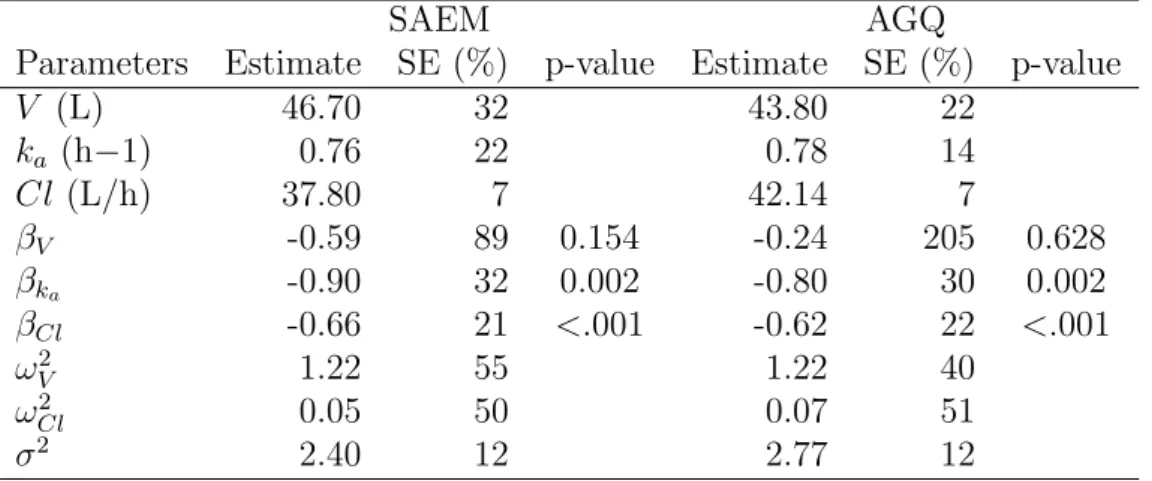
Test for 92 populations of 1000 individuals: Results (from Monolix) and errors for the mean parameters of the population.. Column E1 refers to a population
of three steps: sort the image elements (pixels); then run the modified union- find algorithm to compute a tree encoded by a parent function; last modify the parent function to
In summarizing time-to-event data, there are two main functions of interest, namely the survival function and the hazard function. The actual event time t can be regarded as the
