A DETAILED SPECTRAL REFLECTIVITY STUDY OF COPERNICUS AND ITS EJECTA
by
ERIC ROBIN WOLF
S.B., M.I.T., 1970
SU3viITTED IN PARTIAL FULFILLM1ENT OF THE REQUIREIiENTS FOR THE
DEGREE OF MASTER OF SCIENCE at the MASSACHUSETTS INSTITUTE OF TECHNOLOGY June, 1970 Signature of Author..
Department of B rth and Planetary Sciences, June 4, 1970
Certified by... ... ... ...-....
Thesis Supervisor
Accepted by...f0 .. , -...0 .0.0. 00...
Chairman, Departmental Committee on Graduate Students
A DETAILED SPECTRAL REFLECTIVITY STUDY OF COPERNICUS AND ITS EJECTA
by
Eric Robin Wolf
Submitted to theDepartment of Earth and Plan-etary Sciences on June
4,
1970 in partial fulfill-ment of the requirefulfill-ment for the degree of Master of Science.ABSTRACT
An observational study was performed to deter-mine relative spectral reflectivity differences (0.4-1.1 microns) in the Copernicus region of the moon, as well as several other bright crater areas. A photoelectric filter photometer was used. Results suggest that: (1) spectral features do exist. (2) The spectral feature amplitude in the normalized rel-ative spectral reflectivity curves for areas studied tends to decrease as distance of the areas from Cop-ernicus increases. The general shape of the curve remains the same. This implies that the amount of Copernican material decreases as the distance of a spot from Copernicus increases. (3) The curves for
areas on some Copernican rays have the same general shape as do the curves of areas in Copernicus. The amplitude of the spectral features for the ray area curves tends to be smaller than for areas in the cra-ter, implying that the rays contain mare material as well as Copernican material.
(4)
There is nosignif-icant dependence of relative color at Copernicus on lunar phase angle.
(5)
The angular distribution of Copernican ejecta appears to be uniform. (6) Coper-nican ejecta has a relatively high albedo.Thesis Supervisor: Thomas B. McCord, Ph.D.
ACKNOWLEDGiENTS
I wish to thank Dr. Thomas B. McCord for his guidance and support. His advice and encouragement are gratefully appreciated.
Mr. James Westphal is to be thanked for use of the telescope, and for his willingness to help at any time.
I am grateful to Carl Pilcher, who helped with the observations.
TABLE OF CONTENTS INTRODUCTION 5 Purpose 5 Definition 5 OBSERVATIONS 7 Instrumentation
7
Table 1 8 Method of Measurement9
Table 2 10DISCUSSION OF SURFACE-SCATTERED RADIATION 13
DATA AND INTERPRETATIONS 16
Phase Angle 16
Table 3 17
Compositional Mixing 18
Curve Structure 19
Amplitude and Distance 20
Table 4 21
Angular Distribution of Ejecta 22
Albedo 23 Rays 24 Non-Copernican Areas 26 Summary 29 APPENDIX I (Data) 31 APPENDIX II (Figures) 34 REFERENCES 41
INTRODUCTION
Purpose
An important means of studying the lunar surface is by determining the wavelength dependence (color) of the intensity of reflected solar radiation. By viewing the relative changes in this property over the lunar surface, it is possible to determine relative differences in the materials of the surface. Possible disparities could include differences in composition, particle size, particle shape, and particle packing configurations. Calibration of spectral differences can be accomplished by direct laboratory measurements and by study of lunar samples.
This work is the first known intensive spectral photometric observational study of Copernicus and its
ejecta. There have been, however, many studies made of the color of areas on the moon. Two recent authors--Coyne (1963, 1965) and McCord (1968, 1969)--have found
color variations, even within the maria. McCord observed some differences which were as high as 60%. A complete bibliography of such studies is presented by McCord
(1968).
Definition
simplifies the measurement and data reduction techniaues. The quantity of interest--the normalized relative spec-tral reflectivity--is given by:
D (?N) = Ix(A)/Ix(-53p) .
Is (?k)/Is
(
.53pu)Ix( is the intensity of a lunar area at a given wave-length; Ix(.53u) is the intensity of this spot at .53
microns. Is(A) and Is(.53/) are the corresponding
intensities of the standard spot.
By taking ratios of the intensity of light reflect-ed from a given spot to that from a standard spot (taken at nearly the same time), multiplicative atmospheric effects (i.e. extinction) on the measurements are
elim-inated. The ratio process also compensates for changes in sensitivity, gain, and settings of the instruments.
This relative spectral reflectivity is normalized to
.53
microns. The normalization is essential, since albedo variations on the moon are much greater thancolor variations. If this normalization were not made, a bright area (high albedo) would appear to have much greater relief in its spectral reflectivity curve than
a dark area (low albedo). Albedo, then, rather than color, would be the major factor in determining appar-ent spectral reflectivity differences.
-
~-OBSERVATIONS
Instrumentation
A single-beam photometer mounted on the Mt. Wil-son 24-inch telescope was used to make measurements. A set of thirteen narrow band interference filters was used to measure the spectral intensity within a
spectral range of 0.4 to 1.1 microns. During the July-August, 1969 lunation, only the first eleven filters were used, extending over a spectral range of 0.4 to
1.0 microns. The effective wavelengths and spectral widths of these filters are tabulated in table 1. The filters were mounted on a slotted wheel which rotated
automatically between integrations.
The detector used was an ITT photomultiplier tube
with an S-1 surface. The tube was used in a pulse-counting mode.
The lunar guiding is facilitated on the 24-inch telescope by variable tracking rates. This can
con-trol the north-south and east-west motion of the tel-escope so that the teltel-escope will stay on a point on
the moon to first order in the moon's orbital motion. Manual guiding, though, is still necessary.
Table 1 FILTER CHARACTERISTICS Effective Wavelength %eff (microns) .402 *467
.532
.598
.633
*699
.765
.855
.906*948
1.002 1 7053 10101 PassbandA
A(microns).03
.03 .03.03
.03 .03 .03.05
.05
.05
.05
.05
.05
The effective wavelengths have been calculated considering the spectral characteristics of the fol-lowing:
1. solar energy distribution 2. average lunar reflectivity
3.
terrestrial atmospheric transmission (1 atm)4.
telescope optics (aluminum mirrors)5.
filter transmission6.
photocathode sensitivity Filter 1 2 3 45
6
7
8
9
10 11 12 13Method of Measurement
The spots observed were circular areas with dia-meters of about 8 km on the lunar surface (sub-earth
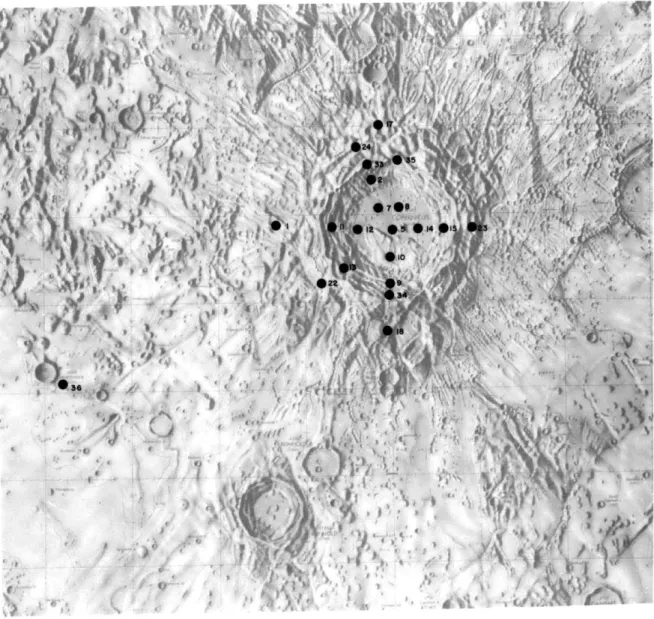
point). About 25 spots in and around the lunar crater Copernicus were studied. These points included areas within the crater floor, the walls (or inside slopes), throwout around the crater, crater rays, and the peak
in the center of Copernicus. (Fig. 1 and Table 2) The measured spectral intensity curve was then divided by the intensity curve of a standard spot in Mare Im-brium. The standard spot was chosen because: (1) it
is located in a compositionally and topographically
homogeneous area. Thus the measurements are not ex-tremely sensitive to small guiding errors at the stan-dard spot. (2) It is approximately at the same selen-ographic longitude as most of the other spots observed. Thus lighting conditions would be similar. (3) It is
relatively near Copernicus--and thus saves time in
moving the telescope between it and the crater.
(4)
It is in the field of view of several clear landmarks, which makes it easy to position the aperture very precisely.SELENOGRAPHIC COORDINATES OF LUNAR AREAS Spot
5
1 1733
3635
14 10 127
934
218
20 11 21 25 15 248
22 23 13 M311 BR1 BR2 B R3 MC MN Tl T6 Til 20.0 22.0 20.1 20.7 2705 19.6 19.2 20.1 20.7 20.4 2001 20.1 20.5 20.1 18.9 21.3 16.7 19.5 18.9 20. 20.0 21.7 18.2 21.1 -16.1 -16.8 -17.8 -19.0 -15.8 -15.9 11.5 10.5 12.1 Table 2 907 9.6 12.2 11.2 6.3 1101 907 9.0 907 10018.4
8.1
1007 7.2 20.,69.6
25.4 20069.5
1105 10.2 8.29.5
8.8 1905 1904 2203 25.0 16.2 1606 -43.2-43.6
-43.0
time, and the run number on paper tape. The standard area in Mare Imbrium was observed at least once every fifteen to twenty minutes. Several runs were made
between observations of the standard spot. The effect of making standard runs no longer than about ten min-utes before or after any other run is to eliminate variable extinction error due to atmospheric effects
which have a time scale greater than ten minutes.
Higher-frequency effects can't be thus eliminated, but, due to the number of samples of most spots, are elim-inated in the data reduction.
Each spot was observed several times on a given night. In almost all cases each spot was observed on more than one night. As a check, in the data reduc-tion the standard spot runs were normalized to 0.53 microns and divided by each other. This exposes any runs in which measurement error occurred. In all but a very few cases this produced a flat curve to within about 1%.
The filter scan started at the first filter in the filter wheel (0.40 microns) and proceeded around the wheel. After a full revolution of the filter wheel,
a second observation was made with the first filter
to check for guiding error. Observations were repeat-ed if the first and last counts did not agree to within
about 1%.
The integration time was chosen long enough such that the purely statistical counting fluctuations (ff'/N, where N is the photon count) would be less than a 1%
U
The lunar radiation observed in the 0.4 to 1.1
micron range is almost entirely reflected solar
radi-ation. There is some controversy concerning the
ex-istence of temporally varying visible emission on the
moon. (McCord, 1967; Ney, Woolf, and Collins, 1966)
However, it is generally agreed that such radiation,
were it to exist, would be much less intense than the
visible reflected solar radiation.
The reflected spectrum of a material gives
inform-ation about the atomic, molecular, and crystal
struc-ture of that material. By studying the relative
re-flectivity instead of the absolute rere-flectivity,
rel-ative differences between areas on the lunar surface
become apparent. Definite information about the
com-position or physical properties is not determined.
That there are definite differences in spectral
reflectivity between different areas on the moon has
been demonstrated by several investigators (see
intro-duction). These differences could conceivably be
caused by compositional differences or by variations
in the macrostructure of the lunar surface materials.
Laboratory studies have been made (Adams and
Fil-ice, 1967; Adams, 1967) of the relationship between DISCUSSION OF SURFACE-SCATTERED RADIATION
spectral reflectivity and the physical properties of
the materials studied. Such parameters as particle
size, particle packing, and angle of illumination
were varied for a given sample, using several
dif-ferent types of rocks. Composition and particle size
were found to be the most important parameters as far
as the spectral curves are concerned.
Decreasing the average size of particles makes
them less opaque. Light scattered from a material
(down to a certain grain size) has undergone more
in-ternal reflections than if it were scattered from a
larger-grained surface of the same composition. This
effect not only increases the albedo, since more light
is scattered from the surface, but also increases the
size of the spectral features of the reflectivity
curve. To see this, consider the scattered light as
composed of two components: one which has been
scat-tered by the top-most surface layer, i.e. no
penetra-tion of grains; and one which has penetrated one or
more grains and is then reflected back. The first
component contains little spectral information, while
the second one has had imposed more strongly upon it
the spectral characteristics of the material.
Clear-ly the second component will be larger in the case in
which there are more internal reflections, i.e. when
U
seen when the particle size is decreased. If the grain size is too small, however, little spectral informa-tion is contained in the reflected light spectrum
be-cause the path length through the grains--and thus
between surface reflections--is short. Therefore much of the backscattered radiation will have passed only a short distance through the grains.
More importantly, and with greater certainty, compositional information can be deduced from spectral reflectivity. Adams and Filice (1967), after a study of laboratory data and lunar data, determined that the lunar surface could not be composed of crystalline
ac-idic rocks or glassy rocks, but might be basic rock (e.g. basalts). Only basic rocks could produce the observed minima in the absolute spectral reflectivity curves at 1 micron. (Adams, 1967)
It is believed by most authors (including the present author) that lunar spectral reflectivity dif-ferences are due mainly to compositional difdif-ferences.
DATA AND INTERPRETATIONS
The quantities of interest are the normalized relative spectral reflectivities of the various lunar areas observed. Most areas were measured enough times
so that averaged spectral curves could be plotted, with error bars representing the standard deviation
of the average. The number of samples used in calcu-lating the average curves varied from three to twelve,
while most were in a range of from five to eight.
The averaged curves with error bars, as well as curves
of spots for which not enough data exists to determine error bars, are reproduced in Appendix I. These meas-urements span a lunar phase angle range of about 20
to 110 degrees. (see Table
3)
Phase Angle
McCord (1968) observed a 2-3% increase in color contrast as the lunar phase angle increased from 0 to 90 degrees. The sizes of spectral features in the normalized relative spectral reflectivity curves in this study are greater than a few percent, so that such a small phase effect would not be expected to be very noticeable. This is indeed the case, as no
sys-tematic changes in the spectra with phase angle were seen.
Phase Angles Spot Date (UT) of Center of Moon
Date Degrees
5
8/3,4,5,29,30,31/69
8/3/69
63
9/1 8/4 751
8/4,5,298/5
87 9/1 8/29 23 17 9/1 8/30 35 33 8/30 8/3147
9/1,3 9/1 59 36 8/30,31 9/2 719/1
9/3
83
35
9/3
9/4
95
14
8/4,5
9/5
107
10 8/3,5 12 8/3,4,57
8/3,4,5
9
8/3,5
34 9/1, 3 28/4,5
18 8/3,5 9/1,3 20 8/29,30,31 9/1 11 8/5 9/3 21 8/29,30,31 9/1 25 8/29,30,31 9/1Table 3. Dates and approximate lunar phase angles of observations of some lunar areas.
Mffl~U~I~.
Compositional Mixing
Inspection of the relative reflectivity curves for areas in Copernicus and along its rays reveals
that, while the size of the spectral features varies greatly, the general curve shape is the same.
This could be indicative of compositional mixing differences. To understand this, we must consider the
components of the light reflected from a spot on the lunar surface. One component is light which is scat-tered by material which is compositionally similar to the standard spot, denoted by Il. The other is light scattered from material which is not similar to the
standard spot material, denoted by 12. The total intensity is the sum of these two components. Now
when the intensity is divided by that of the standard spot (I.), the result is:
I/is
=
I,/Is+ I22/ *The first function on the right of the equality (Il/Is) gives a flat spectrum, since it is the ratio of two sim-ilar spectra. The second function (I2/Is), when plotted against wavelength, gives the relative spectral reflect-ivity curve of two different types of materials. Thus by measuring the relative spectral reflectivity of a
similar or different, but, by determining the amount
of structure in the curves, we can determine
qualita-tively the relative amounts of different materials,
weighted by their albedos. This effect is seen to be
quite large when one examines the spectra of spots in
Copernicus and the Copernican rays, and is believed
by this author to be the major reason for differences
in the size of features.in the relative spectral
reflect-ivity curves of the areas studied.
We shall refer to the material which gives the
normalized relative spectral reflectivity curves of
areas in and around Copernicus their characteristic
structure as "Copernican material". Thus, the size
of the features of these similarly-shaped curves is
a measure of the amount of Copernican material in an
area. The larger the features, the more Copernican
material (and the less "standard Imbrium" material)
is present--relative to the total amount of
reflect-ing material.
Curve Structure
As can be viewed in Appendix I, all of the
"Cop-ernican" normalized relative reflectivity curves rise
monotonically over a range
of
0.40 to 0.63 microns. There is, in each of them, a feature in the form ofdue to a rise in the reflectivity of the Copernican spots, a dip in the reflectivity of the standard spot, or a combination of both.) There is a broad dip in the curves from about .63 to .76 microns, after which the curve becomes flatter until about .90 microns, The maximum value of relative reflectivity is reached between .76 and .85 microns. After about .90 microns, the relative reflectivity drops off rather sharply,
reaching a minimum at around 1.05 microns. There is a dip at around .95 microns, which varies in size from spot to spot. The curve starts to rise again after the 1.05 micron minimum.
The size of spectral features is what differenti-ates one curve from another. It is therefore useful to determine quantitative parameters which character-ize a given curve. A parameter--Amplitude of Spectral Features--was determined by measuring the height of
the curve maximum relative to the height at .47 microns.
It is tabulated for different spots as a percentage. (Table 4)
Amplitude and Distance
The Amplitude of Spectral Features of the Coperni-can curves was investigated as a function of the
dis-tance of the spots from the center of Copernicus. The results are seen in Figure
3.
It was found thatSpot D(km) Amplitude(%) Description 5 0 25 central peak 1
63
20 outside crater--west 17 77 20 outside--north 35 52 20 rim of crater 12 23 20 floor of crater 33 52 15-20 rim 14 23 15-20 floor 10 17 15-20 floor 7 20 15-20 floor 9 37 15-20 floor-wall36
252 15 ray--near Hortensius34
46
15
rim2
40
10-15
wall
18 74 10 outside--south 20 350 10 ray 11 40 10 wall 21 504 7 ray25 350
4
mare adjacent to rayTable
4..
Distance from the center of Copernicus, Amplitude of Spectral Features, and Description of "Copernican" spots.the Amplitude of the curves of spots located on the floor of Copernicus lies between
15
and 20 percent. This same parameter lies between 10 and 20 percent on the crater walls.A conceivable mechanism responsible for this de-crease in Amplitude on the walls is the slumping and
sliding of rock. This would expose the underlying
rock, which would not be as strongly (if at all) shocked
as the material on the crater floor. Indeed, the rock
on the walls of Meteor Crater, Arizona is the original underlying material. (Shoemaker, 1962). It would be
expected, however, that there is shocked rock on the Copernican walls, present in the terraces.
The size of the spectral features of areas far from Copernicus is less than that of areas close to
the crater. There are, however, exceptions to this trend, as is seen in Fig.
3.
It is not possible totell if a definite correlation exists, but it would appear that the amount of "Copernican" material de-creases in general as the distance from Copernicus in-creases. This conclusion is a result of the above-mentioned interpretation of amplitude differences in
the relative reflectivity curves.
Angular Distribution of Ejecta
of Copernican material, directional plots of Amplitude vs. distance from the center of Copernicus were made.
The surface plane was divided into three sectors, and an Amplitude vs. Distance plot was constructed for each
sector. Although there are fewer spots in some sectors than in others, the same apparent distribution is found in all sectors. This suggests that the angular distri-bution of Copernican material is uniform (to within the limits of the measurements). This agrees with recent studies of impact cratering. (Gault, Shoemaker, and Moore, 1963)
Albedo
Spots which are brighter than the surrounding
areas have larger-sized relative reflectivity features than do their neighboring areas. This is clearly il-lustrated in the spectra of Spots 1 and 20. Spot 1
is a bright area outside of Copernicus about 60 kilo-meters west of the central peak. The bright area is roughly circular, about the size of the aperture used. Its spectral curve is among the largest-featured of those studied. (Amplitude is greater than 20%) Spot 20 is on a bright ray of Copernicus, about 350 kilo-meters north of the crater. The size of spectral re-flectivity features of this spot (Amplitude is 10%) is greater than that of a neighboring mare spot--Spot
25 (Amplitude is
4%).
This would imply that what is called Copernican material has a relatively high al-bedo.Rays
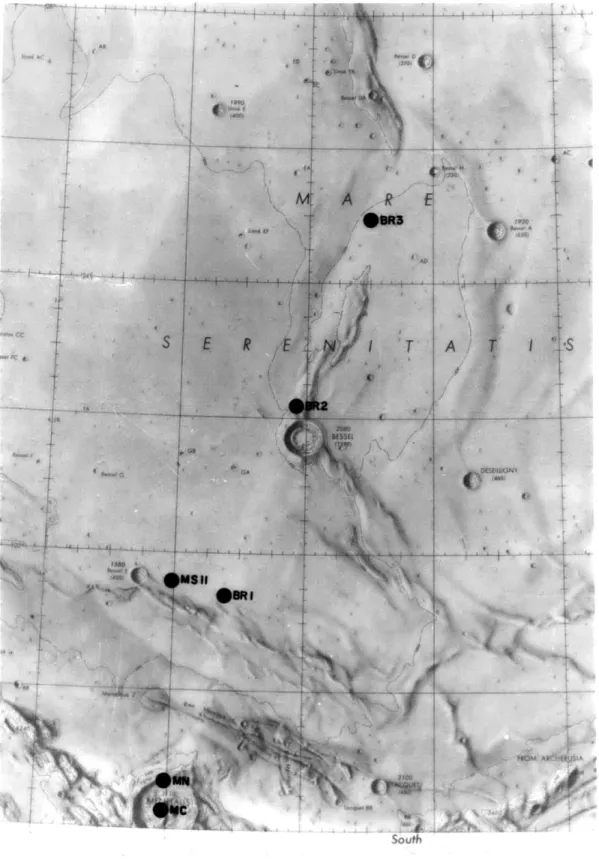
Spots were observed on and adjacent to a long ray extending north from Copernicus. (See map, Fig.
4) The normalized relative spectral reflectivity curves of the spots on the ray show larger Copernican features than do those adjacent to it (Appendix I, curves of Spots 20, 21, 25), which means that there is a rela-tively larger amount of Copernican-like material ex-posed on the ray than on the mare surface. The size of the spectral features on the ray curve (e.g. Spot
20) is still significantly less than that of spots in the crater. This would imply that the ray contains both Copernican-type material and material similar to
the material at Spot 0.
The crater rays have been interpreted as being a
layer of coarsely crushed rock ejected from the primary
crater. (Shoemaker, 1962) Within the rays are many bright secondary craters, formed by the impact of ejecta
from the primary crater. Thus, light scattered from a ray contains components scattered from: a) primary cra-ter macra-terial; and b) secondary cracra-ters and their ejecta.
fraction of the area of a ray is covered with
second-ary craters. The albedo of the rays is uniform. This means that most of the light reflected from a ray is reflected from primary crater material (i.e. material ejected from Copernicus in the case discussed here).
The observation of a mixture of Copernican and mare (standard) material on the rays (i.e. size of spectral features intermediate between Copernicus and
Spot 0) implies either (1) that the Copernican
mater-ial is a thin layer, and the mare regolith matermater-ial is "showing through"; or (2) mare material different from
the surface mare material was turned up when the Cop-ernican ejecta was deposited.
The normalized relative reflectivity spectrum of
Spot 36-- a ray area near the crater Hortensius--is
seen to have a Copernican shape. (Amplitude is great-er than
15%.
See Appendix I) This area is bright, and contains both Copernican ray material and throwout from Hortensius. These factors, and the fact that Spot 36is very close to Hortensius (and thus the mare would probably be covered with a relatively thick blanket
of Hortensius ejecta), mean that it is unlikely that very much mare-regolith material (which might be
sim-ilar in composition to Spot 0) was observed. This is
fea-Copernican implies that the material in the Hortensius area has a sizeable component which is similar in com-position to the material in Copernicus. Whether the
spectral characteristics of Copernican-type material is indigenous to an area on the lunar surface or a property of shocked rock can only be determined by studying other areas containing impact-shocked rocks.
A less intensive study was made of such areas.
Non-Copernican Areas
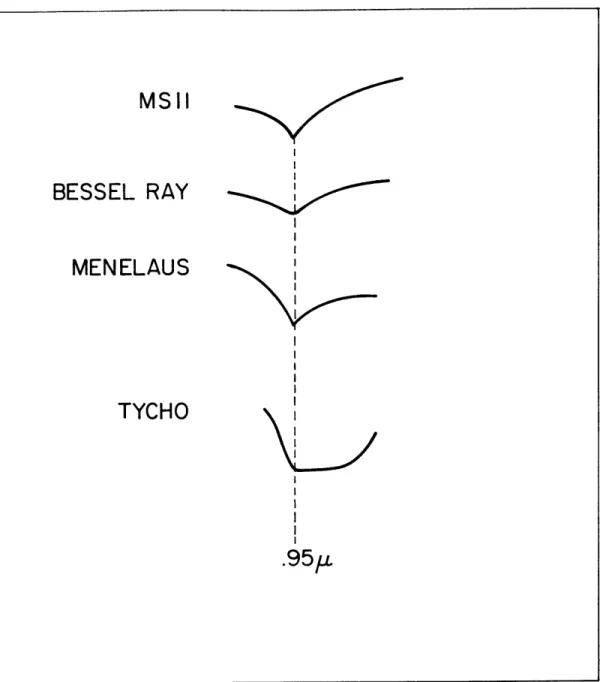
Spots were observed in Mare Serenitatis, Menelaus, Tycho, and along the prominent north-south ray across Mare Serenitatis (referred to in this study as Bessel Ray, due to its proximity to the crater Bessel). Their
normalized relative spectral reflectivity curves ap-pear in Appendix I. (See maps, Figs. 5 and 6)
The spot observed in Mare Serenitatis (Spot MSl1) has a sharp dip at 0.95 microns in its reflectivity
spectrum relative to Spot 0, then rises. The dips of the Bessel Ray Spots--BR1, BR2, and BR3--are struc-tured similarly to the MS11 dip.
The similarity of the curves implies that a major constituent of the ray is mare material, similar to Spot MS11. This is consistent with the interpretation that the underlying mare material is "showing through"
The curves of Menelaus--Menelaus Center (MC) and Menelaus North (MN)--also show a sharp dip at .95
mi-crons. These dips drop more precipitously and rise less steeply than the MS11 dip.
The Tycho spots--Tycho 1 (Tl), Tycho 6 (T6), and Tycho 11 (Tll)--display a distinctive feature. Between
.90 and
.95
microns the curves dip sharply. They then level off. Between 1.02 and 1.05 microns, there is a gradual rise, which becomes steep after1.05
microns. The dip structure of these non-Copernican areas isil-lustrated in Fig.
7.
The spectral reflectivity of a spot relative to any standard could reveal, among other things, the relative amount of non-standard material at that area.
In order to determine the amount of non-Mare Serenit-atis material in Bessel Ray and Menelaus, normalized spectral reflectivity curves of these areas were made relative to Spot MSll. It is seen in Appendix I that
the curves of Tycho relative to MSll have a very strong
1.05
micron dip, as well as a sharp maximum at about.90 microns. The Bessel Ray curves relative to MSll do not show these strong features, but are similar to the Menelaus curves.
The non-mare component of the ray, then, is large-ly Menelaus-like material. This would implarge-ly that
Bes-case, it does not seem to be compositionally similar to Tycho.
The normalized reflectivity curve shapes of Men-elaus relative to Spot MS11 are surprisingly similar to those of Copernicus relative to Spot 0. (Appendix
I) The major difference is that there is no
1.05-mic-ron dip in the Menelaus curves. (Also, the curvesrel-ative to MSll start downward a few microns before .90.) The Bessel Ray curves (again relative to MSll) show the same shape as the Menelaus curves, but have smal-ler features. They are quite similar to the spectral reflectivity curves of Copernican ray spots relative
to Spot 0. (See Spot 21 vs. Spot 0 and BR2 vs. MS11 in Appendix I)
These surprising results, were they to be more than coincidental, would suggest that the reflectivity spectrum of material in craters is transformed, perhaps
through impact-shocking , from the original spectrum (represented by the mare spectrum) in a systematic man-ner. Another possibility is that the material under
the mare surface differs systematically in composition from the surface. This "under material" is found both
* The floor of a primary impact crater contains impact-shocked material. The rays of such a crater also contain
such material. The term "shocked" refers to material which has been quasi-melted by the impact-shock process
in the crater and outside the crater, in the form of ejecta. These possibilities should be investigated
by observing rays, primary craters, and their surround-ing areas over many parts of the moon.
Summary
It has been seen that the amplitude of features of normalized relative spectral reflectivity curves seems to decrease with distance from Copernicus. This
is interpreted as a decrease in Copernican material with distance from Copernicus. Much of this material
appears to be ejecta from the crater. However, more areas away from the crater must be studied to confirm
this trend.
A result which should be further investigated is the decreased size (from crater spot features) of features of the spectral reflectivity curves of crater rays relative to surrounding maria, implying that a
large amount of underlying mare material may be
con-tained in them. The shape of these curves suggests
that a component of the ray material is
composition-ally similar to nearby craters. This may give clues as to the crater of origin of rays.
No significant lunar phase angle effect has been found in the reflectivities of Copernican spots.
similar in shape to those of Menelaus and Bessel Ray
relative to Spot MSll. The possibility of a system-atic change in spectral properties of certain rocks due to impact cratering is suggested by this
observa-tion, and should be investigated.
The distribution of ejecta from Copernicus seems
APPENDIX I
(Data)
(Note: Copernican area spots are those with just a number, e.g.
5, 36.
Non-Copernican spots have a number and a letter, or just a letter, e.g.N N a N a * SPOT 5 VS. SPOT 0 N * N SPOT I VS. SPOT 0 ' SPOT 17 VS. SPOTO 14 1.3- 1.2-1.1 - 1.0- 0.9-0.8
-
1.0- 1.02-1.1-1.0
-0.9 -=
0.8-1.1-
1.0i- 0.9-1.2 '-1.1 1.0 -1.1} 0.9 -1.1 -1.0- I 0.9 -' 1 .1 1.0 -0.9 I .1 - 1.0 - 0.9-0.35 0.45 N SPOT 36 SPOT O N N O VS SPOTO0 N- N SPOT 35 VS. SPOT 0 S 1 N SPOT 14 VS. SPOT 0 N -VS. SPOT 0 N N * SPOT 12 VS. SPOT 0 N N N SPOT 7 VS SPOT 0 I I I I | | 1 I 0.65 0.75 085 Q95 WAVELENGTH (p.) 1.05 1.15 1.5- 1.4- 1.3- 1.21.1 -0.9 S. - 1.0- 0.9-108 0.7-1.0 09 1.0 - 0.9-1.0 - 0.9:;- 1.06-0.9-r 1 .00.9 -1.0 0.9 0.9 - 0.70.6 0.5 -I | | I N l = SPOT 9 VS. SPOT 0 SPOT 34 VS. SPOT 0 SPOT 2 VS. SPOT 0 SPOT 18 VS. SPOT O SPOT 20 VS. SPOT O0SPOT I|I VS. SPOT 0
SPOT 21 VS. SPOT O0 SPOT 25 VS. SPOT 0 * SPOT 15 VS. SPOT 0 S N * SPO 2 V. SPT e *SPOT 20 VS. SPOT 0 0.35 045 0.55 0.65 0.75 Q85 0.95 1.05 1.15 WAVELENGTH (p) S N N SPOT 33 VS. SPOT 10 055 * N I I I I I I I I I I I I I I I I I I I I I I I I I I I I * * I |
0 0 SPOT 8 VS SPOT 0 SPOT 22 VS. SPOT 0 0 0 . 0 * 0 S 23S0 0 0 SPOT 23 VS SPOT 0 0 S e 3 0po S T VS.SPOTO013 1.0 0.9f 1.0-0.9 _ 0.8 -i 1--1.0 -0.9 1.1 1.0 -0.9 1 .0 -rH 0.9- 0.87-0.9 -08 ;7- 10-0.9 -0.8 r 0.9 ~ 0.8 0.9 - 0.8;-SPOT MN VS. 0.8;-SPOT 0 0.45 Q55 065 0.75 * 0 0 0 . 0 0 - 0 0.85 0.95 1.05 09 0.8 0.7 0.9 0.8 0.7 1 . 0.9 0.8 1.01 1.0 0.9 0.8 10 0.9j 1.0 0.9 -1.0 0.9 08 0.7) I1.2-1.1 1.0 0.9 0.8 0.7 0.6 0.5 WAVELENGTH (p ) e 0. . SPOT TI VS. SPOT 0 e SPOT T6 VS. SPOT 0
. SPOT Til VS SPOT 0
* SPOT MC VS SPOT MSH * 0
0 0 0
. .
* * 0
-SPOT MN VS SPOT MSIlI
P . SPOT 0.. .- SPOT 0. * 0 * SPOT BRI VS. BR2 VS. . 0 BR3 VS. 0 . 0 SPOT MSII . SPOT MSIl 0 SPOT MSII 0 0 .
SPOT TI VS. SPOT MSI
SPOT TII VS. SPOT MSII
i i i i i i i i i i i | i 035 045 0.55 0.65 0.75 0.85 0.95 1.05 WAVELENGTH (L) SPO e . . s SO * * *0*0**.0
SPOT MSII VS. SPOT 00
SPOT BRI VS. SPOT *
0 00 0 0 0 SPOT BR2 VS. SPOT O . * 0 0 *0 0 0 0 SPOT BR3 VS SPOT 0 * 0 0 0 0 O * SPOT MC VS. SPOT 0 0.35 I I
10
. . -| | I I I I I I I I I I I I Im
APPENDIX II
(Figures)
(Note: There is no Figure 2, due to an intentional omission.)
-~~ ~ - or- w- 1~:-. -1 W Wi=--l %
-g-FLOOR
30-12
8.
9
10*0
7
14
0
10
20
30
I ISLOPE
*13
34
002
Oli
OUTSIDE
>35124
'33
922
017
936
*23
*18
@20
.21
*25
I A - 4 * L I II40
50
60
70
0r
V
8IDISTANCE (KM)
I I I250 350 450 550
FIG. 3 AMPLITUDE
OF SPECTRAL
FEATURES
vs. DISTANCE
FROM CENTER
00-N3e
25,
20
15
10
5
OF
7
F IG. 6 T YCHO SPOTS
MSII
BESSEL RAY
MENELAUS
TYCHO
FIG. 7
SCHEMATIC DIP
SPOTS
SHAPES OF NON
-COPERNICAN
REFERENCES
Adams, J.B., Lunar Surface Composition and Particle Size: Implications from Laboratory and Lunar Spectral Reflectivity Data, J. Geophys. Res., 72, 5717-5720 (1967).
Adams, J.B., and Filice, A.L., Spectral Reflectance 0.4 to 2.0 Microns of Silicate Rock Powders, J. Geophys. Res., 72, 5705-5715 (1967).
Coyne, G.V., Comparative Spectrophotometry of Selected Areas on the Lunar Surface, A.J., 68, 49-56 (1963). Coyne, G.V., Differential Colors on the Moon, A.J.,
70, 115-119 (1965).
Gault, D.E., Shoemaker, E.M., and Moore, H.J., Spray Ejected from the Lunar Surface by Meteoroid Impact, NASA Technical Note D-1767 (1963).
McCord, T.B., Observational Study of Lunar Visible Emis-sion, J. Geophys. Res., 72, 2087-2097 (1967).
McCord, T.B., Color Differences on the Lunar Surface, Doctoral Dissertation, California Institute of Technology, (1968).
McCord, T.B., Color Differences on the Lunar Surface, J. Geophys. Res., 74, 3131-3142 (1969).
McCord, T.B., and Johnson, T.V., Relative Spectral Reflectivity 0.4-1 micron of Selected Areas of
the Lunar Surface, J. Geophys. Res., 74, 4395-4401, (1969).
Ney, E.P., Woolf, N.J., and Collins, R.J., Mechanisms for Lunar Luminescence, J. Geophys. Res., 71, 1787-1793 (1966).
Shoemaker, E.M., Interpretation of Lunar Craters, in Physics and Astronomy of the Moon, Z. Kopal, ed., 263-359, Academic Press, London (1962).