HAL Id: hal-00305095
https://hal.archives-ouvertes.fr/hal-00305095
Submitted on 26 Sep 2007
HAL is a multi-disciplinary open access
archive for the deposit and dissemination of
sci-entific research documents, whether they are
pub-lished or not. The documents may come from
teaching and research institutions in France or
abroad, or from public or private research centers.
L’archive ouverte pluridisciplinaire HAL, est
destinée au dépôt et à la diffusion de documents
scientifiques de niveau recherche, publiés ou non,
émanant des établissements d’enseignement et de
recherche français ou étrangers, des laboratoires
publics ou privés.
Sea ? past and possible future perspectives
C. Humborg, C.-M. Mörth, M. Sundbom, F. Wulff
To cite this version:
C. Humborg, C.-M. Mörth, M. Sundbom, F. Wulff. Riverine transport of biogenic elements to the
Baltic Sea ? past and possible future perspectives. Hydrology and Earth System Sciences Discussions,
European Geosciences Union, 2007, 11 (5), pp.1593-1607. �hal-00305095�
© Author(s) 2007. This work is licensed under a Creative Commons License.
Earth System
Sciences
Riverine transport of biogenic elements to the Baltic Sea –
past and possible future perspectives
C. Humborg1,4, C.-M. M¨orth2,4, M. Sundbom1, and F. Wulff3,4
1Dept. of Applied Environmental Science, Stockholm University, 10691 Stockholm, Sweden
2Dept. of Geology & Geochemistry, Stockholm University, 10691 Stockholm, Sweden
3Dept. of Systems Ecology, Stockholm University, 10691 Stockholm, Sweden
4Baltic Nest Institute, Stockholm University, 10691 Stockholm, Sweden
Received: 24 April 2007 – Published in Hydrol. Earth Syst. Sci. Discuss.: 23 May 2007 Revised: 3 September 2007 – Accepted: 17 September 2007 – Published: 26 September 2007
Abstract. The paper reviews critical processes for the
land-sea fluxes of biogenic elements (C, N, P, Si) in the Baltic Sea catchment and discusses possible future scenarios as a con-sequence of improved sewage treatment, agricultural prac-tices and increased hydropower demand (for N, P and Si) and of global warming, i.e., changes in hydrological pat-terns (for C). These most significant drivers will not only change the total amount of nutrient inputs and fluxes of or-ganic and inoror-ganic forms of carbon to the Baltic Sea, their ratio (C:N:P:Si) will alter as well with consequences for phy-toplankton species composition in the Baltic Sea. In sum-mary, we propose that N fluxes may increase due to higher livestock densities in those countries recently acceded to the EU, whereas P and Si fluxes may decrease due to an im-proved sewage treatment in these new EU member states and with further damming and still eutrophic states of many lakes in the entire Baltic Sea catchment. This might eventually de-crease cyanobacteria blooms in the Baltic but inde-crease the potential for other nuisance blooms. Dinoflagellates could eventually substitute diatoms that even today grow below their optimal growth conditions due to low Si concentrations in some regions of the Baltic Sea. C fluxes will probably in-crease from the boreal part of the Baltic Sea catchment due to the expected higher temperatures and heavier rainfall. How-ever, it is not clear whether dissolved organic carbon and alkalinity, which have opposite feedbacks to global warm-ing, will increase in similar amounts, because the spring flow peak will be smoothed out in time due to higher temperatures that cause less snow cover and deeper soil infiltration.
Correspondence to: C. Humborg ([email protected])
1 Introduction
The Baltic Sea is a semi enclosed basin with water residence time of some 30 years which makes this estuarine system highly susceptible to changes in riverine loads of biogenic elements (C, N, P, Si). Two major drivers, i.e., the changes in life style in the new EU member states (Poland, Estonia, Latvia and Lithuania) as well as in Russia and global warm-ing, will significantly alter the transport of biogenic elements to the Baltic Sea in the near future. These changes can be expected to be much more severe compared to the variations in riverine fluxes observed over the last 35 years (HELCOM, 2004), because changes in life style translate directly into anthropogenic nutrient emissions and riverine fluxes (Nixon, 1995; Howarth et al., 1996; Boyer et al., 2002) and the fore-seen changes in temperatures and rainfall will alter the hy-drological patterns in the catchment fundamentally (Graham, 2004). The aim of this paper is first to summarize the cur-rent knowledge on riverine nutrient and carbon fluxes in the Baltic Sea catchment, i.e., to describe leading environmen-tal variables that drive these fluxes, and secondly to discuss future scenarios on possible changes in N, P and Si land-sea fluxes as result of the adoption of EU life styles and possible changes of C fluxes as a result of climate change. In contrast to regional assessments using national data sets with vary-ing quality and evaluation tools summarized by the HEL-COM pollution load compilations (HELHEL-COM, 2004) we will use a more consistent data set on nutrient and carbon loads as well as water discharge and will use modelling tools to simulate possible future TN and TP fluxes compiled by the MARE project. This will facilitate a comparison of river-ine nutrient transports between Baltic Sea sub-catchments that differ substantially both in terms of climate, hydrol-ogy and human impacts. We will briefly summarize these tools, however, for detailed information on data used and the
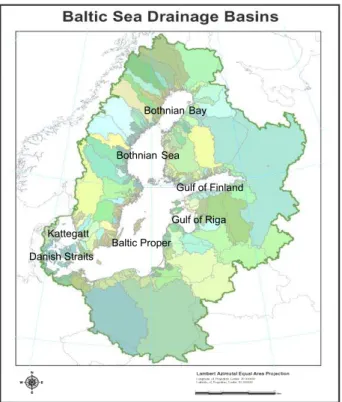
Bothnian Bay Bothnian Sea Gulf of Finland Gulf of Riga Baltic Proper Danish Straits Kattegatt
Fig. 1. Map over the Baltic Sea catchment and main watershed areas.
modelling approach the reader is referred to the MARE web-site (www.mare.su.se) and recent publications by (M¨orth et al., 2007) and (Wulff et al., 2007).
The drainage basin of the Baltic Sea can be divided into a northern boreal part that drains into the Gulf of Bothnia (Bothnian Bay=BB and Bothnian Sea = BS) and a southeast-ern part that drains into the rest of the Baltic Sea (Baltic proper = BP, Gulf of Finland = GF, Gulf of Riga = GR, Danish Sounds = D, Kattegat = KT; Figs. 1 and 2). The northern watersheds are generally densely populated and less eutrophic compared with the more populous and eutrophic watersheds of the southeast. The dominating land cover in the north is boreal forest and wetlands. The watersheds of the southeast are dominated by agriculture (Table 1; Fig. 2). River nutrient loads, especially from the Oder, Vistula, Dau-gava and Nemunas Rivers, contribute most to riverine eu-trophication of the central and southern basins of the Baltic Sea (St˚alnacke et al., 1999a). Coastal point sources are more significant for coastal eutrophication of the northern basins
and the northeastern Gulf of Finland. The most
signifi-cant coastal point sources are major cities such as St. Pe-tersburg, Helsinki and Stockholm (HELCOM, 2004). The largest mass fluxes of nutrients come from the rivers Oder and Vistula, draining Poland and its 38 million inhabitants, about half of the population of the entire Baltic Sea catch-ment (Hannerz et al., 2006).
In contrast to the north-south division of the watersheds, based on natural settings and landscape variables, an east-west distinction can be made for the socio-political char-acteristics of the watersheds. Most riparian countries are now members of the European Union, although the entry of Poland, Lithuania, Latvia and Estonia is relatively re-cent and their economies can be described as transitional. Russia has also shifted from a centralised economy. These socio-political changes are likely to have an impact on nu-trient land-sea fluxes, primarily through effects on agricul-ture, since the demand of animal protein will probably in-crease with economical growth that is indicated by relation-ship between animal protein consumption and the gross na-tional productivity (Fig. 3).
2 Results and discussion
2.1 Past and possible future changes in N and P fluxes
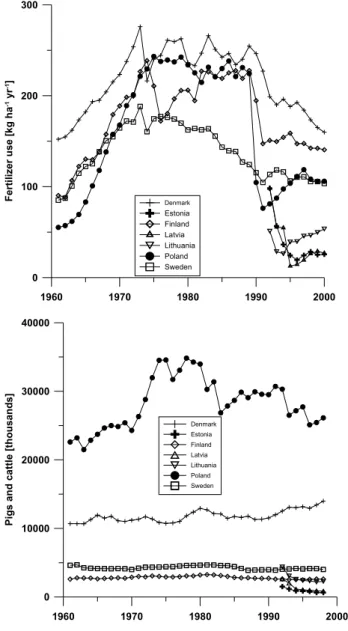
The overall nutrient load to the Baltic Sea has increased by a factor 2.4 and 3.1 for total nitrogen (TN) and total phospho-rus (TP), respectively, over the last 100 years (Schernewski et al., 2005). Significant changes in nutrient loads could be expected especially from transitional countries (Poland and the Baltic States, Czech Republic, Belarus and Russia) due to dramatic socio-economical changes. The use of fertilizer and livestock densities decreased dramatically following the economic breakdown in 1990 (Figs. 4a and b; L¨ofgren et al., 1999; St˚alnacke et al., 2003; Vagstad et al., 2004; Eriksson et al., 2007). However, the overall nutrient load to the Baltic Sea has not changed significantly during the last 30 years (Fig. 5; HELCOM, 2004, and references therein; St˚alnacke et al., 1999b) although recently decreasing trends in N and P concentrations of several minor rivers have been reported (Iital et al., 2005; Kronvang et al., 2005). Interestingly, rivers draining countries with a large N-surplus – that is all N added to a hectare sown area such as fertilizer and manure, atmo-spheric deposition and agricultural imports as feed minus all outputs such as agricultural export and human consump-tion (L¨ofgren et al., 1999; Campling et al., 2005) – actually showed decreasing TN and TP river concentrations after the collapse of the agricultural sector. Iital et al. (2005) reported decreasing trends in N concentrations of 20 Estonian rivers immediately after the drop in inorganic and organic fertil-izer use from about 200 kg ha−1yr−1 to <50 kg ha−1yr−1. In these parts of the Baltic States agricultural production was intense due to meat production that was exported to the for-mer Soviet Union (L¨ofgren et al., 1999). However, these rivers are not significant in terms of nutrient mass flux to the Baltic Sea, because all Estonian rivers draining into the Baltic Sea contribute only 4% to the TN and TP load (Ta-ble 2). Similarly, reductions in N surplus of the Danish
agri-culture from about 130 to 80 kg ha−1yr−1 and subsequent
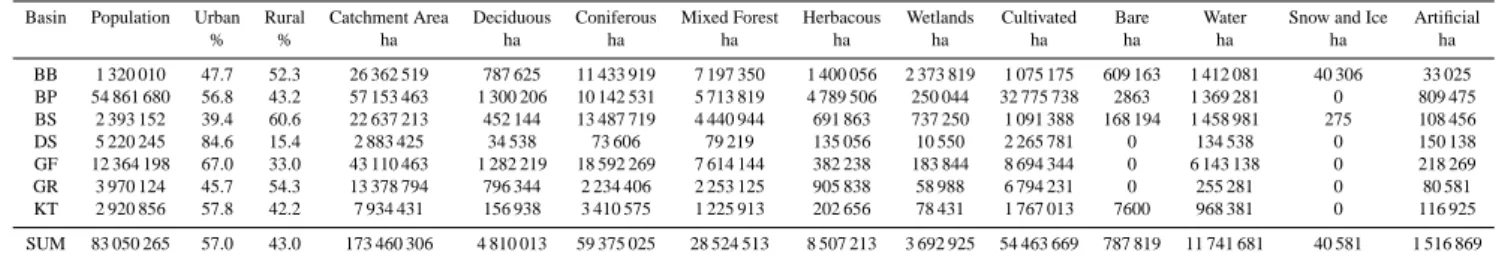
Table 1. Baltic Sea basin characteristics indicated as population, population distribution and land class areas to each of the Baltic Sea basins; Bothnian Bay (BB), Baltic Proper (BP), Bothnian Sea (BS), Gulf of Finland (GF), Gulf of Riga (GR), Danish Sounds (DS), Kattegat (KT) and to the total Baltic Sea.
Basin Population Urban Rural Catchment Area Deciduous Coniferous Mixed Forest Herbacous Wetlands Cultivated Bare Water Snow and Ice Artificial
% % ha ha ha ha ha ha ha ha ha ha ha BB 1 320 010 47.7 52.3 26 362 519 787 625 11 433 919 7 197 350 1 400 056 2 373 819 1 075 175 609 163 1 412 081 40 306 33 025 BP 54 861 680 56.8 43.2 57 153 463 1 300 206 10 142 531 5 713 819 4 789 506 250 044 32 775 738 2863 1 369 281 0 809 475 BS 2 393 152 39.4 60.6 22 637 213 452 144 13 487 719 4 440 944 691 863 737 250 1 091 388 168 194 1 458 981 275 108 456 DS 5 220 245 84.6 15.4 2 883 425 34 538 73 606 79 219 135 056 10 550 2 265 781 0 134 538 0 150 138 GF 12 364 198 67.0 33.0 43 110 463 1 282 219 18 592 269 7 614 144 382 238 183 844 8 694 344 0 6 143 138 0 218 269 GR 3 970 124 45.7 54.3 13 378 794 796 344 2 234 406 2 253 125 905 838 58 988 6 794 231 0 255 281 0 80 581 KT 2 920 856 57.8 42.2 7 934 431 156 938 3 410 575 1 225 913 202 656 78 431 1 767 013 7600 968 381 0 116 925 SUM 83 050 265 57.0 43.0 173 460 306 4 810 013 59 375 025 28 524 513 8 507 213 3 692 925 54 463 669 787 819 11 741 681 40 581 1 516 869 Legend glc250m Class_Names
Artificial surfaces and associated areas Bare areas
Cultivated and managed terrestrial areas Herbaceous, closed - pastures, natural grassl Herbaceous, open with shrubs
Lichens and mosses Mosaic: crop/ tree cover
Regularly flooded shrub and/or herbaceous Snow and ice
Sparse herbaceous or sparse shrubs Tree cover, broadleaved, deciduous, closed Tree cover, broadleaved, deciduous, open Tree cover, mixed phrenology, closed Tree cover, mixed phrenology, open Tree cover, needleleaved, evergreen, closed Tree cover, needleleaved, evergreen, open Water
Fig. 2. Land classes for the Baltic Sea catchment. For the model simulations 10 classes were used, all herbaceous areas were aggregated to one class, tree classes were divided only into deciduous forest, mixed forest and coniferous forest, leaving us with the following classes; deciduous forest, coniferous forest, mixed forest, herbaceous areas, wetlands, cultivated areas, bare areas, water, snow and ice and artificial areas.
2005; Grant et al., 2006) will not lead to a significant lower nutrient inputs into the Baltic Sea, because Danish rivers con-tribute only with 8% to the riverine TN fluxes and 5% to the riverine TP fluxes, respectively (Table 2). Larger rivers that are more significant for the nutrient land sea fluxes to the Baltic, as for example the Odra and Vistula, drain cultivated landscapes where often less N and P was used in agricul-ture. In Poland, which stands for about 30–40% of the river-ine TN and TP fluxes, respectively (Table 2), most agricul-tural land belonged to private landowners and, livestock was more evenly distributed over the country and inorganic fer-tilizer use was low during the last 50 years, i.e., between 30– 80 kg N ha−1yr−1 and 10–50 kg P ha−1yr−1 (Sapek, 1997; Eriksson et al., 2007). This was about half the amount used in Denmark or Germany (FAO, 2005). Note that in Fig. 4a total
amount of fertilizers (N, P, K) is given as an overview over the general trend; N and P fertilizer were used much less in Poland, the Baltic States and Russia compared to Denmark, Germany, Sweden and Finland (L¨ofgren et al., 1999). How-ever, for the rivers Vistula and Oder no decrease in river loads has been reported until 1998 (Witek et al., 2003; Eriksson et al., 2007), i.e., almost ten years after the drop in fertilizer use. This lack of a response pattern might be related to leak-age thresholds (Oenema et al., 1998), i.e., that agricultural soils start to leak significant more amounts of nutrient when nutrient surpluses become higher than a certain amount agri-cultural soils can buffer due to storage and denitrification. In addition, inertia of the watershed may be of relevance, since groundwater residence times may last some decades in the major watersheds. However, as will be evaluated below
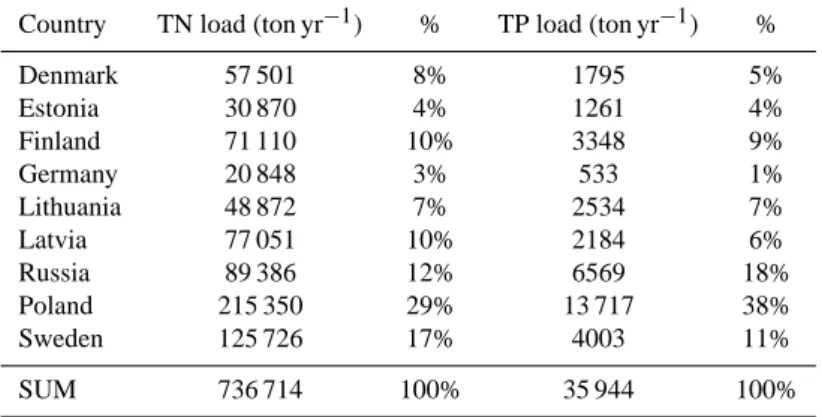
Table 2. Load of nutrients by country via rivers and coastal points sources, averaged for 1997-2003, according to data reported to HELCOM.
Country TN load (ton yr−1) % TP load (ton yr−1) %
Denmark 57 501 8% 1795 5% Estonia 30 870 4% 1261 4% Finland 71 110 10% 3348 9% Germany 20 848 3% 533 1% Lithuania 48 872 7% 2534 7% Latvia 77 051 10% 2184 6% Russia 89 386 12% 6569 18% Poland 215 350 29% 13 717 38% Sweden 125 726 17% 4003 11% SUM 736 714 100% 35 944 100% 0 10000 20000 30000 40000 GNP [$ cap-1] 40 45 50 55 60 65 70 75 A n im a l P ro te in C o n s u m p ti o n [g c a p -1 d a y -1] Belarus Denmark Estonia Finland Germany Latvia Lithuania Poland Sweden Y = 6.9 * ln(X) - 4.10548635 R2 = 0.71
Humborg et al. Fig. 3
Fig. 3. Relationship between the gross national productivity per capita (GNP) and the animal protein consumption per capita for riparian Baltic Sea countries (Data from World Bank & FAO).
in more detail, a decrease in N and P fertilizer use appears not very likely in those countries with transitional economies since a prospective growth in economy as indicated by the gross national product per capita is directly related to the consumption of animal proteins (Fig. 3) and this translates directly to the application of nutrients in the agricultural sec-tor (Nixon, 1995).
A much more promising strategy to reduce riverine nu-trient loads from transitional countries might be to connect more people to MWWTPs (Municipal Waste Water Treat-ment Plants) (Eriksson et al., 2007). MWWTPs with ter-tiary treatment were built for example in the 1990s in Poland and the percentage of the population connected to urban
Table 3. Levels of sewage treatment by country in 2004.
Country Primary Secondary Tertiary
wwt % wwt % wwt % Belarus 0 50 0 Czech Republic 0 61 0 Denmark 2 5.2 81.4 Estonia 2.2 34.4 33.6 Finland 0 0 80 Germany 0 9 85 Lthuania 33 6 18 Latvia 1.79 35.08 33.07 Norway 0 5.8 85.8 Poland 2.2 23.3 33.5 Russia 0 50 0 Sweden 0 5.8 85.8
MWWTP increase gradually from 4% in 1995 to 34% in
2004 (Table 3). However, as indicated in Table 3 there
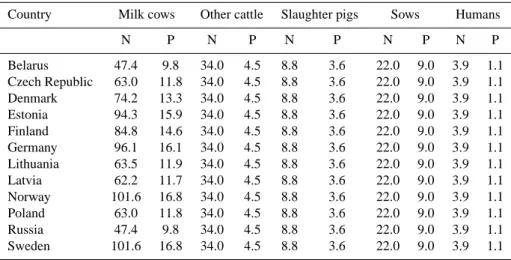
is still an enormous potential to connect people to modern sewage cleaning in the transitional countries. Although the emissions from animals that contribute significantly to the diffusive sources are several fold higher than human emis-sions (Table 4), improved cleaning of these point sources is still a huge potential for the reduction in river loads, since point sources are emitted directly into stream waters whereas emissions from manure are significantly retained in the soils (>80%) before entering the aquatic conduit (Johnes et al., 1996).
To summarize the current situation on riverine TN and TP fluxes to the Baltic Sea, there are (were) hot spots of dif-fuse sources as for example the Estonian or Danish agricul-ture where indeed reductions in nutrient loads have been ob-served as a result of a reduction in nutrient surpluses in agri-cultural areas. These hot spots are probably less significant for the nutrient mass fluxes to the Baltic Sea. A probably
Table 4. Annual emissions of nutrients from cattle (milk cows, other cattle), pigs (slaughter pigs and sows) and humans (kg unit−1year−1)
by country.
Country Milk cows Other cattle Slaughter pigs Sows Humans
N P N P N P N P N P Belarus 47.4 9.8 34.0 4.5 8.8 3.6 22.0 9.0 3.9 1.1 Czech Republic 63.0 11.8 34.0 4.5 8.8 3.6 22.0 9.0 3.9 1.1 Denmark 74.2 13.3 34.0 4.5 8.8 3.6 22.0 9.0 3.9 1.1 Estonia 94.3 15.9 34.0 4.5 8.8 3.6 22.0 9.0 3.9 1.1 Finland 84.8 14.6 34.0 4.5 8.8 3.6 22.0 9.0 3.9 1.1 Germany 96.1 16.1 34.0 4.5 8.8 3.6 22.0 9.0 3.9 1.1 Lithuania 63.5 11.9 34.0 4.5 8.8 3.6 22.0 9.0 3.9 1.1 Latvia 62.2 11.7 34.0 4.5 8.8 3.6 22.0 9.0 3.9 1.1 Norway 101.6 16.8 34.0 4.5 8.8 3.6 22.0 9.0 3.9 1.1 Poland 63.0 11.8 34.0 4.5 8.8 3.6 22.0 9.0 3.9 1.1 Russia 47.4 9.8 34.0 4.5 8.8 3.6 22.0 9.0 3.9 1.1 Sweden 101.6 16.8 34.0 4.5 8.8 3.6 22.0 9.0 3.9 1.1
much larger part of the agriculture in transitional countries around the Baltic is more like Polish agriculture, still with relatively low N and P use (Sapek, 1997) and consequently low nutrient leakage to the environment. In many transi-tional countries bordering the Baltic Sea there is a huge po-tential to reduce nutrient loads by connecting more people to MWWTPs with tertiary cleaning. However, this decrease in nutrient load might be compensated by a change in life styles and application of more TN and TP in the agriculture. To estimate the potential effects of these drivers on riverine TN and TP fluxes to the Baltic Sea, we simulated the follow-ing three scenarios: i) better sewage treatment in transitional countries, ii) the application of P-free detergents in all Baltic Sea riparian countries and iii) a more intensive livestock in transitional countries caused by an increase in animal pro-tein consumption. Note that these scenarios are no predic-tions and their objective is rather to indicate the major direc-tion of change in nutrient loads to the Baltic Sea that may probably develop as a consequence of changes in lifestyles and certain management strategies. However, despite all un-certainties involved that are mainly caused by the simplicity of the hydrological approach (see below) and the disrespect of detailed agricultural practices and future climate changes, these scenarios may well indicate the orders of magnitude of change, i.e., these scenario analyses are a scaling exercise to elucidate whether future drivers may alter land-sea nutrient fluxes by some few percent or by more significant amounts.
The decision support system NEST (Johansson et al., 2007) has been developed to analyse the effect of different management actions of the Baltic Sea. It consists of a ma-rine biogeochemical model of the entire Baltic Sea linked to a drainage basin model, which handles the various nutrient emissions from land and describes the net export to the sea. The latter model was linked to an emission database, which
allows the formulation of alternative scenarios for remedial actions. To date, such a model has been lacking on the Baltic Sea scale and a detailed description of the model, which is called CSIM model, is given in M¨orth et al. (2007). CSIM, is a lumped hydrologic model (Fig. 6) based on the generalized watershed loading function model (Haith et al., 1987) orig-inally developed to simulate streamflow, sediment, and nu-trient fluxes from mixed-use watersheds in the United States. The model was applied to the entire Baltic Sea drainage basin divided into separate watersheds (Fig. 1). This division was necessary to handle this complex ecosystem, but it required a consistent handling of emission data from more than 100 watersheds draining into the Baltic Sea. TN and TP fluxes were described by means of the water flows through various landscape types of a watershed, including surface and ground water transports. Precipitation and evapotranspiration is ap-plied to each land cover type in the Baltic Sea catchment and was estimated using the algorithms given in the origi-nal GWLF model (Haith et al., 1987). Water from each land cover type is then routed to streams both as direct surface runoff and indirectly, down through two subsurface layer compartments, as groundwater runoff; each of which con-tributes a component of stream baseflow. Thus, the stream flow consists of total surface runoff from individual land use classes in the watershed and groundwater contributions from two common groundwater compartments handling the dis-charge from the saturated zone. The uppermost of the two flow paths of groundwater discharge responds to precipita-tion relatively quickly while the lower path has a slow cli-mate response, not substantially affecting the seasonal stream water discharge pattern.
The model operates with characteristic concentrations for the various landscape types of inorganic and total N and P (dissolved inorganic nitrogen = DIN; dissolved inorganic
1960 1970 1980 1990 2000 0 100 200 300 F e rt il iz e r u s e [ k g h a -1 y r -1] Denmark Estonia Finland Latvia Lithuania Poland Sweden 1960 1970 1980 1990 2000 0 10000 20000 30000 40000 Pi g s a n d c a ttl e [th o u s a n d s ] Denmark Estonia Finland Latvia Lithuania Poland Sweden
Fig. 4. Development of fertilizer use (a) and number of livestock (b) in riparian Baltic Sea countries.
phosphorus (DIP); total nitrogen (TN) and total phosphorus (TP)) in surface and ground waters. Atmospheric deposition is not simulated dynamically, but is addressed in the type concentrations of various landscape types in the Baltic Sea catchment that the model requires to estimate nutrient trans-port. Nitrogen and phosphorus loads in stream flow are cal-culated as the product of water discharge and the specified nutrient concentrations, with the addition of three types of sources, i.e., handling of manure as well as sewage in rural respectively urban areas. Sewage is calculated from the dis-tribution of urban and rural population, the degree of connec-tion to MWWTPs and the effectiveness of their waste treat-ment. 1980 1984 1988 1992 1996 2000 300 400 500 600 D is c h a rg e [ k m 3] 400000 500000 600000 700000 T N [ to n s] 20000 25000 30000 35000 40000 45000 T P [to n s] water discharge Total Nitrogen Total Phosphorus
Fig. 5. Transport of total nitrogen (TN), total phosphorus (TP) and water discharge by major Baltic Sea rivers (n=85) over time.
Since in-stream biological uptake is not described dynam-ically in the model, the in-stream retention was fitted dur-ing model calibration by compardur-ing the net emissions into the streamwaters (that is diffuse inputs after soil retention and point sources after treatment) and the observed nutri-ent loads at the river mouth over the calibration period. The mean in-stream retention for all simulated rivers was about 15% for TN and 19% for TP. In other words, the estimated loads to rivers were about 15–20% higher on average than the measured loads at the river mouth, which is somewhat lower compared to estimates made by various model ap-proaches complied in the latest PLC (∼30% for both TN and TP; HELCOM, 2004) and by estimates in US river systems (Seitzinger et al., 2002).
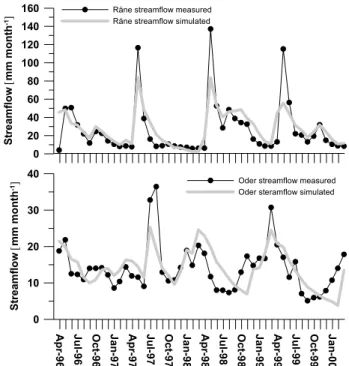
The CSIM model simulates water (streamflow) and nutri-ent fluxes (TN, TP) fairly well (M¨orth et al., 2007). The inter-annual variability of water and nutrient fluxes were reason-ably well described for the 105 watersheds where, across all watersheds and years of the validation period (1991–1995; monthly data for all variables and watersheds), 91%, 92% and 95% of the overall variability in streamflow, TN and TP, respectively, could be described by the model. CSIM was also able to describe the annual streamflow and TN loads fairly well, i.e., these fluxes were overestimated with 4% and 5%, respectively; TP loads were overestimated by 25%. Even the seasonal fluctuations of streamflow that might be crucial for TN and especially TP fluxes could be simulated reasonably well with CSIM (Fig. 7). The flow patterns of the R˚ane¨alven, an unperturbed boreal river in Northern
Swe-den draining a watersheds area of 4137 km2, were well
de-scribed and the spring peak flow in May-June was correctly
indicated by the model (R2of 0.72 between measured and
simulated values); similarly the flow patterns in the eutrophic Oder River, draining a watersheds area of 117 589 km2, were also well described and the spring peak flow in April–May
was correctly indicated by the model (R2 of 0.44 between
Forest
Herbacous Lake and streams
Cultivated areas
Ground water compartment 1 Ground water compartment 2
Precipitation
Runoff
Evapotranspiration Point sources: Manure Rural sewage Urban sewage: a) from WWTPs b) no treatment Erosion Calculated for each land class Loadings in mg l-1 Water Forest Herbacous Lake and streamsCultivated areas
Ground water compartment 1 Ground water compartment 2
Precipitation
Runoff
Evapotranspiration Point sources: Manure Rural sewage Urban sewage: a) from WWTPs b) no treatment Erosion Calculated for each land class Loadings in mg l-1 Water Loadings in mg l-1 WaterFig. 6. Model architecture for CSIM. Precipitation and evapotranspiration were applied on each of the various land covers. Water from each land cover type was routed both directly to stream flow and down to the soil water compartment. From the soil water compartment water was routed to stream flow and to the groundwater compartment, and from there on to the stream. Four types of point sources were considered. Sewage nutrient load is calculated from the distribution of the urban and rural population, and the degree of connection to WWTP and the effectiveness of the treatment (primary, secondary and tertiary).
In short, the model simulates the annual water balance for all 105 major Baltic watersheds as well as their nutrient loads from natural and anthropogenic sources. The effect of better cleaning of point sources which were estimated in scenario i) were addressed using information on the proportion of the watershed population connected to sewage treatment and in-formation on the degree of treatment, i.e. primary, secondary or tertiary treatment (Table 3). To simulate the effect of us-ing P-free detergents (scenario ii) we used the information on the distribution of urban vs. rural population in a given watershed and applied a fixed amount of emission reductions per capita. The effect of using P-free detergence by the ur-ban population is generally higher, since soil retention of ru-ral emissions (Johnes et al., 1996) was assumed higher than P retention in sewage treatment (see below). The effect of diffusive emissions influenced by man that were estimated in scenario iii) was parameterized as increased nutrient inputs from manure due to higher livestock that enter the streamwa-ter afstreamwa-ter significant soil retention (83% for TN and 97% for TP; (Johnes et al., 1996). This means that manure is simply added as an additional load to streamwater without changing groundwater type concentrations of cultivated land.
2.1.1 Scenario i
The first scenario runs on the effects of improved sewage treatment (Wulff et al., 2007) were based on averaged na-tional data on people connected to sewage systems for the period 1996–2000 retrieved from official statistics from EU-ROSTAT (http://europa.eu.int/comm/eurostat/) (M¨orth et al., 2007). Efforts by the HELCOM member countries made it possible to update this information with more recent and ac-curate data. In the current analysis we have updated data on levels of sewage treatments until 2004 (Table 3). Primary treatment was assumed to reduce the N and P loads by 19% and 15%, respectively, while secondary treatment reductions were assumed with 37.5% for N and 35% for P. Finally,
ter-0 20 40 60 80 100 120 140 160 Str e a m fl o w [ m m m o n th -1]
Råne streamflow measured Råne streamflow simulated
A p r-9 6 J u l-9 6 O c t-9 6 J a n -9 7 A p r-9 7 J u l-9 7 O c t-9 7 J a n -9 8 A p r-9 8 J u l-9 8 O c t-9 8 J a n -9 9 A p r-9 9 J u l-9 9 O c t-9 9 J a n -0 0 0 10 20 30 40 Str e a m fl o w [ m m m o n th
-1] Oder streamflow measured
Oder steramflow simulated
Fig. 7. Seasonal simulations and measured monthly streamflow for (a) the unperturbed high altitude R˚ane watershed and (b) the culti-vated watershed of the Oder.
tiary treatment was assumed to remove 80% and 90% of N and P, respectively (values are taken from EUROSTAT). We have also through informal discussions with Russian and Be-larusian scientists updated these data, assuming that 50% of the populations in the Baltic Sea drainage basins of these countries are now connected to secondary sewage treatment. In our scenario calculations, we have assumed that no further improvement will occur in the Nordic countries or Germany, compared to 2004. The other countries will have an improve-ment in sewage treatimprove-ment, corresponding to 80% and 90% of
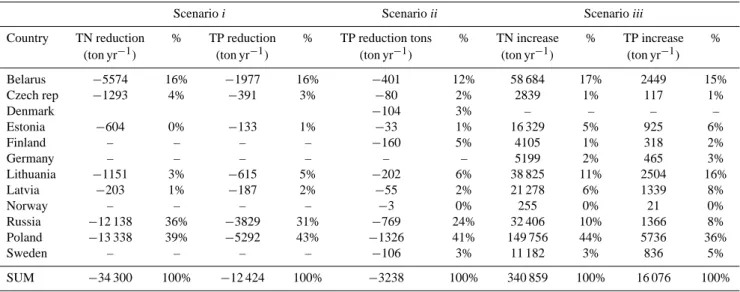
Table 5. Load reductions/increase of nutrients by country anticipated under the various scenarios i–iii.
Scenario i Scenario ii Scenario iii
Country TN reduction % TP reduction % TP reduction tons % TN increase % TP increase %
(ton yr−1) (ton yr−1) (ton yr−1) (ton yr−1) (ton yr−1)
Belarus −5574 16% −1977 16% −401 12% 58 684 17% 2449 15% Czech rep −1293 4% −391 3% −80 2% 2839 1% 117 1% Denmark −104 3% – – – – Estonia −604 0% −133 1% −33 1% 16 329 5% 925 6% Finland – – – – −160 5% 4105 1% 318 2% Germany – – – – – – 5199 2% 465 3% Lithuania −1151 3% −615 5% −202 6% 38 825 11% 2504 16% Latvia −203 1% −187 2% −55 2% 21 278 6% 1339 8% Norway – – – – −3 0% 255 0% 21 0% Russia −12 138 36% −3829 31% −769 24% 32 406 10% 1366 8% Poland −13 338 39% −5292 43% −1326 41% 149 756 44% 5736 36% Sweden – – – – −106 3% 11 182 3% 836 5% SUM −34 300 100% −12 424 100% −3238 100% 340 859 100% 16 076 100%
N and P removal, respectively, i.e. this scenario refers to the best available technique. The drainage basin model (M¨orth et al., 2007) yields the following 5-year mean load reductions to the different basins from each country into the corresponding drainage basins. The overall TN load (Table 2) according to this scenario will be reduced by 5% (minus 34 000 tons yr−1;
Table 5) and the TP loads by 35% (minus 12 000 tons yr−1;
Table 5). The higher relative effect (%) of improved sewage treatment on TP fluxes compared to TN fluxes to the Baltic Sea can be explained by the dominance of diffusive sources for the TN fluxes that constitute roughly 60% of the total emissions (M¨orth et al., 2007; HELCOM, 2004) and a more drastic decrease in TP fluxes (minus 90%) from point sources compared to TN fluxes (minus 80%) using tertiary cleaning. No reductions occur in the Bothnian Bay or Bothnian Sea, the Danish Sounds or Kattegat since direct loads to these basins originate only from the Nordic countries and Germany (Danish Sounds). The largest reduction of both TP and TN load with improved sewage treatment is from Poland (43%; 39%), followed by Russia (31%; 36%) and Belarus (16%; 16%) (Table 5). The effect of improved sewage treatment can be observed immediately as has been shown for N in the Oder and Vistula watersheds (Eriksson et al., 2007), since sewage treatment has been improved in Poland substantially within the last ten years. Thus, a possible time frame to reach scenario i could be several years only.
2.1.2 Scenario ii
P contributions from the use of phosphates in detergents are largely dependent on use patterns, marketing conditions and the adoption of specific conditions on the use of phosphates in detergents either through regulatory or voluntary agree-ments. It is likely that these numbers will vary between
countries. The annual contribution from detergents range from 0.13 to 0.22 kg per person (Zessner et al., 2005) and we have chosen to run the scenario where P emissions are reduced by 0.2 kg per person and year. This number has been obtained from a study in the Danube watershed, since no detailed information about the Baltic Sea riparian coun-tries could be retrieved. However, the Danube watershed consists also of a similar mixture of western type economies and countries with economies in transition. The total P load reductions to the Baltic Sea amount to about 3200 tons P yr−1 and the highest effects will be achieved in Poland (minus 1300 tons P yr−1; Table 5) that has the largest population. Since P free detergents can be introduced rather quickly in all riparian countries and will decrease the emissions to and from MWWTPs immediately, the time frame to fulfil sce-nario ii could be several years only.
2.1.3 Scenario iii
In the last scenario we estimated the effects of a denser live-stock in those counties recently assessed to the EU. During the last century, agricultural practices have change dramati-cally. New technologies, crops, animal breeding and, partic-ularly, the introduction of artificial fertilizers, have increased productivity enormously. At the same time, consumer prefer-ences have changed dramatically towards a large proportion of meat in human consumption. These changes have been most pronounced in the western countries (Fig. 3) but simi-lar changes are now occurring in the new EU member states, as well as in Russia and Belarus. Higher living standards and EU agricultural subsidies are driving this development. In this scenario we have assumed that all countries around the Baltic Sea will develop their agriculture to the same state as in Denmark, the country that is leading in terms of
agricul-Table 6. Livestock density in the Baltic Sea catchment by country.
Country Catchment Area ha Cultivated are ha Pigs Pigs/ha Cattle Cattle/ha
Belarus 8 918 570 5 134 108 1 283 615 0.25 1 034 096 0.20 Czech Rep 954 174 612 990 541 260 0.88 208 048 0.34 Denmark 2 696 949 2 191 004 7 022 347 3.21 1 202 578 0.55 Estonia 4 491 244 1 984 645 262 188 0.13 274 278 0.14 Finland 30 273 828 2 689 822 1 122 538 0.42 933 285 0.35 Germany 2 624 100 1 867 206 1 832 271 0.98 1 016 576 0.54 Latvia 6 478 096 3 277 510 500 635 0.15 540 289 0.16 Lithuania 6 469 354 4 012 765 832 187 0.21 832 195 0.21 Norway 1 394 112 122 225 71 841 0.59 56 765 0.46 Poland 32 207 281 20 677 731 17 167 399 0.83 6 615 023 0.32 Russia 33 005 131 8 261 300 898 546 0.11 945 341 0.11 Sweden 43 927 634 3 625 003 2 125 061 0.59 1 676 599 0.46 Grand Total 173 440 472 54 456 309 33 659 887 0.62 15 335 072 0.28
tural development. More specifically, we assume that each country will have the same number of milk cow and other cattle, sows and slaughter pigs per agricultural areas as in Denmark (Table 6). This would imply a massive increase in livestock densities in the transitional countries as expressed in animals per hectare, i.e., for pigs an increase between a factor of 4–30 and for cattle between a factor of 1.6–5 (Ta-ble 6). Moreover, the productivity, in term of meat and milk per animal will increase to Danish levels, which also means that nutrient excretion per unit animal will increase (Table 4). In this “pessimistic” scenario we also assumed that sewage treatment will remain at the 2004 levels and no further re-striction in the use of P in detergents will be implemented. The effect of this massive life stock increase could result in an increase of the order of 16 000 tons TP and 340 000 tons TN (Table 5) which corresponds to roughly a 50% increase in total river loads (Table 2).
As mentioned already, this scenario tries to scale a possi-ble change in loads due to increased livestock, rather than to give exact numbers. Since uncertainties to address fu-ture scenarios on diffuse sources such as from agriculfu-ture are much more difficult to handle compared to future estimates on point source emissions, scenario iii has to be treated with caution. The exact increase in nutrient loads will be a func-tion of agricultural practices, such as farm sizes, the stor-age and handling of manure or whether livestock is held in modern stables or outdoor as well which kind of livestock (slaughter cattle or milk cows, slaughter pigs or sows) at which production level will be used. However, it is obvious that those rivers draining cultivated land with high livestock and meat production as in the Baltic Sates (L¨ofgren et al., 2000) were the only rivers within the Baltic Sea catchment that had similar elevated N and P concentrations as found in western Europe and these rivers showed an immediate re-sponse in nutrient loads after livestock reductions (Iital et al.,
2005). Thus, a change in livestock is apparently a driver that can be observed in river chemistry rather quickly. Hence, a rather fast switch back to former nutrient loadings appears reasonable when livestock densities will rise again and these numbers may even exceed former values, since western type agricultural practices as now introduced everywhere in the transitional countries are even more intense in N and P use compared to the conditions prior to the political changes in 1989. In contrast, changes in climate might decrease wa-ter runoff to the Baltic in the southeaswa-tern catchments of the Baltic Sea with some 15% (Graham, 2004), which may sig-nificantly influence nutrient fluxes from this part of the Baltic Sea catchment, since N and P loads to the Baltic Sea are highly correlated with the water discharge (Fig. 5). How-ever, CSIM does not parameterize changes in water pathways that may probably come along with warmer temperatures and changes in groundwater tables, and these drivers are beyond the scope of this scenario analysis. In the same vein, the time frame of such a scenario is highly unknown, but since manure emissions are diffuse emissions, an increase in ma-nure can only be observed on longer time scales, i.e. decades, compared to the effects addressed under scenario i and ii.
2.2 Past and possible future changes in Si fluxes
From several studies in boreal and sub arctic Swedish watersheds we hypothesized that perturbed surface water-groundwater interactions as a consequence of the hydrolog-ical alterations in the rivers of the northern watershed of the Baltic lead to changes in weathering conditions. Thus, less weathering may be the major reason for the reduced DSi loads observed in these oligothrophic boreal rivers (Hum-borg et al., 2000; Hum(Hum-borg et al., 2002; Hum(Hum-borg et al., 2006b). Particle trapping of biogenic silica (BSi) – that is mainly diatom shells – behind dams is the main reason for the
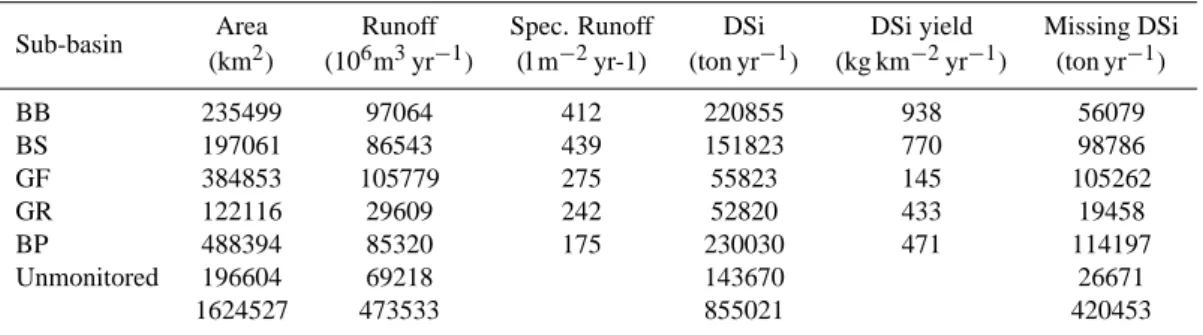
Table 7. DSi annual inputs and potential missing DSi loads divided by Baltic Sea subbasin (BB=Bothnian Bay, BS = Bothnian Sea, GF = Gulf of Finland, GR = Gulf of Riga, BP = Baltic proper).
Sub-basin Area Runoff Spec. Runoff DSi DSi yield Missing DSi
(km2) (106m3yr−1) (l m−2yr-1) (ton yr−1) (kg km−2yr−1) (ton yr−1)
BB 235499 97064 412 220855 938 56079 BS 197061 86543 439 151823 770 98786 GF 384853 105779 275 55823 145 105262 GR 122116 29609 242 52820 433 19458 BP 488394 85320 175 230030 471 114197 Unmonitored 196604 69218 143670 26671 1624527 473533 855021 420453
Humborg et al. Fig. 8
Fig. 8. DSi concentrations of major rivers classified by the major basins of the Baltic Sea they run to (BB = Bothnian Bay, BS = Bothnian Sea, GF = Gulf of Finland, GR = Gulf of Riga, BP = Baltic proper, KA = Kattegat).
reduced Si loads in the cultivated watersheds of the southern catchment of the Baltic (Humborg et al., 2006b). Thus, the main processes behind the reduced DSi loads to the Baltic Sea were described, but an overall estimate on the effects of both processes for the reduction of the overall Si load to the Baltic Sea is still missing.
DSi yields of the major rivers were about twice as high in the northern boreal and sub arctic part of the Baltic catch-ments compared to the agriculture dominated and eutrophied southeastern catchments (Table 7). Expressed in concentra-tions the rivers of the BB, BS, GF, GR, BP and KA showed median concentrations of 118, 100, 91, 70, 60 and 79 µM, respectively (Fig. 8), all far below the world average DSi
concentration of 156 µM (Treguer et al., 1995). In fact, they show the opposite patterns to what is expected, since it is well known that chemical weathering rates of silicate min-erals are related to temperature (Meybeck, 1979; Berner et al., 1995). Many watersheds of the northern part are affected mainly by damming and the area weighted sub catchment yields are much less than observed in unperturbed rivers of the area. The extreme low DSi yield of the Gulf of Fin-land catchment is caused by the disproportional large River Neva draining the eutrophied Lake Ladoga (Rukhovets et al., 2003) that probably sequesters DSi efficiently. Low yields were also observed for those rivers of the eutrophied catch-ments of the Gulf of Riga and the Baltic proper that have high percentages in lake area and/or are dammed. The effects of BSi particle trapping occurring in the southeastern rivers to-gether with the massive hydrological alterations in the north-ern rivers have lead to a DSi load reduction by approximately one third from 1.28 million tons in the early 1900s to about 0.85 million tons today (Table 7).
These estimates are based on monthly measurements (1980–2000) on DSi loads from 83 major rivers (Fig. 1) run-ning into the Baltic Sea that have been used to calculate DSi yields (kg DSi km2yr−1)to the various Baltic Sea basins. To calculate unperturbed potential DSi yields for all these wa-tersheds we assumed pristine yields for each geological sub-region of the Baltic catchment: Both Sweden and Finland have acid volcanic and plutonic acid rocks and we chose the Rivers Kalix¨alven (1261 kg km2yr−1)for Swedish rivers and Kiiminkijokki (1266 kg km2yr−1) for Finnish rivers as unperturbed backgrounds. Sedimentary rocks dominate the southern and eastern part of the Baltic Sea catchment. We calculated a potential yield of 704 kg km2yr−1for the south-ern part (non to semi consolidated sedimentary rocks) based on bimonthly observations (2003–2004) of DSi and biogenic silica (BSi). BSi is a substantial part of the total Si load (median of about 50 µM; Humborg et al., 2006) in the un-dammed Oder River and was included in the calculations of Si yields. For the eastern part (consolidated sedimentary rocks), we chose the River Gauja and a potential yield of
668 kg km2yr−1was estimated based on actual DSi observa-tions and assumed contribution of BSi as in the similar eutro-phied River Oder. Thereafter, we normalised each watershed yield against the specific runoff and temperature differences to the pristine yield of the geologic area:
DSipot=DSinorm×
runoffobs
runoffnorm × 1.08
(tobs−tnorm) (1)
where DSipot is the potential unperturbed DSi yield
[kg km−2yr−1] of the watershed, DSi
normis the pristine yield of the geologic area, runoffobs, runoffnormand tobs, tnormare the specific runoff [l m−2yr−1] and average annual tempera-ture [◦C] of the watershed and the pristine watershed, respec-tively. The temperature differences between the watersheds were multiplied by a factor 1.08, taking into account an in-crease in weathering of about 8% per degree Celsius for pla-gioclase (Lasaga, 1998), a representative silicate mineral for the entire area. The catchments with eutrophied large lakes namely the Rivers Neva, Motalastr¨om and Norrstr¨om we as-sumed a decrease in DSi loads by a factor 4 similar as has been observed in the Great Lakes (Schelske et al., 1983); a more conservative estimate than would have resulted from normalization. Finally, we subtracted the observed DSi yield (Table 7) from the potential unperturbed DSi yield of all watersheds to calculate the missing DSi loads (Table 7) to the Baltic Sea that were further aggregated to sub catchment scale.
Future perspectives on DSi fluxes are difficult to estimate in terms of quantitative estimates with the current informa-tion on future energy demands at hand, however, DSi loads to the Baltic Sea will probably continue to decrease, since many more dams might be erected due to an increasing demand of hydropower (Lehner et al., 2005) during the next decades. Highest effects of hydropower can be foreseen in Sweden and Finland that constitute the major part of the boreal catch-ment of the Bothnian Bay and Bothnian Sea, since the spe-cific discharge is much higher compared to the cultivated part of the Baltic Sea catchment (Table 7) and water discharge is expected to increase due to higher rainfall with global warm-ing (Graham, 2004). The status of low DSi loads from the southern part of the Baltic Sea might be conserved due to a similar eutrophication status of lakes and reservoirs, a further eutrophication as envisioned in the higher livestock scenario (see above) might however further decrease DSi loads to the Baltic Sea also from the cultivated watersheds. Thus, a fur-ther decrease in DSi river loads to the Baltic Sea may drive the decreasing DSi concentrations in the Baltic Sea (Hum-borg et al., 2006a) to concentrations where diatom growth becomes suboptimal (Egge et al., 1992).
2.3 Past and possible future changes in dissolved organic
and inorganic C fluxes
It is estimated that about 455 Pg C is stored in northern peat-lands, corresponding to about 30% of all soil C on Earth or to
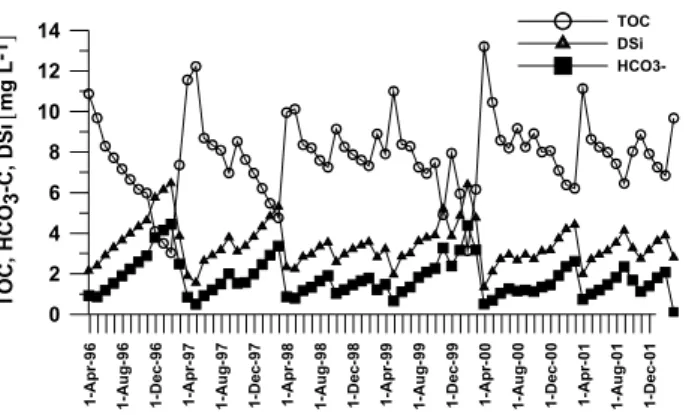
1 -A p r-9 6 1 -A u g -9 6 1 -D e c -9 6 1 -A p r-9 7 1 -A u g -9 7 1 -D e c -9 7 1 -A p r-9 8 1 -A u g -9 8 1 -D e c -9 8 1 -A p r-9 9 1 -A u g -9 9 1 -D e c -9 9 1 -A p r-0 0 1 -A u g -0 0 1 -D e c -0 0 1 -A p r-0 1 1 -A u g -0 1 1 -D e c -0 1 0 2 4 6 8 10 12 14 T O C , H C O3 -C , D S i [ m g L -1] TOC DSi
HCO3-Fig. 9. Seasonal patterns of TOC, DSi and alkalinity in the R˚ane¨alven.
about 70 years of global annual anthropogenic C emissions (Gorham, 1991). Temperature increases above the global av-erage have been predicted at high latitudes in the northern hemisphere and increases in temperature and water discharge have already been recorded in the largest Eurasian rivers (Pe-terson et al., 2002). Similar trends were also foreseen for the boreal and subarctic part of the Baltic Sea catchment (Gra-ham, 2004) and the unperturbed boreal rivers of the Baltic re-gion can be regarded as model systems for the large Siberian rivers since biogeochemical characteristics of the watersheds are similar (Humborg et al., 2004; Smedberg et al., 2006). More recently, work has focused on the role of hydrological interactions with the C budget of entire landscapes. It has been argued (Freeman et al., 2001; Evans et al., 2002; Tran-vik et al., 2002) that a change in climate and hydrology in high latitude regions could liberate large amounts of previ-ously inactive C during a prolonging thawing period as total organic C (TOC) or dissolved organic C (DOC), and new studies in Swedish lakes have shown that a great deal of this organic C is mineralized as CO2(Sobek et al., 2005) or CH4 during its transport to the sea. Whereas TOC export can be described as a function of water discharge, i.e., flushing of organic rich top soils (podzols are dominating) during spring flood (Boyer et al., 1996; Smedberg et al., 2006), gaseous fluxes are also positive related to soil moisture and evapotran-spiration (Walker et al., 1998) that will increase with global warming. However, even during frozen periods, streamflow is dominated by “old” groundwater. This water has perco-lated through the soils and is rich in dissolved solids and bi-carbonate; that is derived from atmospheric C that has been “consumed” during chemical weathering, and is partly ex-ported as bicarbonate to the sea, where this C is stored as
CaCO3for geological time. These current patterns of TOC
and alkalinity fluxes (mainly bicarbonate in Swedish and Fin-ish rivers) are exemplified by the R˚ane¨alven (Fig. 9). Note that weathering products alkalinity and DSi peak during win-ter when groundwawin-ter contribution to stream flow is maxi-mum and TOC peaks during spring flow when top soils are
Latitude -0.2 0 0.2 0.4 0.6 0.8 T O C c h a n g e [m g y r -1] 56 58 60 62 64 66 68
Fig. 10. Trends (30 year monthly observations) in TOC concentra-tions in Swedish rivers as a function of latitude.
flushed. The bicarbonate export of some wetland and conif-erous forest watersheds investigated in the Baltic Sea region
was between 0.4 and 1.2 tons C km−2yr−1corresponding to
15–73% of the TOC export (Smedberg et al., 2006).
More-over, bicarbonate export exceeds by far the CO2outgassing
in Swedish sub arctic and boreal watersheds. We roughly cal-culated for Sweden that about 150 000 tons C are leaving the aquatic systems via outgassing (2.5 g m−2yr−1(Algesten et
al., 2004) from all Swedish lakes vs. 600 000 tons HCO3-C
that are produced by weathering reactions between soil CO2
from respiration and mainly Si containing minerals and that are exported by all Swedish rivers. In other words the aquatic conduit in Sweden might be a sink for atmospheric C, not a source.
Very likely, global warming will affect water flow through the soils in taiga and tundra ecosystems (Hinzman et al., 2005) and, thus, will have an effect on watershed C bud-gets. An increasing trend in TOC fluxes is obvious from the monthly observations of TOC concentrations at the river mouth of major Swedish rivers for the period 1980–2005 (Fig. 10). The positive trend is visible until about mid Swe-den whereas the far northern watersheds do not show any change in TOC concentrations over the last 25 years. The re-gional patterns of this TOC increase fits with observation of an earlier ice break up in Swedish lakes (Weyhenmeyer et al., 2004) that is also confined to the southern part of Sweden. This might indicate that global warming has reached until about 62 degrees North in Sweden with respect to observed changes in hydrological patterns and river biogeochemistry. However, this TOC trend might also be related to less at-mospheric deposition of S and N forming strong acids in
soils and the related increase in soil pH that happened si-multaneously. As Evans et al. (2006) reported, an increase in soil pH, as an effect of recovery from acidification, may lead to a stronger leakage of DOC from organic rich soils. However, bicarbonate export may compensate for significant
amounts of the exported TOC (as DOC or respired to CO2
and CH4), thereby reducing the positive feedback to atmo-spheric CO2. Recent simulation studies showed that the air
temperatures might increase with some several ◦Celsius in
the northern boreal catchment of the Baltic Sea, along with an increase in precipitation especially in the Swedish part of the watershed. This will alter the entire discharge pat-terns of these boreal and sub arctic watersheds with a signifi-cant higher runoff and a much prolonged spring flow starting much earlier in the season, but with a less pronounced peak flow (Graham, 2004), within the next decades. Nowadays, roughly half of the runoff in boreal and sub arctic rivers is generated within a few weeks in May and June, flushing es-pecially topsoils that are rich in organic matter. Weathering products such as dissolved solids and alkalinity are associ-ated mainly with groundwater (Fig. 9) and highest concentra-tions are measured during winter (base flow). Thus, the flow paths and transit times of waters through various landscapes and associated soil types determine the water chemistry of boreal aquatic systems and a change in these pathways can be foreseen with global warming. An increase in runoff may either flush even more topsoil leading to a massive release of organic matter or percolate deeper into soils and increasing weathering due to deeper thawing of permafrost areas. The significance of both processes for the overall C budgets is yet not known.
3 Conclusions
Probable changes in life styles, increased demand of hy-dropower and global warming may change the nutrient ratios in the Baltic Sea in the near future lading to improved growth conditions for mainly dinoflagellates since TN loads may in-crease, TP may remain at today’s level or even decrease and Si might decrease. Thus, the N:P ratio and N:Si ratio may in-crease in the Baltic Sea. An inin-crease in N:P ratios will milder the N limitation during spring giving room for an higher up-take of P in spring with lower P residuals for the cyanobac-teria that bloom during summer (Vahtera et al., 2007). A de-crease in N:Si ratios may favour non-siliceous blooms such as observed in the Black Sea and elsewhere (Humborg et al., 2000). TN loads to the Baltic will probably increase due to a change in human food consumption (more animal protein demand) that may foster higher livestock in the transitional countries of the Baltic Sea. Although the increase in TN loads may not be as high as we have foreseen in our most pessimistic scenario (an increase of 340 000 tons yr−1)it ap-pears obvious that a change in these diffusive emissions can hardly be compensated by a potential decrease in TN loads as
a result of an improved sewage treatment that we estimated to be one order of magnitude lower (about 34 000 tons yr−1) than the potential increase from livestock emissions. These latter emissions will also increase the TP loads but to a lesser extent compared to TN loads, since soil retention for P from manure is much higher than for N. Thus, the potential TP in-crease from manure can be easily compensated by improved sewage treatment that is much more efficient for P compared to N. Our pessimistic scenario for the development of live-stock in transitional countries revealed a TP increase of some 16 000 tons yr−1that can be compensated if the transitional countries reach the same standard in sewage cleaning as Swe-den that could decrease TP emissions by the same amounts. Whether the transitional countries will have a livestock den-sity as high as Denmark might be too pessimistic whereas the installation of tertiary cleaning of point sources is increasing with several % per year, thus, P load might decrease sig-nificantly in the near future. That DSi loads will decrease further due to a general trend in energy policy substituting energy from fossil fuels by renewable energy sources and the enlargement of hydropower is definitely a realistic pos-sibility in the Baltic Sea catchment. It is also likely that the riverine loads of both organic and inorganic forms of carbon (DOC and alkalinity) will increase from the boreal part of the Baltic Sea catchment, due to higher runoff and deeper soil in-filtration of rain and melt water. This will increase the DOC concentration that is already high in the Baltic Sea. This, in turn, will influence significantly light conditions for phy-toplankton growth and the entire food web in the Bothnian Bay and Bothnian Sea, since allochthonous organic carbon is a main energy source for the pelagic food web (Sandberg et al., 2004). Whether alkalinity may increase or decrease is difficult to evaluate, since a higher riverine input might be compensated by a potential higher freshness of the Baltic Sea when total river runoff will increase (Winsor et al., 2001).
Edited by: A. Ducharne
References
Algesten, G., Sobek, S., Bergstrom, A. K., Agren, A., Tranvik, L. J., and Jansson, M.: Role of lakes for organic carbon cycling in the boreal zone, Global Change Biol., 10, 141–147, 2004. Berner, E. K. and Berner, R. A.: Global Environment: Water, Air
and Geochemical Cycles, Prentice Hall, 1995.
Boyer, E. W., Hornberger, G. M., Bencala, K. E., and McKnight, D.: Overview of a simple model describing variation of dissolved organic carbon in an upland catchment, Ecol. Model., 86, 183– 188, 1996.
Boyer, E. W., Goodale, C. L., Jaworski, N. A., and Howarth, R. W.: Anthropogenic nitrogen sources and relationships to riverine nitrogen export in the northeastern USA, Biogeochemistry, 57, 137–169, 2002.
Campling, P., Terres, J. M., Walle, S. V., Van Orshoven, J., and Crouzet, P.: Estimation of nitrogen balances from agriculture
for EU-15: spatialisation of estimates to river basins using the CORINE Land Cover, Phys. Chem. Earth, 30, 25–34, 2005. Egge, J. K. and Aksnes, D. L.: Silicate as Regulating Nutrient in
Phytoplankton Competition, Mar. Ecol.-Prog. Ser., 83, 281–289, 1992.
Eriksson, H., Pastuszak, M., L¨ofgren, S., M¨orth, C.-M., and Hum-borg, C.: Nitrogen budgets of the Polish agriculature 1960-2000: implications for riverine nitrogen loads to the Baltic Sea from transitional countries, Biogeochemistry, 85, 153–168, 2007. Evans, C. D., Freeman, C., Monteith, D. T., Reynolds, B., and
Fen-ner, N.: Climate change – Terrestrial export of organic carbon – Reply, Nature, 415, 862–862, 2002.
Evans, C. D., Chapman, P. J., Clark, J. M., Monteith, D. T., and Cresser, M. S.: Alternative explanations for rising dissolved or-ganic carbon export from oror-ganic soils, Global Change Biol., 12, 2044–2053, 2006.
Freeman, C., Evans, C. D., Monteith, D. T., Reynolds, B., and Fen-ner, N.: Export of organic carbon from peat soils, Nature, 412, 785–785, 2001.
Gorham, E.: Northern Peatlands – Role in the Carbon-Cycle and Probable Responses to Climatic Warming, Ecol. Appl., 1, 182– 195, 1991.
Graham, L. P.: Climate change effects on river flow to the Baltic Sea, Ambio, 33, 235–241, 2004.
Grant, R., Nielsen, K., and Waagepetersen, J.: Reducing nitrogen loading of inland and marine waters – Evaluation of Danish pol-icy measures to reduce nitrogen loss from farmland, Ambio, 35, 117–123, 2006.
Haith, D. A. and Shoemaker, L. L.: Generalized Watershed Loading Functions for Stream-Flow Nutrients, Water Resour. Bull., 23, 471–478, 1987.
Hannerz, F. and Destouni, G.: Spatial characterization of the Baltic Sea Drainage Basin and its unmonitored catchments, Ambio, 35, 214–219, 2006.
HELCOM: The fourth Baltic Sea pollution load compilation (PLC-4), Baltic Sea Environment Proceedings, Baltic Sea Environment Proceedings, 93, 133 pp., 2004.
Hinzman, L. D., Bettez, N. D., Bolton, W. R., Chapin, F. S., Dyurg-erov, M. B., Fastie, C. L., Griffith, B., Hollister, R. D., Hope, A., Huntington, H. P., Jensen, A. M., Jia, G. J., Jorgenson, T., Kane, D. L., Klein, D. R., Kofinas, G., Lynch, A. H., Lloyd, A. H., McGuire, A. D., Nelson, F. E., Oechel, W. C., Osterkamp, T. E., Racine, C. H., Romanovsky, V. E., Stone, R. S., Stow, D. A., Sturm, M., Tweedie, C. E., Vourlitis, G. L., Walker, M. D., Walker, D. A., Webber, P. J., Welker, J. M., Winker, K., and Yoshikawa, K.: Evidence and implications of recent cli-mate change in northern Alaska and other arctic regions, Cli-matic Change, 72, 251–298, 2005.
Howarth, R. W., Billen, G., Swaney, B., Townsend, A., Jaworski, N., Lajtha, K., Downing, J. A., Elmgren, R., Caraco, N., Jordan, T., Berendse, F., Freney, J., Kudeyarov, V., Murdoch, P., and Zhu Zhao, L.: Regional nitrogen budgets and riverine N & P fluxes for the drainages to the North Atlantic Ocean: Natural and hu-man influences, Biogeochemistry, 35, 75–139, 1996.
Humborg, C., Smedberg, E., M¨orth, C.-M., Rahm, L., and Daniels-son, A.: Dissolved silica dynamics in boreal and arctic rivers: vegetation control over temperature?, in: The Silicon Cycle, edited by: Ittekkot, V., Unger, D., Humborg, C., and Tac An, N., Washington DC, Island Press, 53–69, 2006a.
Humborg, C., Conley, D. J., Rahm, L., Wulff, F., Cociasu, A., and Ittekkot, V.: Silicon retention in river basins: Far-reaching effects on biogeochemistry and aquatic food webs in coastal marine en-vironments, Ambio, 29, 45–50, 2000.
Humborg, C., Pastuszak, M., Aigars, J., Siegmund, H., M¨orth, C. M., and Ittekkot, V.: Decreased silica land-sea fluxes through damming in the Baltic Sea catchment – significance of particle trapping and hydrological alterations, Biogeochemistry, 77, 265– 281, 2006b.
Humborg, C., Blomqvist, S., Avsan, E., Bergensund, Y., Smed-berg, E., Brink, J., and M¨orth, C. M.: Hydrological alterations with river damming in northern Sweden: Implications for weath-ering and river biogeochemistry, Global Biogeochem. Cy., 16, GB1039, doi:10.1029/2000GB001369, 2002.
Humborg, C., Smedberg, E., Blomqvist, S., M¨orth, C. M., Brink, J., Rahm, L., Danielsson, A., and Sahlberg, J.: Nutrient variations in boreal and subarctic Swedish rivers: Landscape control of land-sea fluxes, Limnol. Oceanogr., 49, 1871–1883, 2004.
Iital, A., St˚alnacke, P., Deelstra, J., Loigu, E., and Pihlak, M.: Ef-fects of large-scale changes in emissions on nutrient concentra-tions in Estonian rivers in the Lake Peipsi drainage basin, J. Hy-drol., 304, 261–273, 2005.
Johansson, S., Bonsdorff, E., and Wulff, F.: The MARE Re-search Program 1999–2006 – Reflections on program manage-ment, Ambio, 36, 119–122, 2007.
Johnes, P. J., Moss, B., and Phillips, G. L.: The determination of water quality by land use, livestock numbers and population data – testing of a model for use in conservation and water quality management, Freshw. Biol., 36, 451–473, 1996.
Kronvang, B., Jeppesen, E., Conley, D. J., Sondergaard, M., Larsen, S. E., Ovesen, N. B., and Carstensen, J.: Nutrient pressures and ecological responses to nutrient loading reductions in Dan-ish streams, lakes and coastal waters, J. Hydrol., 304, 274–288, 2005.
Lasaga, A.: Kinetic Theory in Earth Sciences, Princton University Press, 1998.
Lehner, B., Czisch, G., and Vassolo, S.: The impact of global change on the hydropower potential of Europe: a model-based analysis, Energy Policy, 33, 839–855, 2005.
L¨ofgren, S., Gustafson, A., Steineck, S., and St˚alnacke, P.: Agri-cultural development and nutrient flows in the Baltic states and Sweden after 1988, Ambio, 28, 320–327, 1999.
Meybeck, M.: Pathways of major elements from land to ocean through rivers, in: River Inputs to Ocean Systems, edited by: Martin, J.-M., Burton, J. D., and Eisma, D., UNEP IOC SCOR United Nations, 18–30, 1979.
M¨orth, C.-M., Humborg, C., Eriksson, E., Danielsson, A., Medina, R., L¨ofgren, S., Swaney, D. P., and Rahm, L.: Modeling river-ine nutrient transport of the Baltic Sea-A large scale approach, Ambio, 36, 124–133, 2007.
Nixon, S. W.: Coastal Marine Eutrophication – a Definition, Social Causes, and Future Concerns, Ophelia, 41, 199–219, 1995. Oenema, O., Boers, P. C. M., van Eerdt, M. M., Fraters, B., van der
Meer, H. G., Roest, C. W. J., Schroder, J. J., and Willems, W. J.: Leaching of nitrate from agriculture to groundwater: the effect of policies and measures in the Netherlands, Environ. Pollut., 102, 471–478, 1998.
Peterson, B. J., Holmes, R. M., McClelland, J. W., V¨or¨osmarty, C. J., Lammers, R. B., Shiklomanov, A. I., Shiklomanov, I. A., and
Rahmstorf, S.: Increasing river discharge to the Arctic Ocean, Science, 298, 2171–2173, 2002.
Rukhovets, L. A., Astrakhantsev, G. P., Menshutkin, V. V., Min-ina, T. R., Petrova, N. A., and Poloskov, V. N.: Development of Lake Ladoga ecosystem models: modeling of the phytoplankton succession in the eutrophication process. I, Ecol. Model., 165, 49–77, 2003.
Sandberg, J., Andersson, A., Johansson, S., and Wikner, J.: Pelagic food web structure and carbon budget in the northern Baltic Sea: potential importance of terrigenous carbon, Mar. Ecol.-Prog. Ser., 268, 13–29, 2004.
Sapek, A.: The Effects of Agriculture on Water Quality: A Polish Perspective, in: Center for Agricultural and Rural Development, Iowa State University, p. 22, 1997.
Schelske, C. L., Stoermer, E. F., Conley, D. J., Robbins, J. A., and Glover, R. M.: Early eutrophication in the lower Great Lakes: New evidence from biogenic silica in sediments, Science, 222, 320–322, 1983.
Schernewski, G. and Neumann, T.: The trophic state of the Baltic Sea a century ago: a model simulation study, J. Mar. Syst., 53, 109–124, 2005.
Smedberg, E., M¨orth, C. M., Swaney, D. P., and Humborg, C.: Modeling hydrology and silicon-carbon interactions in taiga and tundra biomes from a landscape perspective: Implications for global warming feedbacks, Global Biogeochem. Cy., 20, GB2014, doi:10.1029/2005GB002567, 2006.
Sobek, S., Tranvik, L. J., and Cole, J. J.: Temperature independence of carbon dioxide supersaturation in global lakes, Global Bio-geochem. Cy., 19, GB2003, doi:10.1029/2005GB002567, 2006. St˚alnacke, P., Grimvall, A., Sundblad, K., and Wilander, A.: Trends in nitrogen transport in Swedish rivers, Environ. Monit. Assess., 59, 47–72, 1999a.
St˚alnacke, P., Grimvall, A., Sundblad, K., and Tonderski, A.: Esti-mation of riverine loads of nitrogen and phosphorus to the Baltic Sea, 1970–1993, Environ. Monit. Assess., 58, 173–200, 1999b. St˚alnacke, P., Grimvall, A., Libiseller, C., Laznik, A., and Kokorite,
I.: Trends in nutrient concentrations in Latvian rivers and the response to the dramatic change in agriculture, J. Hydrol., 283, 184–205, 2003.
Tranvik, L. J. and Jansson, M.: Climate change – Terrestrial export of organic carbon, Nature, 415, 861–862, 2002.
Treguer, P., Nelson, D. M., van Bennekom, A. J., Demaster, D. J., Leynaert, A., and Queguiner, B.: The silica balance in the world ocean – a reestimate, Science, 268, 375–379, 1995.
Vagstad, N., St˚alnacke, P., Andersen, H. E., Deelstra, J., Jansons, V., Kyllmar, K., Loigu, E., Rekolainen, S., and Tumas, R.: Re-gional variations in diffuse nitrogen losses from agriculture in the Nordic and Baltic regions, Hydrol. Earth Syst. Sci., 8, 651–662, 2004,
http://www.hydrol-earth-syst-sci.net/8/651/2004/.
Vahtera, E., Conley, D. J., Gustafsson, B. G., Kuosa, H., Pitkanen, H., Savchuk, O. P., Tamminen, T., Viitasalo, M., Voss, M., Was-mund, N., and Wulff, F.: Internal ecosystem feedbacks enhance nitrogen-fixing cyanobacteria blooms and complicate manage-ment in the Baltic Sea, Ambio, 36, 186–194, 2007.
Walker, D. A., Auerbach, N. A., Bockheim, J. G., Chapin, F. S., Eu-gster, W., King, J. Y., McFadden, J. P., Michaelson, G. J., Nelson, F. E., Oechel, W. C., Ping, C. L., Reeburg, W. S., Regli, S., Shik-lomanov, N. I., and Vourlitis, G. L.: Energy and trace-gas fluxes
across a soil pH boundary in the arctic, Nature, 394, 469–472, 1998.
Weyhenmeyer, G. A., Meili, M., and Livingstone, D. M.: Nonlinear temperature response of lake ice breakup, Geophys. Res. Lett., 31, LO7203, doi:10.1029/2004GLO19530, 2004.
Winsor, P., Rodhe, J., and Omstedt, A.: Baltic Sea ocean climate: an analysis of 100 yr of hydrographic data with focus on the fresh-water budget, Climate Res., 18, 5–15, 2001.
Witek, Z., Humborg, C., Savchuk, O., Grelowski, A., and Lysiak-Pastuszak, E.: Nitrogen and phosphorus budgets of the Gulf of Gdansk (Baltic Sea), Estuar. Coast. Shelf Sci., 57, 239–248, 2003.
Wulff, F., Savchuk, O., Sokolov, A., Humborg, C., and M¨orth, C.-M.: Management options and effects on a marine ecosystem: As-sessing the future of the Baltic., Ambio, 36, 243–249, 2007. Zessner, M. and Lindtner, S.: Estimations of municipal point source
pollution in the context of river basin management, Water Sci. Technol., 52, 175–182, 2005.